. 2018 Aug 31;361(6405):eaam8419.
doi: 10.1126/science.aam8419.

Rearrangement bursts generate canonical gene fusions in bone and soft tissue tumors

Affiliations

Rearrangement bursts generate canonical gene fusions in bone and soft tissue tumors

Nathaniel D Anderson et al. Science. .

Abstract

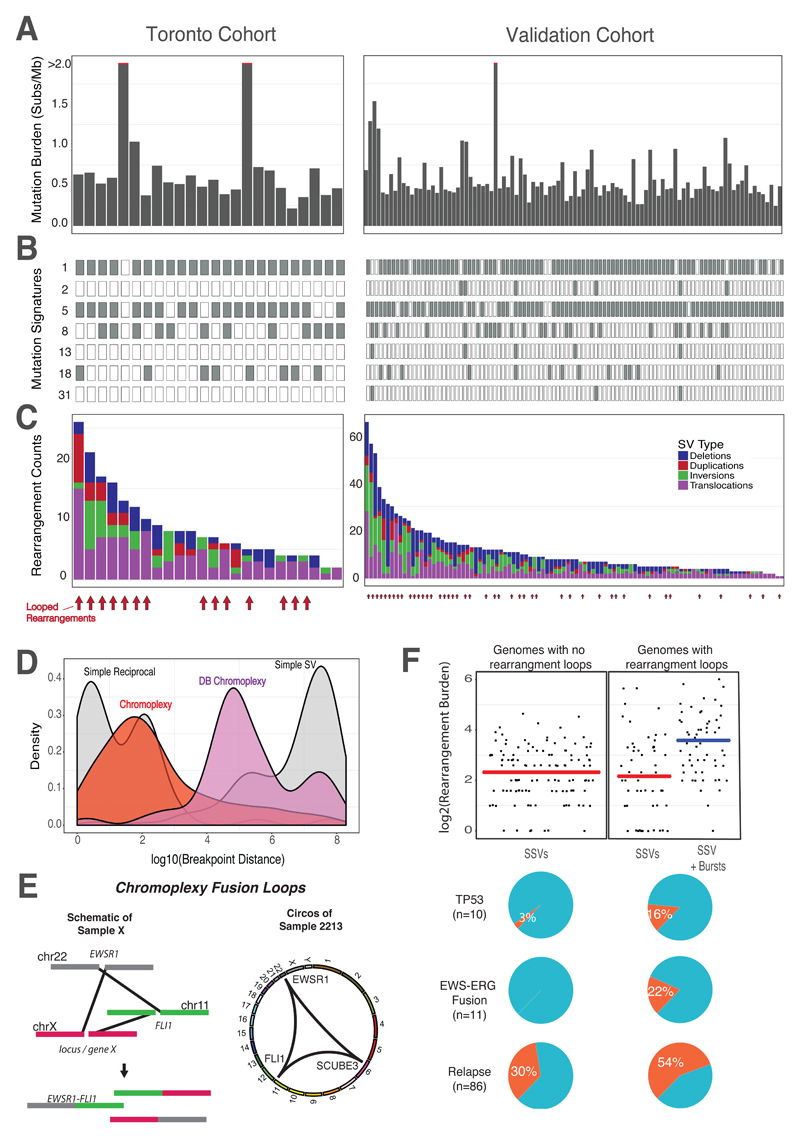
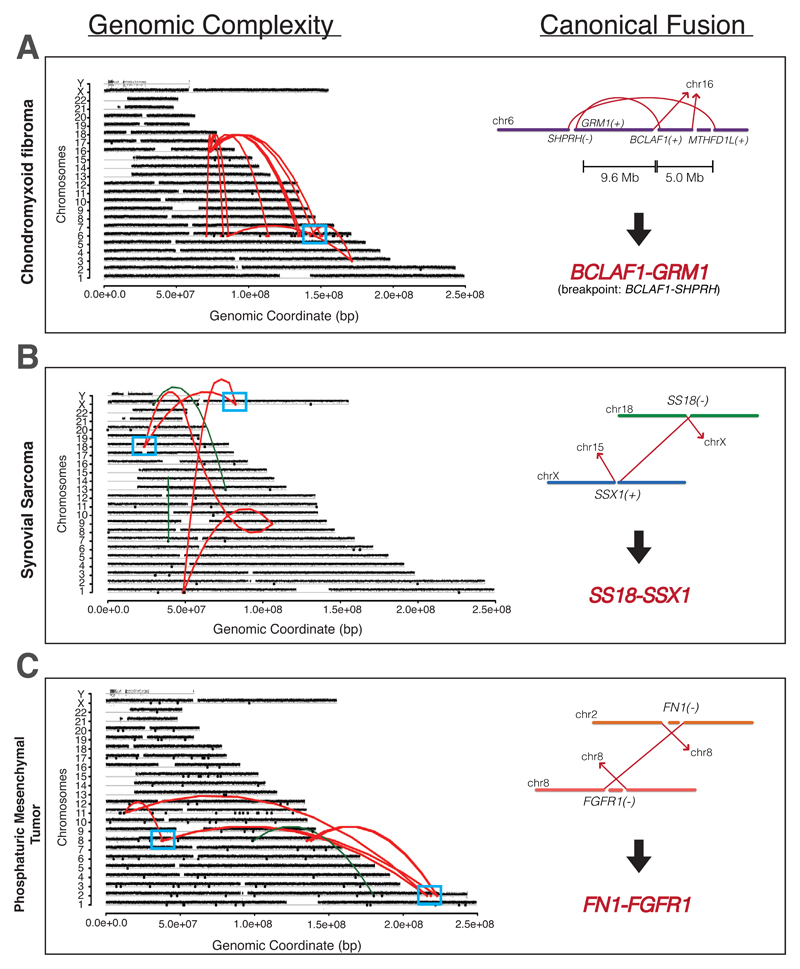
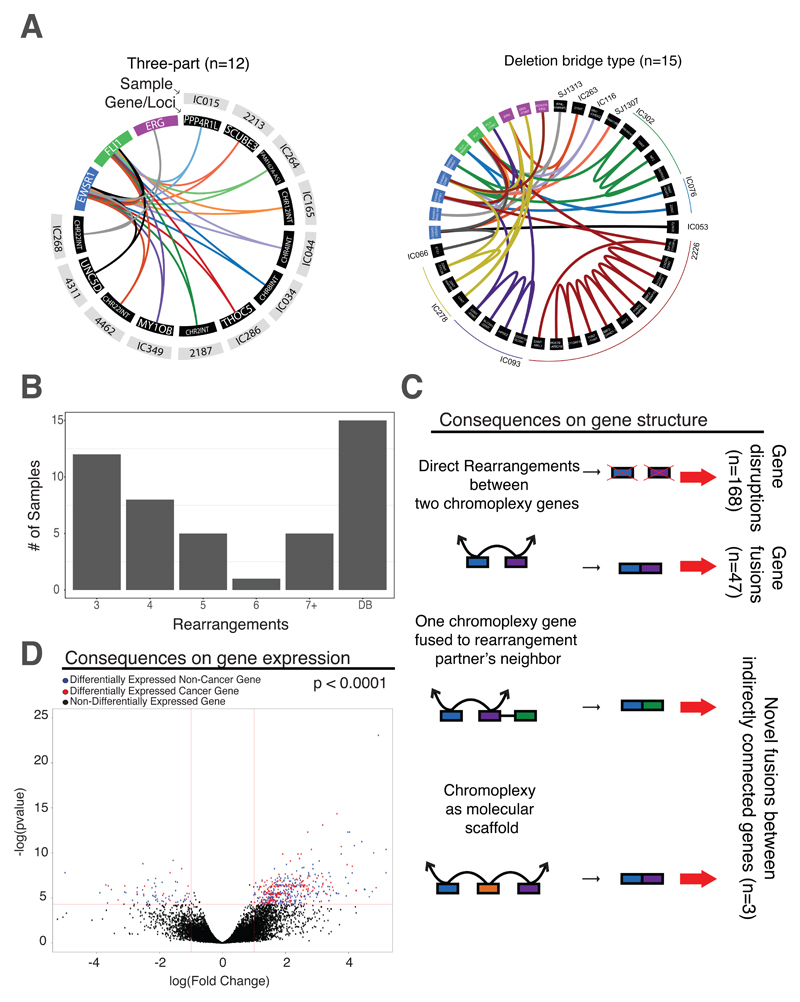
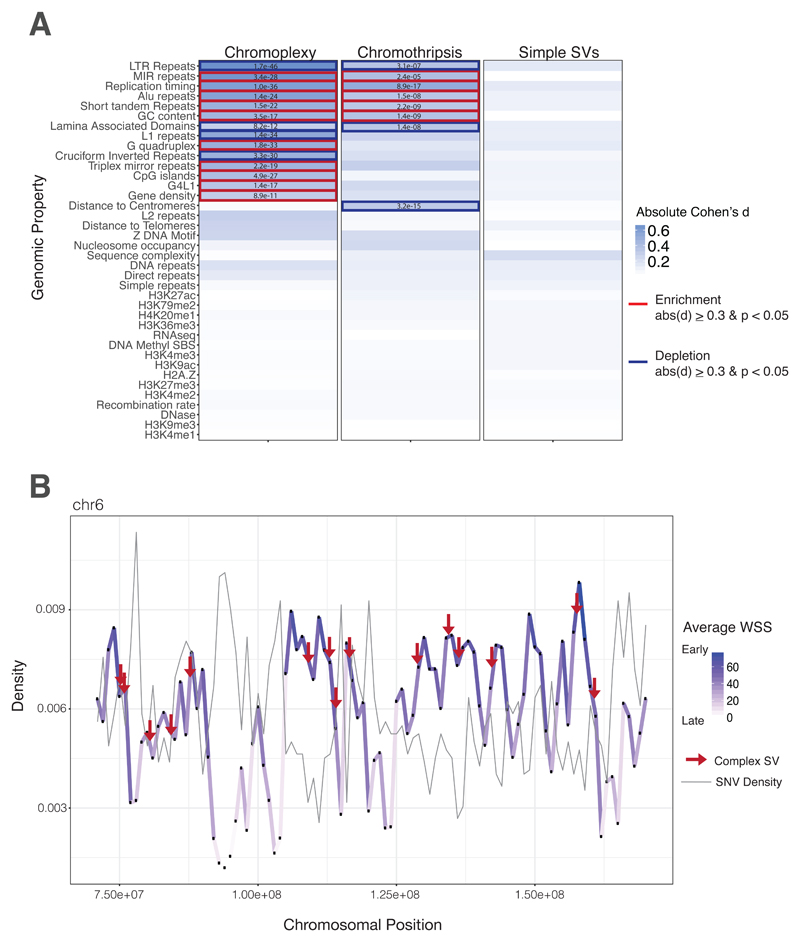
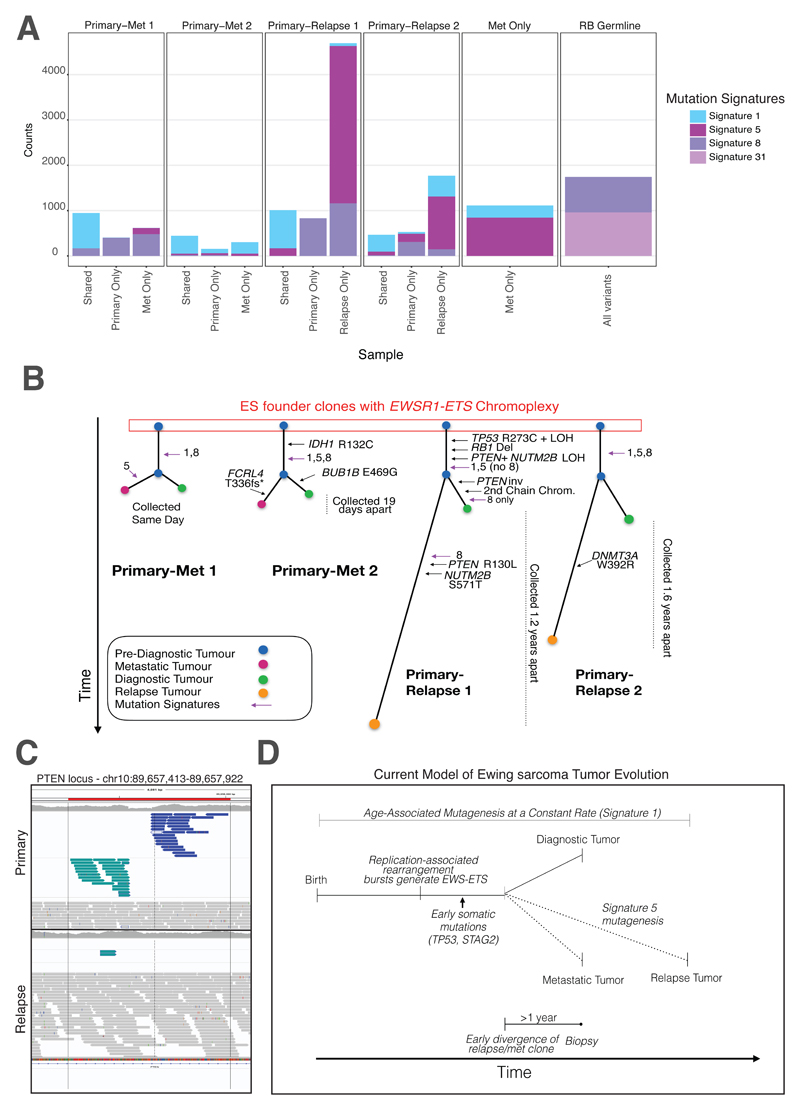
Sarcomas are cancers of the bone and soft tissue often defined by gene fusions. Ewing sarcoma involves fusions between EWSR1, a gene encoding an RNA binding protein, and E26 transformation-specific (ETS) transcription factors. We explored how and when EWSR1-ETS fusions arise by studying the whole genomes of Ewing sarcomas. In 52 of 124 (42%) of tumors, the fusion gene arises by a sudden burst of complex, loop-like rearrangements, a process called chromoplexy, rather than by simple reciprocal translocations. These loops always contained the disease-defining fusion at the center, but they disrupted multiple additional genes. The loops occurred preferentially in early replicating and transcriptionally active genomic regions. Similar loops forming canonical fusions were found in three other sarcoma types. Chromoplexy-generated fusions appear to be associated with an aggressive form of Ewing sarcoma. These loops arise early, giving rise to both primary and relapse Ewing sarcoma tumors, which can continue to evolve in parallel.


Conflict of interest statement

Competing Interests

The authors declare no competing interests.

Figures

Fig. 1
Fig. 1. Mutation Landscape of Ewing Sarcoma.
The initial cohort consisted of 50 primary ES tumors, of which, 23 underwent whole genome sequencing (Toronto cohort, left). One rearrangement screen sample (sample 4462) is included in this figure. The validation cohort consisted of 100 ES whole-genomes from Tirode et al. 2014 (right). (A) Somatic mutation burden for Ewing sarcoma. The mutation burden of all genome samples are shown. Three outlier samples with >2 mutations/MB, are indicated by the red line. (B) Ewing sarcoma mutation signatures. Mutation signature analysis, defined by the proportion of 96 possible trinucleotides, identified common mutation patterns in most samples (Age-associated, “clock-like” signature 1). Other signatures included #2, 5, 8, 13, 18, and 31. Signatures 2 and 13 are associated with the activity of the AID/APOBEC family of cytidine deaminase, while Signature 5 is also clock-like in some cancers, but not ES (11, 13). Signatures 8 and 18 have an unknown molecular aetiology, however it has been suggested that Signature 18 is caused by reactive oxygen species (ROS)(43). Signature 31 is believed to be the result of exposure to platinum-based antineoplastic therapy (24).(C) Rearrangement profiles for Ewing sarcoma. Shown are the burden of deletions (blue), duplications (red), inversions (green) and translocations (purple) in individual ES genomes. Samples with chained complex rearrangements (looped rearrangements) are highlighted by red arrows (14/24 for Toronto, 38/100 for Validation, aggregated prevalence: 52/124). (D) Rearrangement breakpoint clusters. The aggregated density distributions of the genomic distance between consecutive rearrangement breakpoints are shown. Reciprocal breakpoints are close together (~102 bp) because there is an equal exchange of genetic material arising from a single break on each chromosome. Chromoplectic rearrangements (red) overlap this range due to the proximity breakpoints involved in looped rearrangements. Deletion bridge (DB) chromoplexy (purple) are looped rearrangement clusters in which a deletion spans two breakpoints, resulting in breakpoint distances that are farther apart (illustrated in fig. S11). Non-complex breakpoints (simple structural variants) are far apart (~108 bp). (E) Schematic diagram of chromoplexy fusion loops. Illustrative example of chromoplexy in Ewing sarcoma shows three chromosomes undergoing double-strand breakage, shuffling and religation in an aberrant configuration. This phenomenon generates the canonical fusion, EWSR1-FLI1 (ERG or ETV1) and disrupts a third locus, X, in a one-off burst of rearrangements. In reality, up to 8 chromosomes may be disrupted in this looping pattern. A representative genome-wide Circos plots depicting genomic rearrangements in an Ewing sarcoma tumor (from the discovery cohort), which are organized in a loop. (F) Genomic correlates and clinical impact of looped rearrangements. In genomes without rearrangement loops, only simple structural variants (SSV) exist with an average rearrangement burden of 7 rearrangements/sample. This rate is similar to the background SSV rate (determined by removing rearrangements involved in a loop) in genomes with rearrangement bursts (compare the two red lines). The additional complexity of looped rearrangements results in higher genomic instability in these tumors. The most common genomic alterations include somatic TP53 mutations, which are rare, but enriched in patients with complex genomes (top pie chart, p < 0.05). EWS-ERG fusions are also rare, as they represent 10% of all Ewing sarcoma diagnoses, however all EWS-ERG fusion Ewing tumors are either chomothriptic or chromoplectic (middle pie chart). Lastly, patients with complex genomes tend to relapse (bottom pie chart, p < 0.05). All the markers of aggressive disease (high genomic instability, somatic TP53 and relapse) are present in tumors with complex genomes.
Fig. 2
Fig. 2. Genomic Catastrophes are Common in Sarcomas.
Copy number profile for fusion-driven sarcomas with chromoplexy are shown. Rearrangements are colored red, and the loci with the canonical fusion are highlighted (blue box) and enlarged on the right. (A) Chrondromyxoid fibroma (CMF) with chromoplexy. The genomic breakpoint lies in the upstream SHPRH gene, while the BCLAF1-GRM1 fusion was detected by RNA sequencing. Further complex CMFs, which also show a SHRPRH genomic breakpoint but GRM1 fusion, can be found in fig. S8. (B) Synovial sarcoma with chromoplexy. Chromoplexy generating the SS18-SSX1 pathognomonic canonical fusion is shown. (C) Phosphaturic mesenchymal tumor (PMT) with chromoplexy. Genome sequencing of PMTs revealed deletion bridges occurring across the genome at chromoplectic loci, generating the canonical FN1-FGFR1 fusion.
Fig. 3
Fig. 3. Characterizing chromoplexy loops that generate EWSR1-ETS in ES.
(A) Patterns of looped rearrangements. Chromoplexy circos webs demonstrate that patterns of looped rearrangements are conserved across samples, while different genes or loci are affected in each cancer (black panels). In each web, individual samples are denoted using a different color (and named in the grey panel). In all cases, central to chromoplexy fusion loops were the key driver genes: EWSR1 (blue), FLI1 (green) and ERG (purple). The most frequent patterns of chromoplexy in Ewing sarcoma are those with a three-way looping structure as well as the presence of deletion bridges. For those with deletion bridges, “adj” refers to adjacent loci affected. An enlarged Circos web can be found in fig. S9 for readability. Three samples have structures only involving EWSR1, FLI1 and adjacent loci. Sample 4004 has deletion bridge chromoplexy and is described in fig. S3C. (B) Summary of chromoplexy types. Bar chart showing the number of rearrangements in a loop (x-axis) and the number of samples with that rearrangement pattern. Other chromoplexy web structures can be found in fig. S10. (C) Transcriptional consequences of chromoplexy: gene expression. Volcano plot illustrating the differential gene expression in chromoplexy vs non-chromoplexy ES, revealing 504 differentially expressed genes. Points greater than 1 or less than -1 and above the 1.3 (as indicated by the red lines) are genes that are significantly differentially expressed (blue dots). Red dots highlight genes that are differentially expressed and involved in a cancer hallmark pathway. (D) Transcriptional consequences of chromoplexy: gene disruptions and fusions. There are three mechanisms of gene dysregulation via RNA fusion when chromoplexy occurs. The first involves two genes (blue and purple boxes) brought together by chromoplectic rearrangements (black arrowed lines) leading to gene disruptions (top scenario) and novel inframe fusions (2nd from top scenario). This was detected in the 3/10 cases where there was genome (+chromoplexy) and transcriptome sequencing available. When RNA sequencing was not available, these are predicted to cause fusions (n=47, excluding the EWSR1-ETS driver) and gene disruptions by fusing genes in opposite transcriptional orientation or fusing a gene to an intergenic sequence (n=168). The second mechanism involves two chromoplexy genes brought together by a rearrangement at the genomic level, but one of the partner’s neighboring genes (green box) is transcriptionally fused to the other chromoplexy partner in its place (3rd from top scenario). This is also the predominant mechanism of GRM1 fusion generation in chrondromyxoid fibromas (fig. S8). Lastly, the final mechanism of gene dysregulation occurs when chromoplexy facilitates the production of a fusion by acting as a molecular scaffold (bottom scenario; illustrated in fig. S12). Two genes are both rearranged to a third locus (orange) and are then, transcriptionally, fused together. No direct genomic link exists between these two genes. These phenomena can only be detected if both whole-genome and RNA-Seq are available.
Fig. 4
Fig. 4. Early Replicating DNA and Chromoplexy.
(A) Heatmap of genomic property associations. The genomic properties listed in supplementary table 4 were calculated for all rearrangements in both cohorts. Complex rearrangements (chromoplexy and chromothripsis), exclusively, are strongly associated with early replication timing, and other genomic features consistent with this feature (gene density, CpG density, Alu density etc.). Table values are indicative of FDR-corrected p-values compared to a million random points in the genome. Blue highlights are indicative of a Cohen’s d equal to or greater than 0.3. Bold boxes indicate a positive (red, enrichment) or negative (blue, depletion) association with the feature. All features were evaluated in 1 kb bins across the genome. For feature density metrics, associations were calculated in 1MB sliding windows centered in 1 kb bins. (B) Density distribution of the average wavelet-smoothed signal and SNVs on representative chromosome. The average wavelet-smoothed signal, of replication timing, is plotted for a subset of chromosome 6 to illustrate changes between early and late replication timing and the co-association with mutations in ES. The positional variation of replication timing across the chromosome is depicted as changes in density and color. Point mutations peak in late-replicating regions (dip in WSS, light purple), whereas complex rearrangements peak in regions of early replication timing (peak in WSS, dark purple).
Fig. 5
Fig. 5. Mutation Signatures and Relapse and Metastatic ES Tumors.
(A) Prevalence of mutation signatures in relapse and metastatic tumors. Shared and private mutations for four primary-metastatic or relapse pairs are shown (first four columns). Signatures 1 and 5 are common throughout, with signature 5 contributing significantly to the mutations that arise at relapse. Signature 8 was also common throughout the cohort. One metastatic tumor (no paired primary) is also shown to have similar mutation signature patterns as other metastatic/relapse tumors. Lastly, a secondary Ewing sarcoma tumor to a primary retinoblastoma (germline RB1 mutation identified) was also sequenced in this cohort. This patient harbored the rare Signature 31, which likely resulted from the patient’s prior exposure to carboplatin for their primary RB (only patient to receive this treatment in the Toronto cohort). (B) Phylogenetic trees of primary-relapse/metastatic ES. Using the shared and private mutations, we identified the mutational order in ES. Known cancer-driver mutations (IDH1, TP53 etc.) arise early (shared branches). (C) A clonal PTEN inversion. A PTEN inversion was found only in the primary and not in the relapse tissue, suggesting the inversion arose after early divergence of a common clonal ancestor. However, a pathogenic PTEN SNV can be found in the relapse tissue. Together, these point towards parallel, convergent evolution on this gene. (D) Proposed model of Ewing sarcoma tumor evolution. After birth, Signature 1 is operative in all somatic tissues throughout life. ES patients’ cells experience a replication-associated burst of rearrangements that generates the canonical fusion driver. Early somatic cancer gene mutations occur before clonal bifurcation. This occurs 1-2 years before an ES diagnosis, thus the cells that would give rise to the relapse existed years before diagnosis. Signature 5 contributes significantly to the number of mutations seen at relapse.

Comment in

  • Fusion oncogenes-genetic musical chairs.
    Imielinski M, Ladanyi M. Imielinski M, et al. Science. 2018 Aug 31;361(6405):848-849. doi: 10.1126/science.aau8231. Science. 2018. PMID: 30166475 No abstract available.

References

    1. Stephens PJ, et al. Massive genomic rearrangement acquired in a single catastrophic event during cancer development. Cell. 2011;144:27–40. - PMC - PubMed
    1. Baca SC, et al. Punctuated evolution of prostate cancer genomes. Cell. 2013;153:666–677. - PMC - PubMed
    1. Mitelman F, Johansson B, Mertens F. The impact of translocations and gene fusions on cancer causation. Nat Rev Cancer. 2007;7:233–245. - PubMed
    1. Papaemmanuil E, et al. RAG-mediated recombination is the predominant driver of oncogenic rearrangement in ETV6-RUNX1 acute lymphoblastic leukemia. Nat Genet. 2014;46:116–125. - PMC - PubMed
    1. Sankar S, Lessnick SL. Promiscuous partnerships in Ewing's sarcoma. Cancer Genet. 2011;204:351–365. - PMC - PubMed

Publication types

Substances