. 2018 Aug 31;361(6405):924-928.
doi: 10.1126/science.aat5641. Epub 2018 Aug 30.

Three-dimensional genome structures of single diploid human cells

Affiliations

Three-dimensional genome structures of single diploid human cells

Longzhi Tan et al. Science. .

Abstract

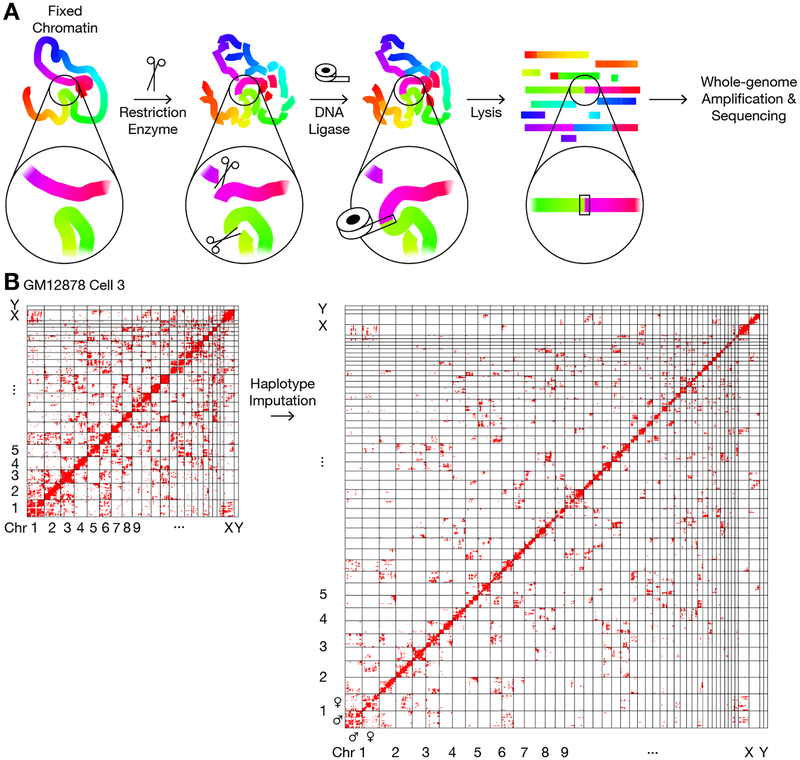
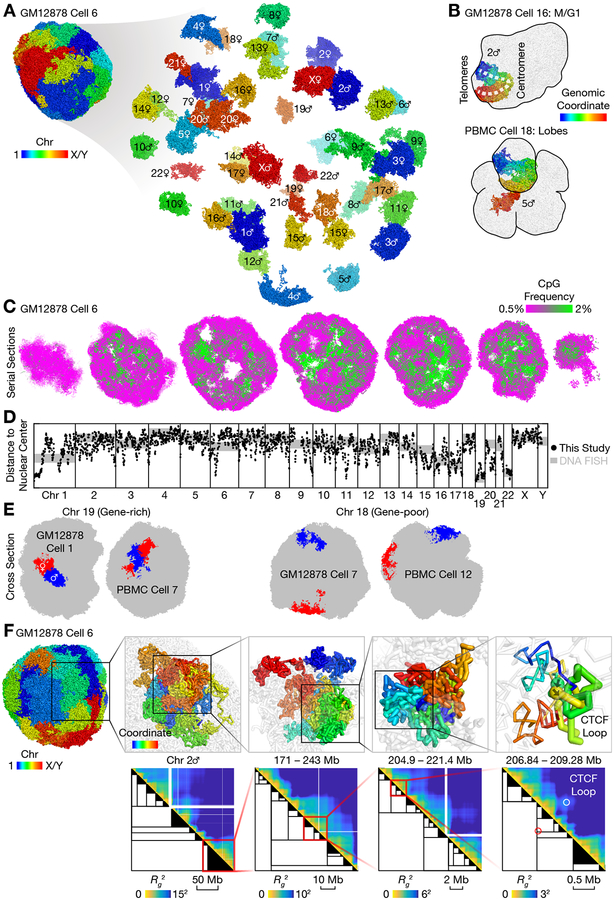
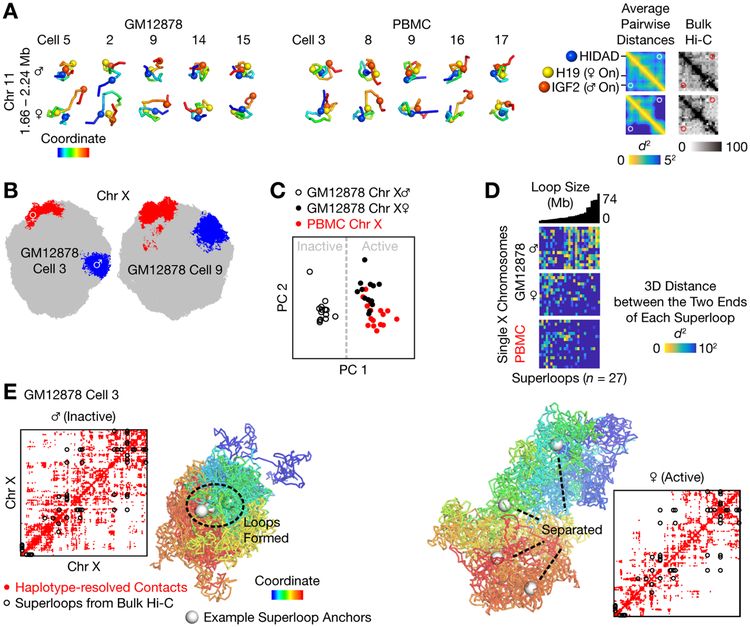
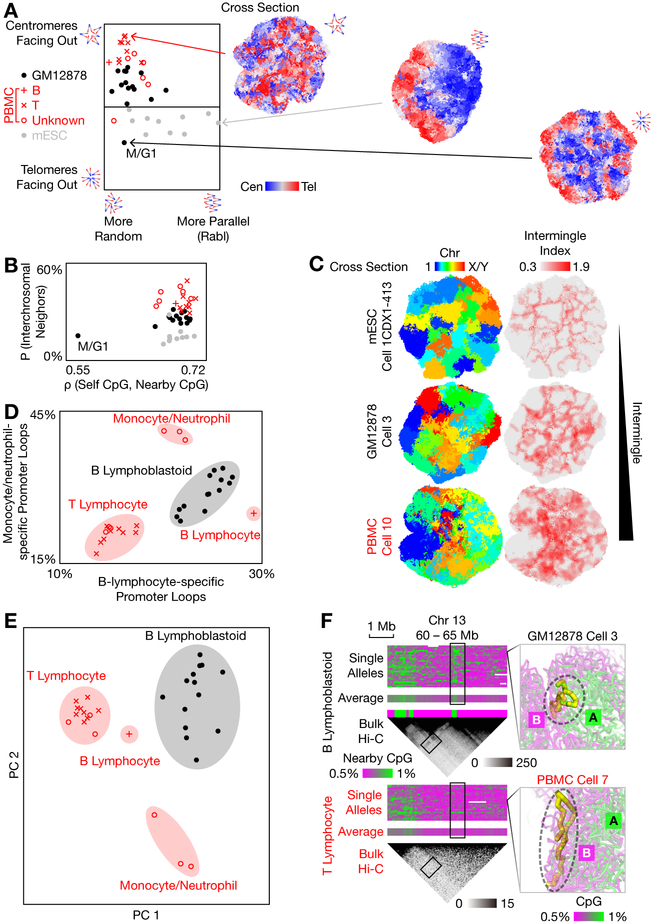
Three-dimensional genome structures play a key role in gene regulation and cell functions. Characterization of genome structures necessitates single-cell measurements. This has been achieved for haploid cells but has remained a challenge for diploid cells. We developed a single-cell chromatin conformation capture method, termed Dip-C, that combines a transposon-based whole-genome amplification method to detect many chromatin contacts, called META (multiplex end-tagging amplification), and an algorithm to impute the two chromosome haplotypes linked by each contact. We reconstructed the genome structures of single diploid human cells from a lymphoblastoid cell line and from primary blood cells with high spatial resolution, locating specific single-nucleotide and copy number variations in the nucleus. The two alleles of imprinted loci and the two X chromosomes were structurally different. Cells of different types displayed statistically distinct genome structures. Such structural cell typing is crucial for understanding cell functions.


Conflict of interest statement

Competing interests: L.T., D.X., C.H.C., and X.S.X. are inventors on a provisional patent application US 62/509,981 filed by Harvard University that covers META and Dip-C.

Figures

Fig. 1.
Fig. 1.. Single-cell chromatin conformation capture and haplotype imputation by Dip-C.
(A) Schematics of the chromatin conformation capture protocol. The 3D information of chromatin structure was encoded in the linear genome through proximity ligation of chromatin fragments, as in 3C (4) and Hi-C (5, 19). Ligation product was then amplified by META (15) and sequenced. Colors represented genomic coordinates. Note that ligation products may be linear (illustrated here) or circular (not shown). (B) Imputation of the two chromosome haplotypes linked by each chromatin “contact” (red dot) in a representative single cell.
Fig. 2.
Fig. 2.. 3D genome structures of single diploid human cells.
(A) 3D genome structure of a representative GM12878 cell. Each particle represents 20 kb of chromatin, or a radius of ~ 100 nm. (B) Peculiar nuclear morphology in a cell that recently exited mitosis (upper panel) and in a cell with multiple nuclear lobes (lower panel). (C) Serial cross sections of a single cell showed compartmentalization of euchromatin (green) and heterochromatin (magenta), visualized by CpG frequency as a proxy (21). (D) Radial preferences across the human genome, as measured by average distances to the nuclear center of mass. Our results (black dots, smoothed by 1-Mb windows) agreed well with published DNA FISH data (gray lines) on whole chromosomes (22) (shifted and rescaled), and provided novel fine-scale information. Axis limits were 20 and 50 particle radii for the black dots. GM12878 Cell 4 (extensive chromosomal aberrations) and Cell 16 (M/G1 phase) was excluded. (E) Example radial preferences of two chromosomes. The gene-rich chromosome 19 preferred the nuclear interior (left), while the gene-poor chromosome 18 almost always resided on the nuclear surface (right). (F) Stochastic fractal organization of chromatin was quantified by a matrix of radii of gyration of all possible subchains of each chromosome (heatmaps). We identified a hierarchy of single-cell domains across genomic scales (black trees). A subtree was simplified as a black triangle if either of its two subtrees was below a certain size (from left to right: 10 Mb, 2 Mb, 500 kb, 100 kb). In each panel, the region from the previous panel was shown in transparent gray. In the rightmost panel, thick sticks (top) and circles (bottom) highlighted the formation of a known CTCF loop (19). Spheres with arrows (top) heighted the positions and orientations of the two converging CTCF sites. Genomic coordinates were in hg19.
Fig. 3.
Fig. 3.. Distinct 3D structures of the maternal and the paternal alleles.
(A) Structural difference between the two alleles of the imprinted H19/IGF2 locus. Despite cell-to-cell heterogeneity, the maternal allele more frequently separated IGF2 from both H19 and the nearby HIDAD site and disrupted the IGF2-HIDAD CTCF loop (white and red circles). Spheres highlighted three CTCF sites from bulk Hi-C. Heatmaps showed the r.m.s. average pairwise distances between all 20-kb particles. Haplotype-resolved bulk Hi-C (black heatmap, with 25-kb bins) was from Fig. 7C of (19). (B) The active (red) and inactive (blue) X chromosomes preferred extended and compact morphologies, respectively, as shown by cross sections of two representative cells. (C) Individual active and inactive X chromosomes could be distinguished by principal component analysis (PCA) of single-cell chromatin compartments, defined for each 20-kb particle as the average CpG frequency of nearby particles. (D) The inactive X chromosome tended to form the previously reported “superloops” — 27 very-long-range (5–74 Mb) chromatin loops identified by bulk Hi-C (19, 20, 29). Superloops were sorted by sizes (Mb). (E) Haplotype-resolved contact maps (red dots) and 3D structures of the two X chromosomes in an example cell. Black circles denoted all superloops (19). White spheres denoted 4 example superloop anchors (DXZ4, x75, ICCE, and FIRRE). GM12878 Cells 4 and 16 were excluded from (C) and (D).
Fig. 4.
Fig. 4.. Cell-type-specific chromatin structures.
(A) Quantification of the organization of centromeres and telomeres. The mESCs exhibited stronger Rabl configuration (horizontal axis; the length of summed centromere-to-telomere vectors normalized by the total particle number, which was different between human and mouse; axis limit = 0.005 particle radii), while the PBMCs tended to point centromeres outwards relative to telomeres (vertical axis; the summed centromere-to-telomere difference in distances from the nuclear center of mass normalized by the total particle number; axis limit = 0.007 particle radii). Each marker represented a single cell and was inferred by V(D)J recombination in PBMCs (Table S1, Fig. S3B). (B) Quantification of chromosome intermingling (vertical axis; the average fraction of nearby particles that were not from the same chromosome) and chromatin compartmentalization (horizontal axis; Spearman’s correlation between each particle’s own CpG frequency and the average of nearby particles). (C) Example cross sections of 3 cell types, colored by chromosomes (left) or by the multi-chromosome intermingle index (right). (D) Among the human cells, 4 cell-type clusters (shaded) — B lymphoblastoid cells, presumable T lymphocytes, B lymphocytes, and presumable monocytes/neutrophils (PBMC Cells 9, 14, and 18) — could be distinguished from the differential formation (defined as end-to-end distance ≤ 3 particle radii) of known cell-type-specific promoter-enhancer loops from published bulk promoter capture Hi-C (35). (E) The same 4 clusters could also be distinguished by unsupervised clustering via PCA of single-cell chromatin compartments, without the need for bulk data. The two alleles of each locus were treated as two different loci. (F) An example region that was differentially compartmentalized between two cell types (black: B lymphoblastoid cells; red: presumable T lymphocytes). Right panels visualized the configuration of the ~ 0.5-Mb region (chr 13: 62.5 – 63 Mb, thick yellow sticks) with respect to the rest of the genome (transparent, colored by CpG frequencies) in two representative cells. Only the paternal alleles were shown. Bulk Hi-C (black heatmap, with 50-kb bins) was from (19, 40). GM12878 Cell 4 was excluded. GM12878 Cell 16 was excluded from (D) and (E).

References

    1. Cremer T, Cremer C, Chromosome territories, nuclear architecture and gene regulation in mammalian cells. Nat Rev Genet 2, 292–301 (2001). - PubMed
    1. Solovei I, Kreysing M, Lanctot C, Kosem S, Peichl L, Cremer T, Guck J, Joffe B, Nuclear Architecture of Rod Photoreceptor Cells Adapts to Vision in Mammalian Evolution. Cell 137, 356–368 (2009). - PubMed
    1. Clowney EJ, LeGros MA, Mosley CP, Clowney FG, Markenskoff-Papadimitriou EC, Myllys M, Barnea G, Larabell CA, Lomvardas S, Nuclear Aggregation of Olfactory Receptor Genes Governs Their Monogenic Expression. Cell 151, 724–737 (2012). - PMC - PubMed
    1. Dekker J, Rippe K, Dekker M, Kleckner N, Capturing chromosome conformation. Science 295, 1306–1311 (2002). - PubMed
    1. Lieberman-Aiden E, van Berkum NL, Williams L, Imakaev M, Ragoczy T, Telling A, Amit I, Lajoie BR, Sabo PJ, Dorschner MO, Sandstrom R, Bernstein B, Bender MA, Groudine M, Gnirke A, Stamatoyannopoulos J, Mirny LA, Lander ES, Dekker J, Comprehensive mapping of long-range interactions reveals folding principles of the human genome. Science 326, 289–293 (2009). - PMC - PubMed

Publication types

MeSH terms