. 2018 Aug 30;9(9):896.
doi: 10.1038/s41419-018-0903-4.

High NRF2 level mediates cancer stem cell-like properties of aldehyde dehydrogenase (ALDH)-high ovarian cancer cells: inhibitory role of all-trans retinoic acid in ALDH/NRF2 signaling

Affiliations

High NRF2 level mediates cancer stem cell-like properties of aldehyde dehydrogenase (ALDH)-high ovarian cancer cells: inhibitory role of all-trans retinoic acid in ALDH/NRF2 signaling

Donghyeok Kim et al. Cell Death Dis. .

Abstract

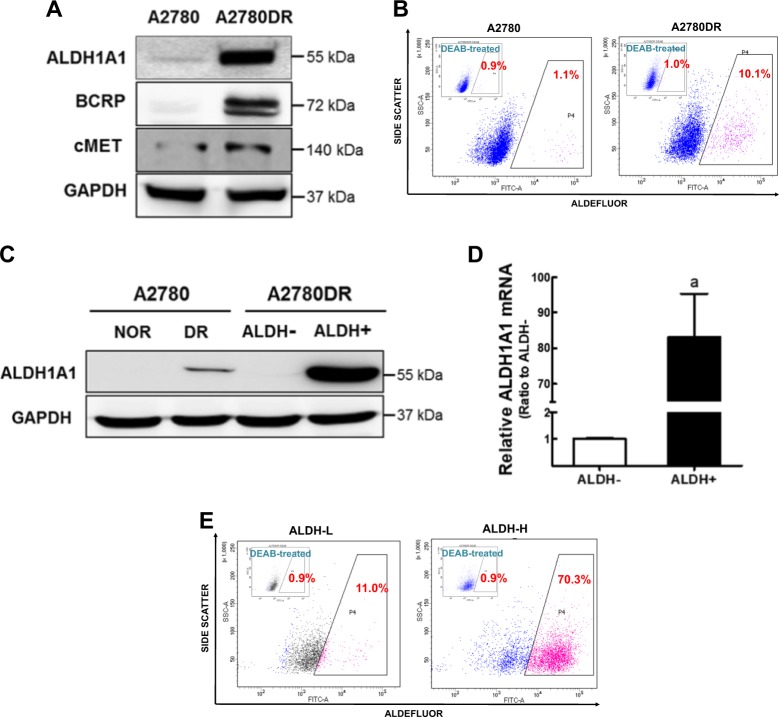
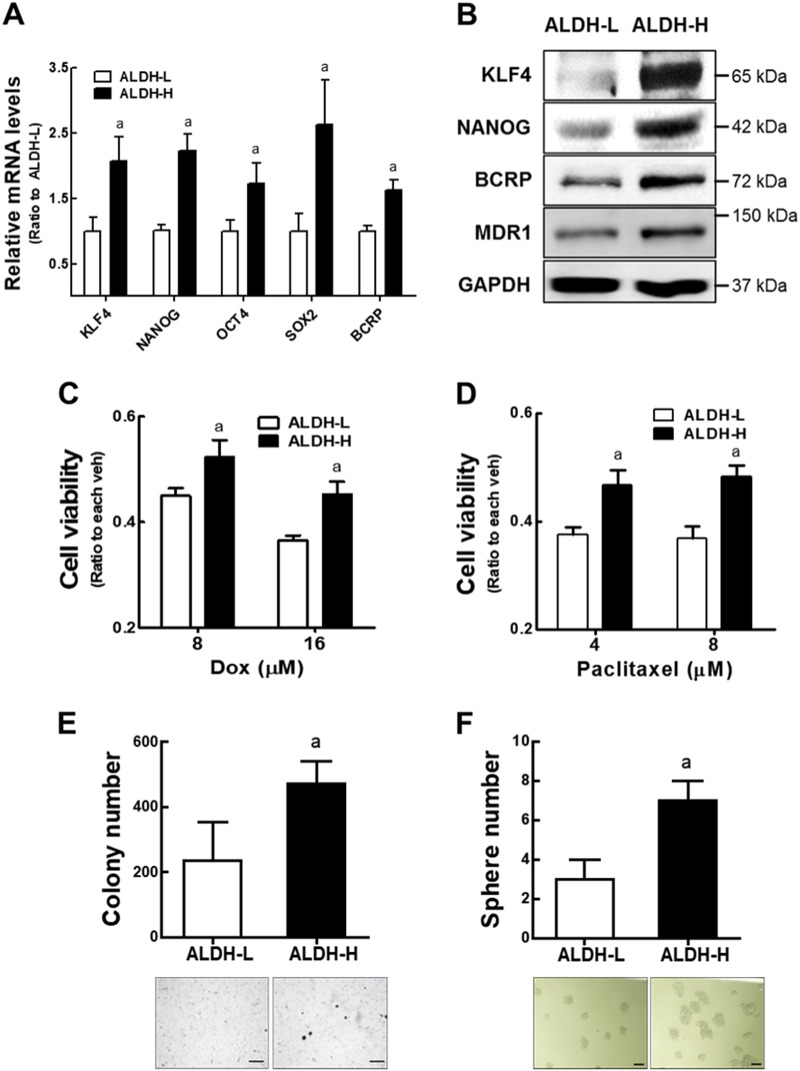
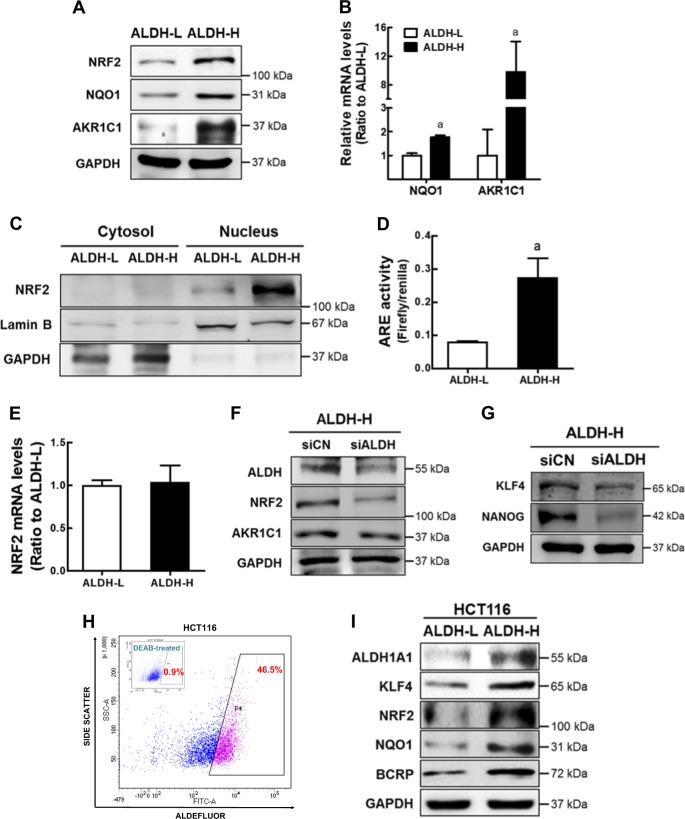
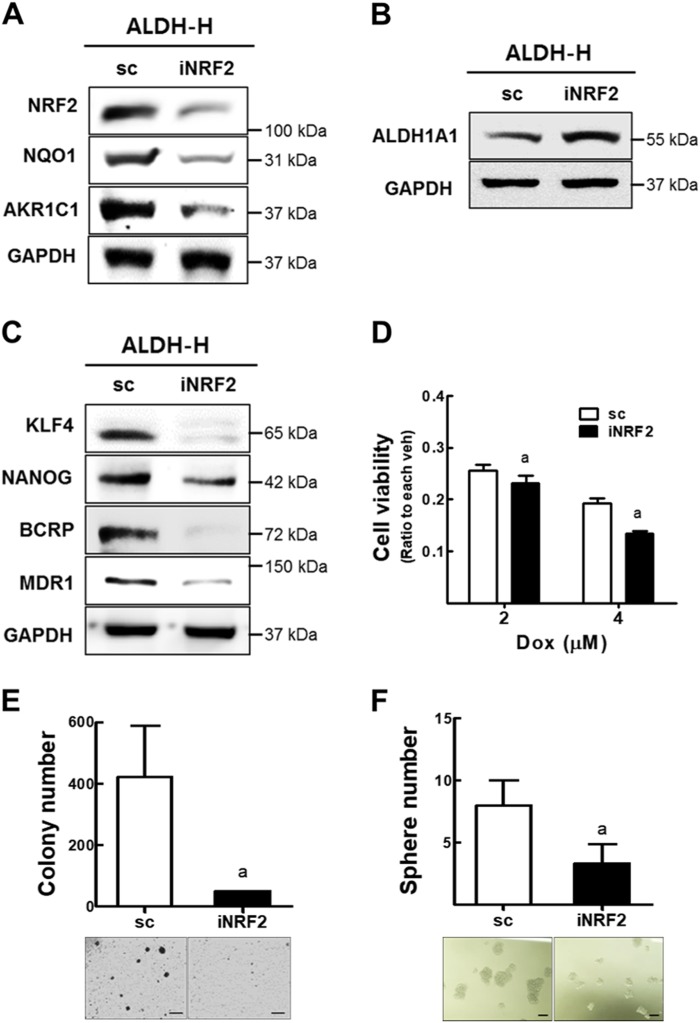
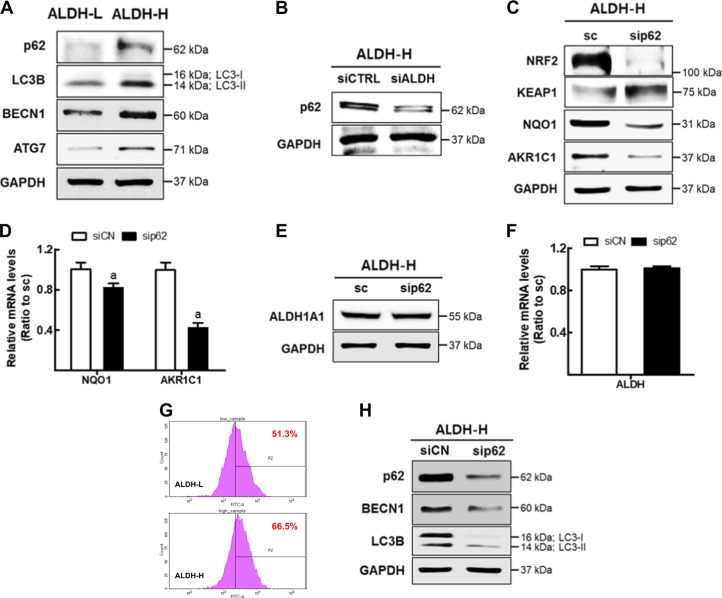
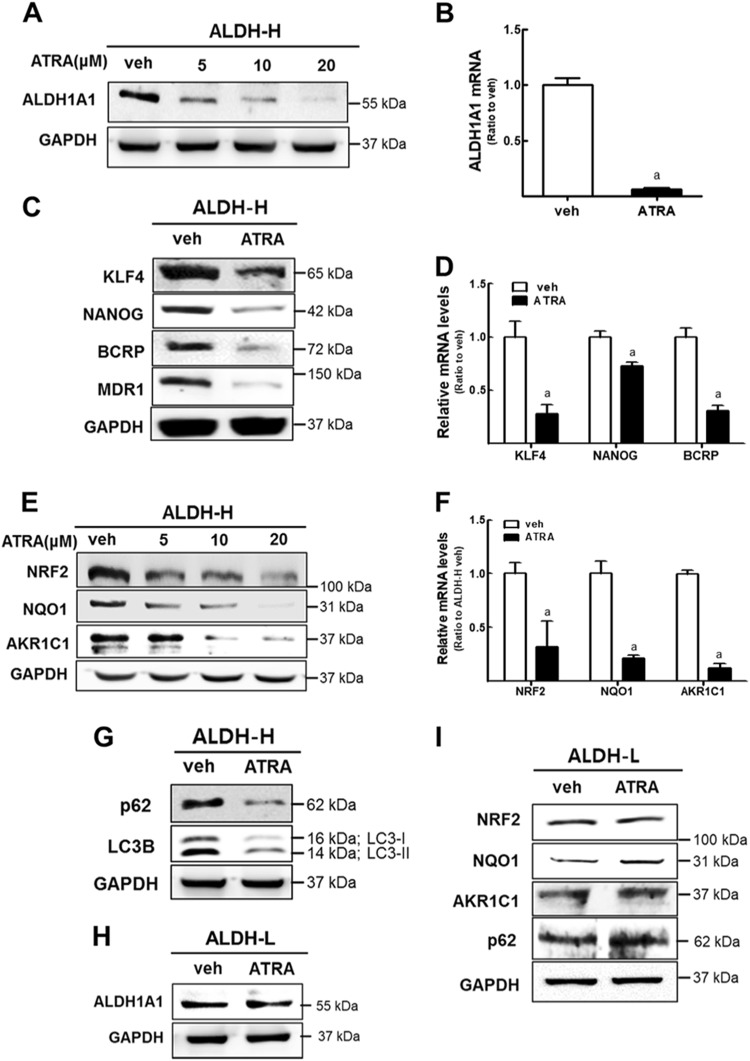
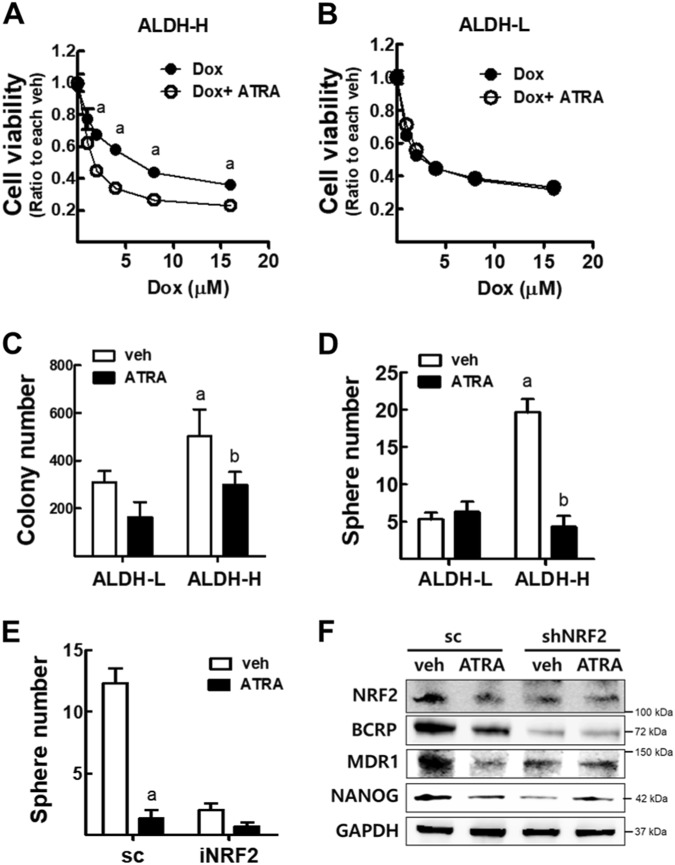
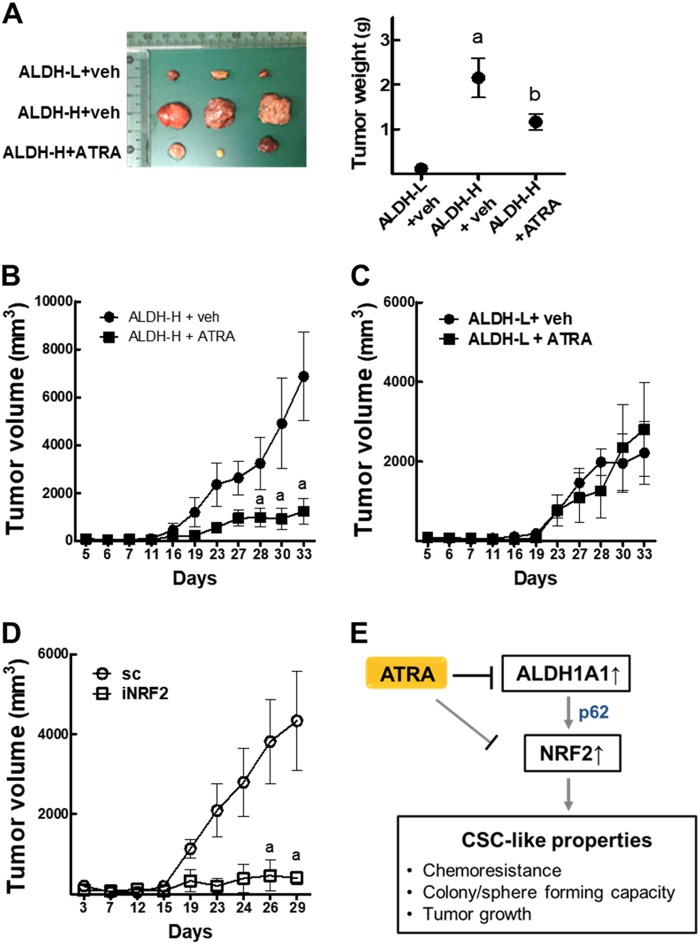
Aldehyde dehydrogenase 1A1 (ALDH1A1) is one of cancer stem cell (CSC) markers, and high ALDH1 expression has been related to drug resistance and facilitated tumor growth. In this study, we investigated the potential involvement of nuclear factor erythroid 2-like 2 (NFE2L2/NRF2) in CSC-like properties of ALDH-high ovarian CSCs. Our experimental system, ALDH1A1-high (ALDH-H) subpopulation, was isolated and stabilized using doxorubicin-resistant ovarian cancer A2780 cells. ALDH-H exerted CSC-like properties such as drug resistance, colony/sphere formation, and enhanced tumor growth along with high levels of CSCs markers compared to ALDH1A1-low (ALDH-L). Levels of NRF2 and subsequent target genes substantially increased in ALDH-H cells, and the increase in ALDH1A1 and p62 was associated with NRF2 upregulation. ALDH1A1-silencing blocked increases in NRF2, drug efflux transporters, and p62, along with CSC markers in ALDH-H cells. The inhibition of p62, which was elevated in ALDH-H, suppressed NRF2 activation. High NRF2 level was confirmed in the ALDH1-high subpopulation from colon cancer HCT116 cells. The functional implication of NRF2 activation in ovarian CSCs was verified by two experimental approaches. First, CSC-like properties such as high CSC markers, chemoresistance, colony/sphere formation, and tumor growth were significantly inhibited by NRF2-silencing in ALDH-H cells. Second, all-trans retinoic acid (ATRA) suppressed ALDH1 expression, inhibiting NRF2 activation, which led to the attenuation of CSC-like properties in ALDH-H cells but not in ALDH-L cells. These results provide insight into the molecular basis of the ALDH1A1-mediated development of CSC-like properties such as stress/treatment resistance, and further suggest the therapeutic potential of ATRA in ALDH-high ovarian CSCs.


Conflict of interest statement

The authors declare that they have no conflict of interest.

Figures

Fig. 1
Fig. 1. A2780DR cells show elevated ALDH1A1 levels.
a Protein levels of ALDH1A1 and BCRP were determined in the parental A2780 cell line and doxorubicin-resistant A2780 cell line (A2780DR) by using western blot analysis. b ALDH1 activity was determined using the Aldefluor assay system in A2780 and A2780DR cells. ALDH1 inhibitor DEAB-treated cells were used as a negative control. Cell population with Aldefluor-derived fluorescence intensity was analyzed using flow cytometry. Similar results were obtained in 3–4 independent experiments. c Protein levels of ALDH1A1 were determined in ALDH-negative (ALDH−) and ALDH-positive (ALDH+) cell populations isolated from A2780DR. d Transcript levels for ALDH1A1 in ALDH− and ALDH+ cells using RT-PCR analysis. Values represent the mean ± standard deviation (SD) of three experiments. aP < 0.05 compared to the ALDH-L group. e ALDH enzymatic activity was assessed using the Aldefluor assay system in the established ALDH1-low A2780DR cell line (ALDH-L) and ALDH1-high A2780DR cell line (ALDH-H). Cell populations with Aldefluor-derived fluorescence intensity were analyzed using flow cytometry. Similar blots were obtained in three independent experiments (a and c)
Fig. 2
Fig. 2. ALDH-H cells display CSC-like properties.
a Transcript levels for KLF4, NANOG, OCT4, SOX2, and BCRP were assessed in ALDH-L and ALDH-H cells using RT-PCR analysis. Values represent the mean ± SD of three experiments. b Western analysis of KLF4, NANOG, BCRP, and MDR1 was carried out in ALDH-L and ALDH-H cells. Similar blots were obtained in three independent experiments. c, d Cell viability was monitored after incubation with doxorubicin (c) or paclitaxel (d) for 24 h in ALDH-L and ALDH-H cells. Values represent the mean ± SD from 8 to 10 sampled wells. aP < 0.05 compared to the vehicle-treated group. Similar results were obtained in 2–3 independent experiments. e Soft agar colony formation was assessed in ALDH-L and ALDH-H cells. Values represent the mean ± SD from three dishes. f Sphere formation capacity was assessed after 3 days of sphere culture of ALDH-L and ALDH-H cells. Number of spheres over 100-μm diameter was counted using image processing ToupView software (×100 magnification). Scale bar = 100 μm. Values represent the mean ± SD from three independent experiments. aP < 0.05 compared to the ALDH-L group (e, f)
Fig. 3
Fig. 3. NRF2 signaling is activated in ALDH-H cells.
a Protein levels of total cellular NRF2, NQO1, and AKR1C1 were determined in ALDH-L and ALDH-H cells using western blot analysis. b NQO1 and AKR1C1 transcript levels were monitored in ALDH-L and ALDH-H cells. aP < 0.05 compared to the ALDH-L group. c Cytosolic and nuclear levels of NRF2 were assessed in ALDH-L and ALDH-H cells. Lamin B and GAPDH were determined as loading controls of nuclear and cytoplasmic proteins, respectively. d NRF2 transcriptional activity was monitored in ALDH-L and ALDH-H cells by measuring ARE-driven luciferase activity. aP < 0.05 compared to the ALDH-L group. e NRF2 transcript levels were assessed in ALDH-L and ALDH-H cells. f ALDH1A1-specific siRNA (siALDH) or nonspecific control RNA (siCN) was transfected into ALDH-H cells, and protein levels of ALDH1A1, NRF2, and AKR1C1 were determined. g Protein levels of KLF4 and NANOG were determined in siCN and ALDH1A1-silenced ALDH-H cells (siALDH). h ALDH activity was determined in colon cancer HCT116 cells using Aldefluor assay system. Cell population (45.5%) with strong Aldefluor-derived fluorescence intensity was isolated from HCT116 using a flow cytometry cell sorter. i Protein levels of ALDH1A1, KLF4, BCRP, NRF2, and NQO1 were determined in ALDH-low (ALDH-L) and ALDH-high (ALDH-H) HCT116 cell populations. Similar blots were obtained in three independent experiments (a, c, f, g, and i). Values are means ± SD from three experiments (b, d, and e)
Fig. 4
Fig. 4. NRF2 activation is involved in CSC-like properties of ALDH-H cells.
a Protein levels of NRF2, NQO1, and AKR1C1 were measured in established control (sc) and NRF2-silenced ALDH-H cells (iNRF2). b ALDH1A1 protein level was assessed in sc and iNRF2 ALDH-H cells. c Protein levels of KLF4, NANOG, BCRP, and MDR1 were determined in sc and iNRF2 ALDH-H cells. Similar blots were obtained in three independent experiments (ac). d Cell viability was monitored after incubation with doxorubicin for 48 h in sc and iNRF2 ALDH-H cells. Values represent the mean ± SD from six sampled wells. aP < 0.05 compared with vehicle-treated group. ef Numbers of soft agar colony formation (e) and sphere formation (f) were quantified in sc and iNRF2 ALDH-H cells. Scale bar = 100 μm. Values represent mean ± SD from three independent dishes. aP < 0.05 compared with the sc control group
Fig. 5
Fig. 5. High p62 level is associated with NRF2 activation in ALDH-H cells.
a Protein levels of p62, LC3B, BECN1, and ATG7 were measured in ALDH-L and ALDH-H cells using western blotting. b Protein level of p62 was determined in ALDH-H cells following nonspecific RNA (siCN) or ALDH1A1-specific siRNA (siALDH) transfection. c ALDH-H cells were transfected with p62-specific siRNA (sip62) or control siRNA (siCN), and protein levels of NRF2, KEAP1, NQO1, and AKR1C1 were assessed. d Transcript levels of NQO1 and AKR1C1 were determined in siCN and sip62 ALDH-H cells using RT-PCR. Values represent mean ± SD from three experiments. aP < 0.05 compared with the siCN control group. e ALDH1A1 protein level was determined in siCN and sip62 ALDH-H cells. f Transcript level of ALDH1A1 was assessed in siCN and sip62 ALDH-H cells. Values represent the mean ± SD from three experiments. g Autophagic flux was determined in ALDH-L and ALDH-H cells. Similar results were obtained in three independent experiments. h Western blot analysis of p62, BECN1, and LC3B was carried out in siCN and sip62 ALDH-H cells. Similar blots were obtained in three independent experiments (ac, e and h)
Fig. 6
Fig. 6. ATRA treatment inhibits NRF2 activation in ALDH-H cells.
a After ATRA incubation for 24 h under the indicated concentration (0–20 μM), the protein level of ALDH1A1 was measured in ALDH-H cells. b Transcript levels of ALDH1A1 were assessed in ALDH-H cells after ATRA treatment (10 μM, 24 h). Data represent the mean ± SD from three experiments. c Protein levels of KLF4, NANOG, BCRP, and MDR1 were monitored in ATRA-treated ALDH-H cells. d Transcript levels of KLF4, NANOG, and BCRP were measured in ATRA-treated ALDH-H. Data represent the mean ± SD from three experiments. aP < 0.05 compared with vehicle-treated cells. e Protein levels of NRF2, NQO1, and AKR1C1 were determined in ATRA (5, 10, and 20 μM)-treated ALDH-H cells. f Transcript levels of NRF2, NQO1, and AKR1C1 were measured in vehicle (veh) or ATRA-treated groups in ALDH-H cells. Data represent the mean ± SD from three experiments. aP < 0.05 compared with vehicle-treated cells. g Protein level of p62 and LC3B were obtained in ATRA-treated ALDH-H cells. h ALDH1A1 levels were monitored in ATRA-treated ALDH-L cells. i Protein levels of NRF2, NQO1, AKR1C1, and p62 were measured in ATRA-treated ALDH-L cells using western blotting. All immunoblot analyses were conducted in three independent experiments and similar blots were obtained
Fig. 7
Fig. 7. ATRA treatment reduces CSC-like properties in ALDH-H cells, but not in ALDH-L cells.
a, b Cell viability after incubation with doxorubicin (Dox) for 24 h in ALDH-H (a) and ALDH-L cells (b). Values represent the mean ± SD from 8 to 10 sampled wells. aP < 0.05 compared to the doxorubicin-treated group. c Soft agar colony formation was assessed in ALDH-L and ALDH-H cells after ATRA treatment (10 μM, 24 h). Values represent the mean ± SD from three experiments. aP < 0.05 compared to vehicle-treated ALDH-L group, bP < 0.05 compared to vehicle-treated ALDH-H group. d Sphere formation capacity was assessed after 3 days of sphere culture of ALDH-L and ALDH-H cells. Number of spheres (over 100 μm diameter size) was quantified. Values represent the mean ± SD from three experiments. aP < 0.05 compared to vehicle-treated ALDH-L group, bP < 0.05 compared to vehicle-treated ALDH-H group. e Sphere (over 100 μm diameter) number was quantified in sc and iNRF2 ALDH-H cells following ATRA treatment. Values represent the mean ± SD from three experiments. aP < 0.05 compared to each vehicle-treated group. f Protein levels of NRF2, BCRP, MDR1, and NANOG were measured in sc and NRF2-silenced ALDH-H cells following ATRA treatment. Similar blot were obtained in three independent experiments
Fig. 8
Fig. 8. ATRA treatment inhibits the ALDH-H-derived tumor growth.
a ALDH-L and ALDH-H cells were implanted in nude mice and tumor volume was measured every week from 5 to 33 weeks after inoculation. When tumor size reached 100−200 mm3, mice received vehicle (veh) or ATRA (10 mg/kg) three times a week. Tumors (n = 4–5) were obtained from mouse xenografts (left) and tumor weight was measured (right). b Tumor volume assessed in ALDH-H inoculated mice (n = 4–5). Mice received vehicle (veh) or ATRA (10 mg/kg). c Tumor volume assessed in ALDH-L inoculated mice (n = 4–5). Mice received vehicle (veh) or ATRA (10 mg/kg). d Tumor volume assessed in sc and iNRF2 ALDH-H inoculated mice (n = 3). aP < 0.05 compared to each vehicle (veh)-treated group. e The p62-associated NRF2 activation contributes to CSC-like properties of ALDH1A1-high ovarian cancer cells. ATRA treatment suppresses ALDH1-mediated NRF2 activation and exhibits inhibitory effects on CSC-like properties. ATRA can directly inhibit NRF2 transcription activity as well

References

    1. Pattabiraman DR, Weinberg RA. Tackling the cancer stem cells—what challenges do they pose? Nat. Rev. Drug Discov. 2014;13:497–512. doi: 10.1038/nrd4253. - DOI - PMC - PubMed
    1. Al-Hajj M, Wicha MS, Benito-Hernandez A, Morrison SJ, Clarke MF. Prospective identification of tumorigenic breast cancer cells. Proc. Natl. Acad. Sci. USA. 2003;100:3983–3988. doi: 10.1073/pnas.0530291100. - DOI - PMC - PubMed
    1. Bonnet D, Dick JE. Human acute myeloid leukemia is organized as a hierarchy that originates from a primitive hematopoietic cell. Nat. Med. 1997;3:730–737. doi: 10.1038/nm0797-730. - DOI - PubMed
    1. Ricci-Vitiani L, et al. Identification and expansion of human colon-cancer-initiating cells. Nature. 2007;445:111–115. doi: 10.1038/nature05384. - DOI - PubMed
    1. Singh SK, et al. Identification of human brain tumour initiating cells. Nature. 2004;432:396–401. doi: 10.1038/nature03128. - DOI - PubMed

Publication types

MeSH terms