

A study paradigm integrating prospective epidemiologic cohorts and electronic health records to identify disease biomarkers
- PMID: 30166544
- PMCID: PMC6117367
- DOI: 10.1038/s41467-018-05624-4
A study paradigm integrating prospective epidemiologic cohorts and electronic health records to identify disease biomarkers
Abstract
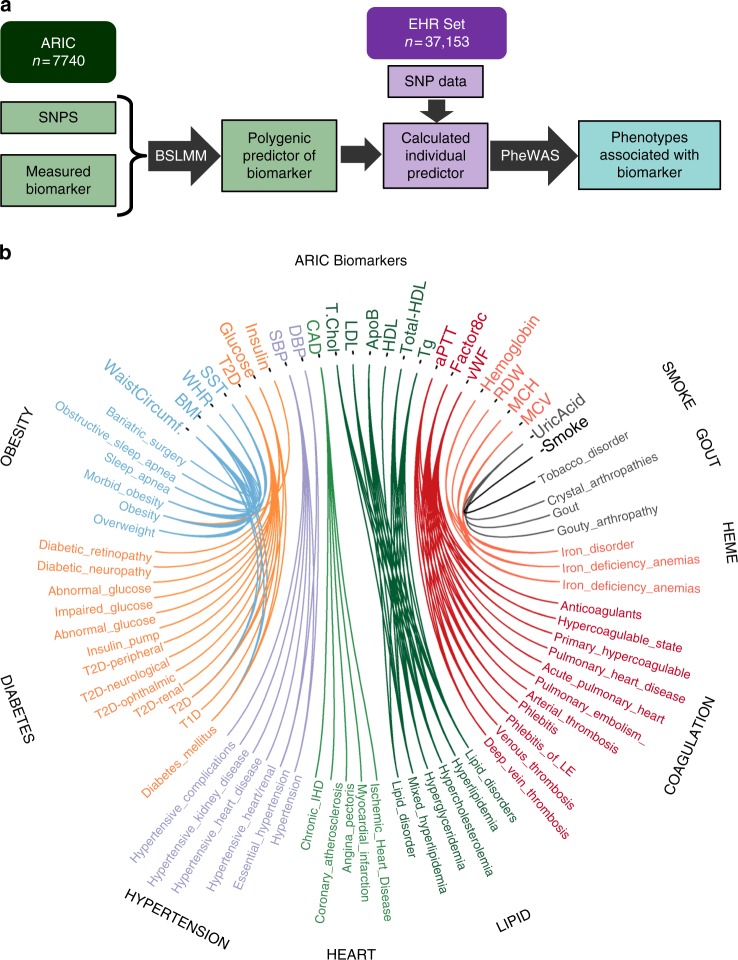
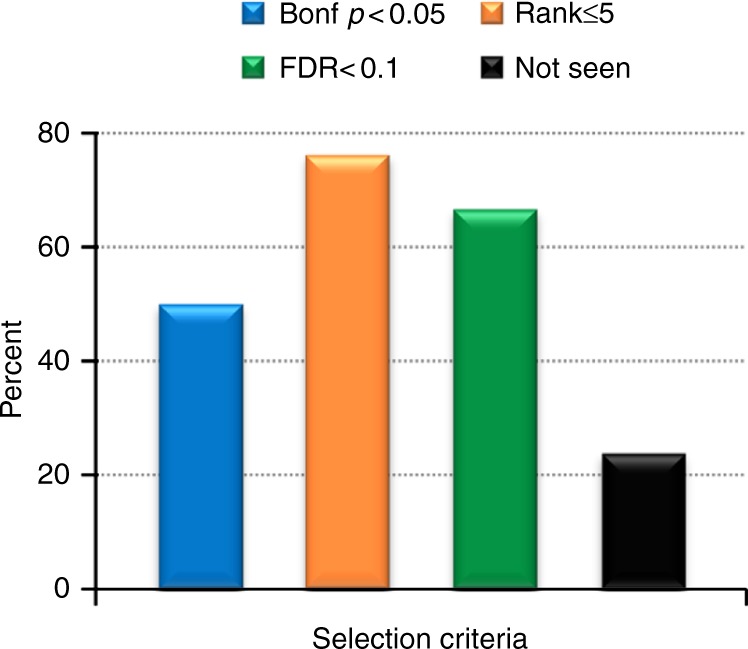
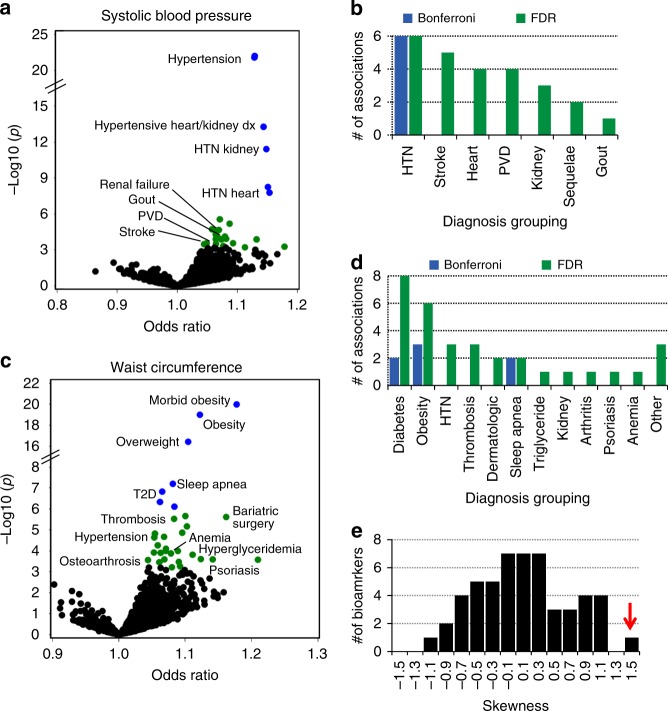
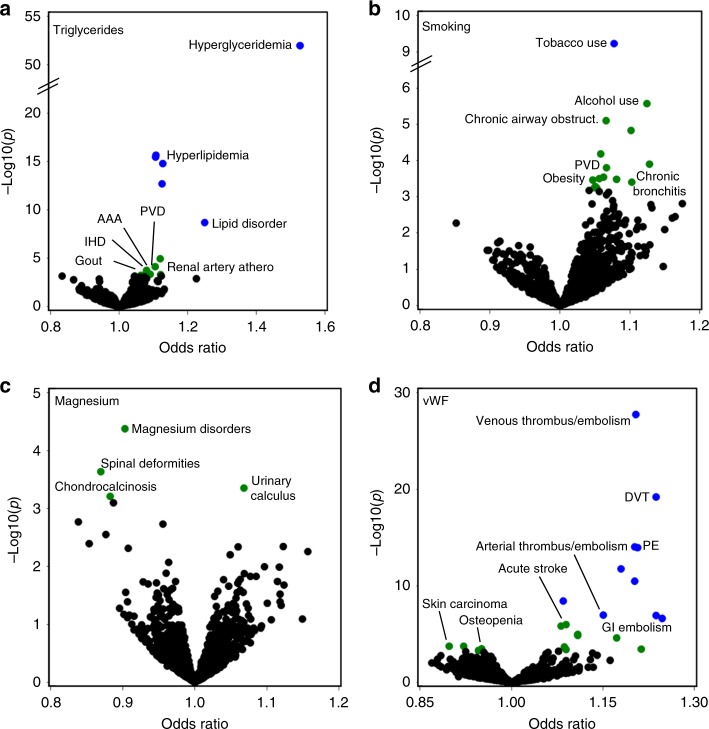
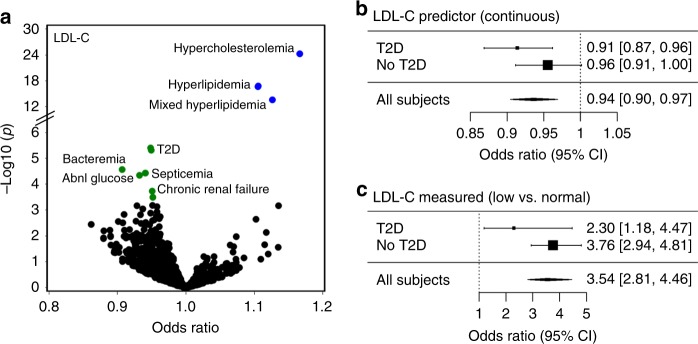
Defining the full spectrum of human disease associated with a biomarker is necessary to advance the biomarker into clinical practice. We hypothesize that associating biomarker measurements with electronic health record (EHR) populations based on shared genetic architectures would establish the clinical epidemiology of the biomarker. We use Bayesian sparse linear mixed modeling to calculate SNP weightings for 53 biomarkers from the Atherosclerosis Risk in Communities study. We use the SNP weightings to computed predicted biomarker values in an EHR population and test associations with 1139 diagnoses. Here we report 116 associations meeting a Bonferroni level of significance. A false discovery rate (FDR)-based significance threshold reveals more known and undescribed associations across a broad range of biomarkers, including biometric measures, plasma proteins and metabolites, functional assays, and behaviors. We confirm an inverse association between LDL-cholesterol level and septicemia risk in an independent epidemiological cohort. This approach efficiently discovers biomarker-disease associations.
Conflict of interest statement
The authors declare no competing interests.
Figures
Similar articles
-
Probing the Virtual Proteome to Identify Novel Disease Biomarkers.Circulation. 2018 Nov 27;138(22):2469-2481. doi: 10.1161/CIRCULATIONAHA.118.036063. Circulation. 2018. PMID: 30571344 Free PMC article.
-
INTEGRATING CLINICAL LABORATORY MEASURES AND ICD-9 CODE DIAGNOSES IN PHENOME-WIDE ASSOCIATION STUDIES.Pac Symp Biocomput. 2016;21:168-79. Pac Symp Biocomput. 2016. PMID: 26776183 Free PMC article.
-
Abdominal CT metrics in 17,646 patients reveal associations between myopenia, myosteatosis, and medical phenotypes: a phenome-wide association study.EBioMedicine. 2024 May;103:105116. doi: 10.1016/j.ebiom.2024.105116. Epub 2024 Apr 17. EBioMedicine. 2024. PMID: 38636199 Free PMC article.
-
Folic acid supplementation and malaria susceptibility and severity among people taking antifolate antimalarial drugs in endemic areas.Cochrane Database Syst Rev. 2022 Feb 1;2(2022):CD014217. doi: 10.1002/14651858.CD014217. Cochrane Database Syst Rev. 2022. PMID: 36321557 Free PMC article.
-
Bayesian statistical methods in genetic association studies: Empirical examination of statistically non-significant Genome Wide Association Study (GWAS) meta-analyses in cancers: A systematic review.Gene. 2019 Feb 15;685:170-178. doi: 10.1016/j.gene.2018.10.057. Epub 2018 Oct 26. Gene. 2019. PMID: 30416053
Cited by
-
Development and Evaluation of a Peptide Heterodimeric Tracer Targeting CXCR4 and Integrin αvβ3 for Pancreatic Cancer Imaging.Pharmaceutics. 2022 Aug 26;14(9):1791. doi: 10.3390/pharmaceutics14091791. Pharmaceutics. 2022. PMID: 36145541 Free PMC article.
-
Diagnostic and prognostic value of serum S100B in sepsis-associated encephalopathy: A systematic review and meta-analysis.Front Immunol. 2023 Jan 27;14:1102126. doi: 10.3389/fimmu.2023.1102126. eCollection 2023. Front Immunol. 2023. PMID: 36776893 Free PMC article.
-
Generalizability of Polygenic Risk Scores for Breast Cancer Among Women With European, African, and Latinx Ancestry.JAMA Netw Open. 2021 Aug 2;4(8):e2119084. doi: 10.1001/jamanetworkopen.2021.19084. JAMA Netw Open. 2021. PMID: 34347061 Free PMC article.
-
Personizing the prediction of future susceptibility to a specific disease.PLoS One. 2021 Jan 6;16(1):e0243127. doi: 10.1371/journal.pone.0243127. eCollection 2021. PLoS One. 2021. PMID: 33406077 Free PMC article.
-
Knowledgebase strategies to aid interpretation of clinical correlation research.J Am Med Inform Assoc. 2023 Jun 20;30(7):1257-1265. doi: 10.1093/jamia/ocad078. J Am Med Inform Assoc. 2023. PMID: 37164621 Free PMC article.
References
Publication types
MeSH terms
Substances
Grants and funding
- HHSN268201100010C/HL/NHLBI NIH HHS/United States
- HHSN268201100008C/HL/NHLBI NIH HHS/United States
- U01 HG006389/HG/NHGRI NIH HHS/United States
- HHSN268201100006C/HL/NHLBI NIH HHS/United States
- P50 GM115305/GM/NIGMS NIH HHS/United States
- U01 HG006379/HG/NHGRI NIH HHS/United States
- 15MCPRP25620006/American Heart Association (American Heart Association, Inc.)/International
- U01 HG006830/HG/NHGRI NIH HHS/United States
- HHSN268201100012C/HL/NHLBI NIH HHS/United States
- U01 HG006385/HG/NHGRI NIH HHS/United States
- HHSN268201100009I/HL/NHLBI NIH HHS/United States
- UL1 TR000445/TR/NCATS NIH HHS/United States
- U01 HG006375/HG/NHGRI NIH HHS/United States
- U01 HG004438/HG/NHGRI NIH HHS/United States
- HHSN268201100005G/HL/NHLBI NIH HHS/United States
- R01 GM120523/GM/NIGMS NIH HHS/United States
- HHSN268201100008I/HL/NHLBI NIH HHS/United States
- T32 GM007569/GM/NIGMS NIH HHS/United States
- U01 HG008657/HG/NHGRI NIH HHS/United States
- HHSN268201100007C/HL/NHLBI NIH HHS/United States
- U01 HG006382/HG/NHGRI NIH HHS/United States
- U19 HL065962/HL/NHLBI NIH HHS/United States
- R01 LM010685/LM/NLM NIH HHS/United States
- HHSN268201100011I/HL/NHLBI NIH HHS/United States
- HHSN268201100011C/HL/NHLBI NIH HHS/United States
- S10 RR025141/RR/NCRR NIH HHS/United States
- U01 HG004402/HG/NHGRI NIH HHS/United States
- U01 HG004424/HG/NHGRI NIH HHS/United States
- U01 HG008672/HG/NHGRI NIH HHS/United States
- 16FTF30130005/AHA/American Heart Association-American Stroke Association/United States
- HHSN268201100005I/HL/NHLBI NIH HHS/United States
- U01 HG006380/HG/NHGRI NIH HHS/United States
- R01 HL133786/HL/NHLBI NIH HHS/United States
- R01 HD074711/HD/NICHD NIH HHS/United States
- KL2 TR000446/TR/NCATS NIH HHS/United States
- RC2 GM092618/GM/NIGMS NIH HHS/United States
- U01 HG006388/HG/NHGRI NIH HHS/United States
- U01 HG006378/HG/NHGRI NIH HHS/United States
- HHSN268201100009C/HL/NHLBI NIH HHS/United States
- HHSN268201100005C/HL/NHLBI NIH HHS/United States
- HHSN268201100007I/HL/NHLBI NIH HHS/United States
- UL1 RR024975/RR/NCRR NIH HHS/United States
- R01 NS032830/NS/NINDS NIH HHS/United States
- U01 HG004798/HG/NHGRI NIH HHS/United States
- UL1 TR002243/TR/NCATS NIH HHS/United States
- U01 HG008685/HG/NHGRI NIH HHS/United States
LinkOut - more resources
Full Text Sources
Other Literature Sources
