. 2018 Aug 30;9(1):3521.
doi: 10.1038/s41467-018-05882-2.

Pulsatile inputs achieve tunable attenuation of gene expression variability and graded multi-gene regulation

Affiliations

Pulsatile inputs achieve tunable attenuation of gene expression variability and graded multi-gene regulation

Dirk Benzinger et al. Nat Commun. .

Abstract

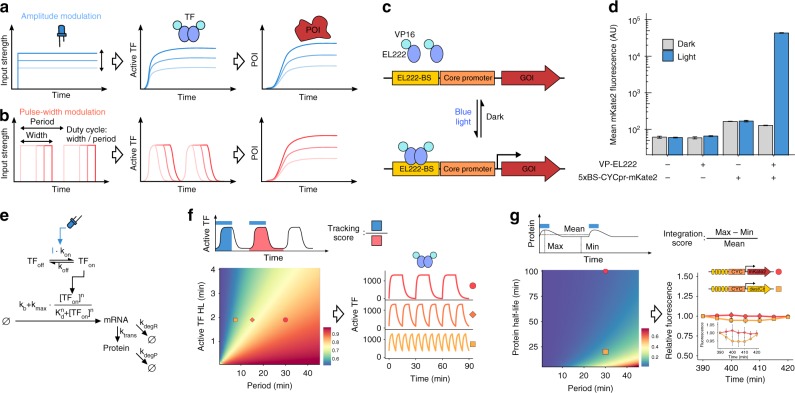
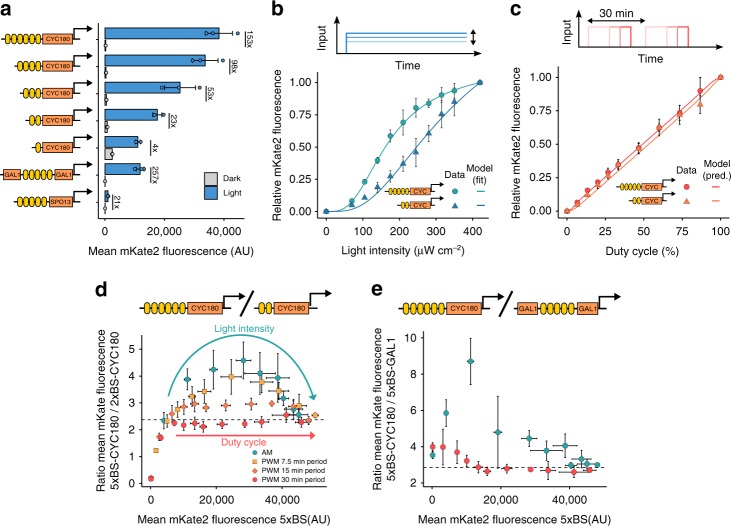
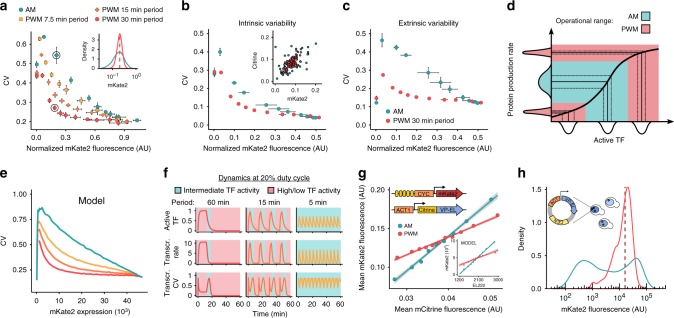
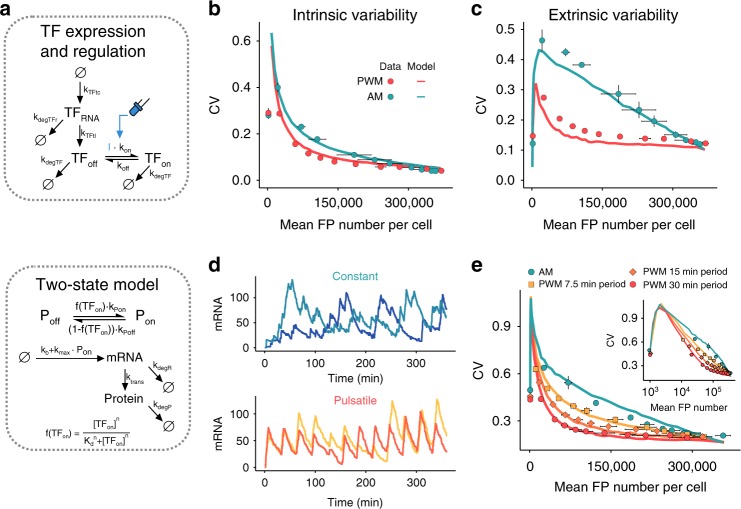
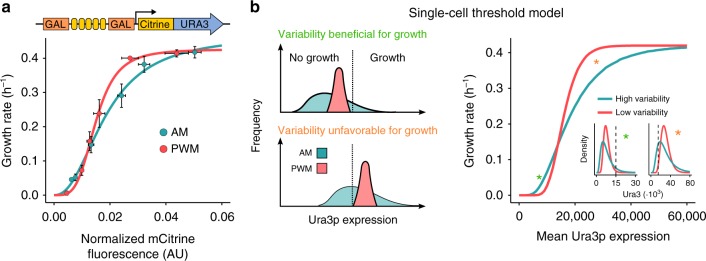
Many natural transcription factors are regulated in a pulsatile fashion, but it remains unknown whether synthetic gene expression systems can benefit from such dynamic regulation. Here we find, using a fast-acting, optogenetic transcription factor in Saccharomyces cerevisiae, that dynamic pulsatile signals reduce cell-to-cell variability in gene expression. We then show that by encoding such signals into a single input, expression mean and variability can be independently tuned. Further, we construct a light-responsive promoter library and demonstrate how pulsatile signaling also enables graded multi-gene regulation at fixed expression ratios, despite differences in promoter dose-response characteristics. Pulsatile regulation can thus lead to beneficial functional behaviors in synthetic biological systems, which previously required laborious optimization of genetic parts or the construction of synthetic gene networks.


Conflict of interest statement

The authors declare no competing interests.

Figures

Fig. 1
Fig. 1
Characterization of an EL222-based optogenetic gene expression system in S. cerevisiae. a and b Schematic of gene expression regulation by AM (a) and PWM (b). Input signals (left) lead to TF activation (middle) and expression of a protein of interest (POI, right). c Illustration of the optogenetic gene expression system. Blue-light triggers VP-EL222 dimerization and transcription of a gene of interest (GOI). d Effect of blue-light illumination on VP-EL222 mediated gene expression. Strains, with or without the VP-EL222 and a reporter construct (5xBS-CYC180pr-mKate2), were grown either in the dark or under illumination (460 nm, 350 µW cm−2) for 6 h. Data represent mean and s.d. of three independent experiments. e Graphical representation of the model describing VP-EL222 mediated gene expression. I represents the light input. See Methods and Supplementary Note 1 for details. f Model-based analysis of pulsatile TF behavior. To quantify the temporal TF response, we use a tracking score defined by the ratio between the integrated TF activity during the light pulse and the whole period (top, Supplementary Note 2). This metric is 1 if the TF activity perfectly tracks the input, and equals the duty cycle if TF activity does not change over time. The heatmap depicts the tracking score as a function of the PWM period and the half-life (HL) of the active VP-EL222 state (50% duty cycle, 420 µW cm−2). On the right, predicted temporal TF activities are shown for PWM conditions marked on the heatmap after an initial settling period (see Supplementary Note 2). g Model-based analysis of PWM-mediated protein expression. The heatmap depicts the integration score (top), quantifying temporal variations of protein levels (Supplementary Note 2), as a function of the PWM period and protein half-life (10% duty cycle). On the right, the measured time course of FP expression in response to PWM with a 30 min period are shown after 390 min of induction at 10% duty cycle. Experiments were performed using mKate2 (red) and a destabilized mCitrine variant, (yellow). Fluorescence is normalized by the value measured after 390 min. Inset differs in y-axis scaling. Data represent the mean and s.d. of two independent experiments
Fig. 2
Fig. 2
Coordinated multi-gene regulation using dynamic inputs. a A promoter library for gene expression at various expression levels. Schematics represent the different promoters. Yellow boxes represent EL222 binding sites and orange boxes represent partial sequences of yeast promoters. Strains, expressing mKate2 under the control of the respective promoter, were cultured for 6 h in the dark or the presence of blue light (350 µW cm−2). The average cellular mKate2 fluorescence was measured using flow cytometry. Data represent the mean and s.d. of three independent experiments. b and c Dose-response of two promoters to AM (b) and PWM (c). Strains expressing mKate2 under the control of either a CYC180 promoter with five (circle, 5xBS) or two (triangle, 2xBS) VP-EL222 binding sites were grown under the illumination conditions depicted on the x-axis for 6 h. The light intensity and period for PWM were 420 µW cm−2 and 30 min. Mean cellular fluorescence measurements were normalized to be 0 in the dark and 1 at the highest input level to allow for easy comparison. Non-normalized values are shown in Supplementary Fig. 7. Data represent the mean and s.d. of three independent experiments. Lines represent model fits or predictions. d Relative gene expression levels for different induction condition. Strains (as in b and c) were grown under the same illumination conditions (light intensity and duty cycle) as shown in b and c. In addition, the effect of the PWM period on coordinated expression was explored. The ratio of mKate2 expression from the 5xBS and the 2xBS promoter is plotted against the mKate2 expression from the 5xBS promoter for the same illumination conditions. The dashed line represents this ratio at constant illumination with a light intensity of 420 µW cm−2. Data represent the mean and s.d. of three independent experiments. e Relative gene expression levels between a CYC180 and GAL1 based promoter with five binding sites for different induction condition. Experiments were performed as described in (d). Data represent the mean and s.d. of three independent experiments for the CYC180-based promoter and two independent experiments for the GAL1-based promoter
Fig. 3
Fig. 3
Effects of PWM and AM on gene expression variability. a Cell-to-cell variability, measured by the coefficient of variation (CV), as function of mean expression levels. Fluorescence was normalized by side-scatter measurements (Methods). Cells containing 5xBS-CYC180pr-mKate2 were induced for 6 h. Illumination conditions are identical to those in Fig. 2d. Data represent mean and s.d. of three independent experiments. The inset shows fluorescence distributions for the circled data points. b and c Contributions of intrinsic (b) and extrinsic (c) variability. Experiments were performed using a dual-color reporter strain (Methods), under the same conditions as in (a). Data represent mean and s.d. of three independent experiments. The inset shows data of 60 cells for conditions with similar mean for AM (105 µW cm−2) and PWM (13% duty cycle). d Schematic illustration of variability transmission from TF concentration to gene expression. Distributions represent cell-to-cell variability. Assuming identical input–output relationships between cells, expression variability increases with the steepness of the input–output function. e CV as function of mean expression obtained using the 5xBS-CYC180pr model, including VP-EL222 variability. Induction regimes (line color) are as in (a). f Differences in TF dynamics affect transcriptional variability. Using the model, we analyzed how the PWM period effects temporal changes of active TF concentration (top, relative to maximal activity), transcription rate (middle, in mRNA min−1), and transcription variability (bottom). Red shading represents intervals of high or low (>90% or <10% of maximum value) TF activity and blue shading represent intervals of intermediate TF activity. g Dependence of gene expression output on mCitrine-VP-EL222 levels. Fluorescence was analyzed after 1 h of induction. Cells were collected in 10 bins of equal cell number based on their normalized mCitrine fluorescence. Data points represent the mean normalized mKate2 and mCitrine fluorescence of cells from each bin. Lines represent linear regressions. Induction conditions: AM = 70 µW cm−2, PWM = 350 µW cm−2; 30 min period; 26.7% duty cycle. Inset: Model results for equivalent conditions. h Effect of AM (blue) and PWM (red) on fluorescence distributions with VP-EL222 expressed from a centromeric plasmid. Induction conditions: AM = 105 µW cm−2, PWM = 420 µW cm−2; 45 min period; 26.7% duty cycle. CV-mean relationship is shown in Supplementary Fig. 12b
Fig. 4
Fig. 4
A stochastic model of VP-EL222 mediated gene expression. a Graphical representation of the stochastic model describing VP-EL222/TF expression and activation (top) and VP-EL222/TF mediated reporter gene expression (bottom). The light input is denoted by I. Arrows depict reactions. Details on the modeling approach can be found in Supplementary Note 4. b and c Modeling results (lines) and experimental data (circles) showing intrinsic (b) and extrinsic (c) contributions to gene expression variability (see Supplementary Table 6 for model parameters). A dual-color reporter experiment was simulated for 6 h and the variability decomposition procedure was applied to the simulated data as described in Methods section for the experimental data. Experimental results are the same as shown in Fig. 3b, c. d Intrinsic mRNA expression dynamics under constant (top, simulated intensity of 140 µW cm−2) and pulsatile regulation (bottom, simulated PWM period of 30 min with 20% duty cycle and 420 µW cm−2 light intensity). Simulations were performed without the incorporation of extrinsic variability, meaning with fixed levels of VP-EL222 expression (24,600 proteins per cell). Two single-cell traces are shown per condition. e Model predictions for the single 5xBS-CYC180pr reporter strain under different AM and PWM conditions. Data are the same as shown in Fig. 3a (see Supplementary Table 6 for model parameters)
Fig. 5
Fig. 5
Effect of regulating URA3 expression levels by AM and PWM on cell growth. a Cells expressing mCitrine-tagged Ura3p from the 5xBS-GAL1pr were grown under AM (blue) and PWM (red) light induction for 14 h in media with uracil before transfer to uracil-free media, fluorescence, and growth measurements. PWM was performed with a 30 min period and 420 µW cm−2 light intensity. Growth was measured for 5 h. Hill functions were fit to the data for comparison and guidance (see Supplementary Fig. 14f and Supplementary Table 7 for parameters). The effect of AM and PWM on the CV is shown in Supplementary Fig. 14c. Data represent the mean and s.e.m of three independent experiments. Data of all individual experiments are shown in Supplementary Fig. 14d, e. b The experimental data are consistent with an all-or-none growth response to Ura3p expression on the single-cell level (threshold model). A schematic representation illustrating how cell-to-cell variability combined with a threshold expression level required for growth (dashed line) may affect cellular growth for two different expression levels is shown on the left. For low mean expression levels, expression variability enables growth of a small subpopulation. In contrast, for high expression levels, cell-to-cell variability may lead to a subpopulation that is unable to grow and a subpopulation with unnecessarily high expression levels. The expected relation between mean expression levels and growth rate for the threshold model is shown on the right. Growth rates were calculated by computing the fraction of log-normal distributions with values higher than a threshold level (15,000) and multiplying the resulting fraction by the maximal growth rate of 0.42 h−1. The CV of the log-normal distributions used was 0.6 for the high variability curve (blue) and 0.3 for the low variability curve (red). The insets show the distributions for mean expression levels marked by asterisks in the main figure together with the growth threshold value (dashed line)

References

    1. Nevoigt E. Progress in metabolic engineering of Saccharomyces cerevisiae. Microbiol. Mol. Biol. Rev. 2008;72:379–412. doi: 10.1128/MMBR.00025-07. - DOI - PMC - PubMed
    1. Kennedy MJ, et al. Rapid blue-light-mediated induction of protein interactions in living cells. Nat. Methods. 2010;7:973–975. doi: 10.1038/nmeth.1524. - DOI - PMC - PubMed
    1. Davidson EA, Basu AS, Bayer TS. Programming microbes using pulse width modulation of optical signals. J. Mol. Biol. 2013;425:4161–4166. doi: 10.1016/j.jmb.2013.07.036. - DOI - PubMed
    1. Motta-Mena LB, et al. An optogenetic gene expression system with rapid activation and deactivation kinetics. Nat. Chem. Biol. 2014;10:196–202. doi: 10.1038/nchembio.1430. - DOI - PMC - PubMed
    1. Levine JH, Lin Y, Elowitz MB. Functional roles of pulsing in genetic circuits. Science. 2013;342:1193–1200. doi: 10.1126/science.1239999. - DOI - PMC - PubMed

Publication types

MeSH terms