. 2017 Nov 17;6(11):e17086.
doi: 10.1038/lsa.2017.86. eCollection 2017 Nov.

Stable femtosecond X-rays with tunable polarization from a laser-driven accelerator

Affiliations

Stable femtosecond X-rays with tunable polarization from a laser-driven accelerator

Andreas Döpp et al. Light Sci Appl. .

Abstract

Technology based on high-peak-power lasers has the potential to provide compact and intense radiation sources for a wide range of innovative applications. In particular, electrons that are accelerated in the wakefield of an intense laser pulse oscillate around the propagation axis and emit X-rays. This betatron source, which essentially reproduces the principle of a synchrotron at the millimeter scale, provides bright radiation with femtosecond duration and high spatial coherence. However, despite its unique features, the usability of the betatron source has been constrained by its poor control and stability. In this article, we demonstrate the reliable production of X-ray beams with tunable polarization. Using ionization-induced injection in a gas mixture, the orbits of the relativistic electrons emitting the radiation are reproducible and controlled. We observe that both the signal and beam profile fluctuations are significantly reduced and that the beam pointing varies by less than a tenth of the beam divergence. The polarization ratio reaches 80%, and the polarization axis can easily be rotated. We anticipate a broad impact of the source, as its unprecedented performance opens the way for new applications.

Keywords: laser-plasma interaction; laser-wakefield acceleration; synchrotron light sources.


Conflict of interest statement

The authors declare no conflict of interest.

Figures

Figure 1
Figure 1
Comparison of betatron oscillations in the transverse self-injection regime and the ionization-injection regime. (a, c) Schematic illustrations of the two injection mechanisms. In both cases, an intense femtosecond laser pulse, propagating in an underdense plasma, creates an ion cavity in its wake. For transverse self-injection a, electrons that get accelerated have to travel along the cavity sheath and enter the cavity at the back. Using Particle-in-cell simulations, it is found that these electrons originate from a ring-shaped region around the laser axis (b). In contrast, in the case of ionization-induced injection c, electrons are ionized inside the cavity, close to the maximum intensity of the laser. Injection can therefore occur longitudinally, and the initial position of trapped electrons is very different (d).
Figure 2
Figure 2
X-ray profiles for different gas compositions. (a) Angular profile of the X-ray beam for four consecutive shots in pure helium and in the gas mixture (He+1% N2). The color scale is the same for all images. (b) Integrated signal with the same area as in a for 50 consecutive shots in the mixed gas. Each green dot represents the centroid position for a single shot of the series. The standard deviation is 1 mrad, which corresponds to ~10% of the beam FWHM divergence. The FWHM divergences are 33 and 12 mrad along the two axes of the ellipse.
Figure 3
Figure 3
Spectral measurements: (a) typical spectrum, measured via single photon counting in the mixed gas. The data are fitted using a synchrotron function. (b) Critical energy for consecutive shots. Each circle represents the critical energy for one shot in pure helium, while crosses denote the mixed gas. Dashed lines show the average energy for helium (red) and the mixed gas (blue). The shaded area around these lines represents the standard deviation.
Figure 4
Figure 4
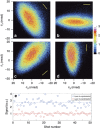
Laser polarization dependence: (ad) show the experimental betatron X-ray beam profiles obtained for four orientations of the laser polarization. The yellow line indicates the laser polarization axis. The red line in the figure represents the FWHM contour of the beam profile obtained from the test particle simulation. (e) X-ray signal reflected from an ADP (101) crystal for s- and p-polarization of the laser driver. Circles represent single shots, while the dashed lines represent the average signal for s-polarization (blue) and p-polarization (red).
Figure 5
Figure 5
Simulation of the effect of a small laser energy change on the electron beam profile. (a, b) show the electron distribution after acceleration in pure helium; (c, d) show that in a mixture of 99% helium and 1% nitrogen. Left figures are for a0=2.0; right figures are for a0=1.95. A slight variation of laser intensity drastically changes the electron beam profile for transverse injection, while it remains unchanged for ionization injection. The laser is linearly polarized along the y axis (yellow line).

References

    1. Rousse A, Rischel C, Gauthier JC. Femtosecond X-ray crystallography. Rev Mod Phys 2001; 73: 17–31.
    1. McNeil BWJ, Thompson NR. X-ray free-electron lasers. Nat Photonics 2010; 4: 814–821.
    1. Rousse A, Ta Phuoc K, Shah R, Pukhov A, Lefebvre E et al. Production of a keV X-ray beam from synchrotron radiation in relativistic laser-plasma interaction. Phys Rev Lett 2004; 93: 135005. - PubMed
    1. Corde S, Ta Phuoc K, Lambert G, Fitour R, Malka V et al. Femtosecond x rays from laser-plasma accelerators. Rev Mod Phys 2013; 85: 1–48.
    1. Kneip S, McGuffey C, Martins JL, Martins SF, Bellei C et al. Bright spatially coherent synchrotron X-rays from a table-top source. Nat Phys 2010; 6: 980–983.

LinkOut - more resources