. 2017 Mar 10;6(3):e16226.
doi: 10.1038/lsa.2016.226. eCollection 2017 Mar.

Optical fiber meta-tips

Affiliations

Optical fiber meta-tips

Maria Principe et al. Light Sci Appl. .

Abstract

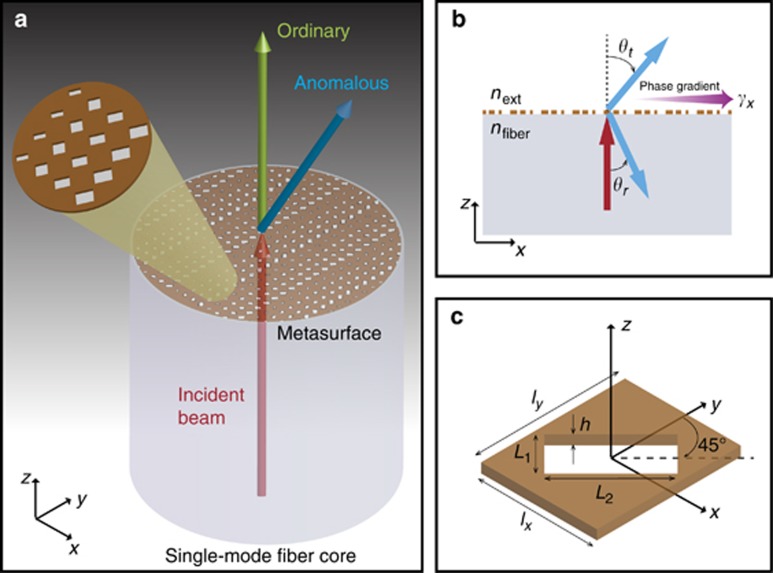
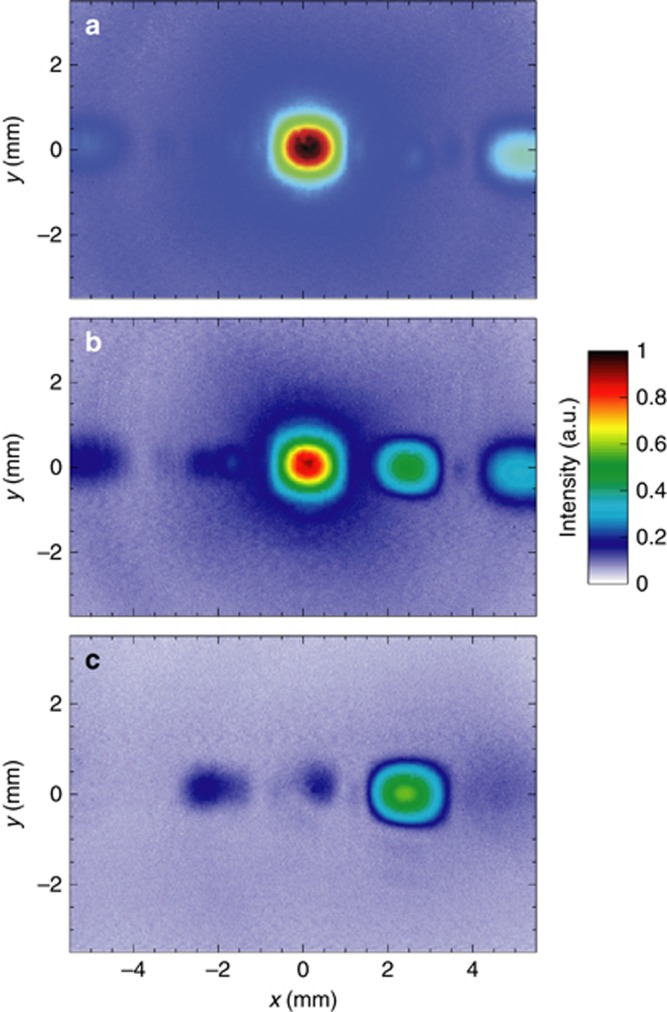
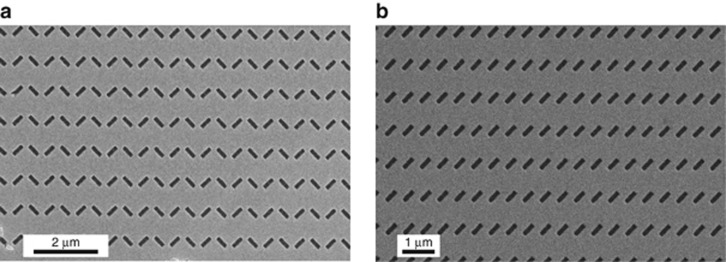
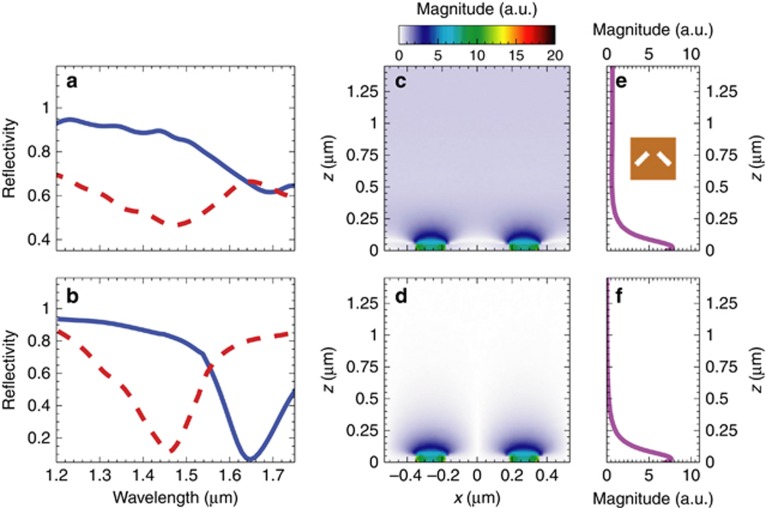
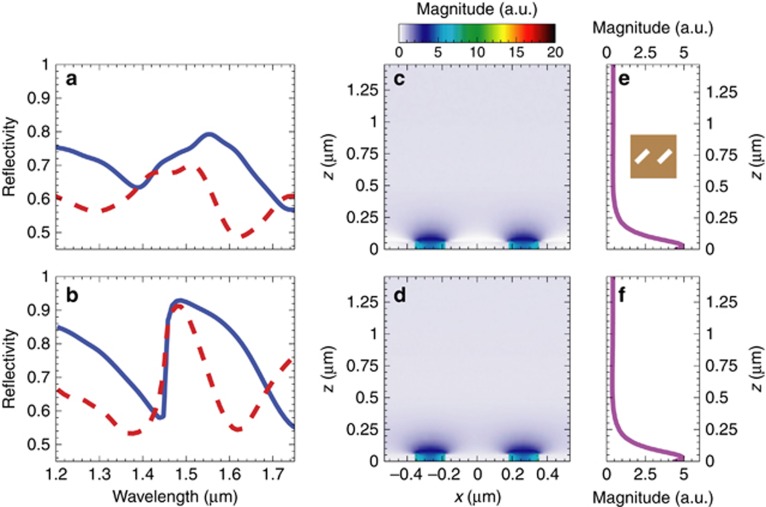
We report on the first demonstration of a proof-of-principle optical fiber 'meta-tip', which integrates a phase-gradient plasmonic metasurface on the fiber tip. For illustration and validation purposes, we present numerical and experimental results pertaining to various prototypes implementing generalized forms of the Snell's transmission/reflection laws at near-infrared wavelengths. In particular, we demonstrate several examples of beam steering and coupling with surface waves, in fairly good agreement with theory. Our results constitute a first step toward the integration of unprecedented (metasurface-enabled) light-manipulation capabilities in optical-fiber technology. By further enriching the emergent 'lab-on-fiber' framework, this may pave the way for the widespread diffusion of optical metasurfaces in real-world applications to communications, signal processing, imaging and sensing.

Keywords: Fiber optics; metasurfaces; plasmonics; wavefront manipulation.


Conflict of interest statement

The authors declare no conflict of interest.

Figures

Figure 1
Figure 1
Illustration of the idea and geometry. (a) Pictorial sketch (not in scale) of an optical-fiber MT. A plasmonic metasurface (with details magnified in the inset) is laid on the tip of an optical fiber, covering the entire core region. The metasurface impresses a linear-phase profile (constant gradient, along the x-direction) in the wavefront of a given component of an impinging beam. This yields splitting in the transmitted beam, with an ordinary (co-polarized) component propagating along the incidence direction, and an anomalous component (with generally different polarization) undergoing a phase-gradient-induced steering of an angle. A similar phenomenon (not shown for better visibility) occurs in reflection as well. (b) Illustration of the generalized Snell's refraction/reflection laws in Equation (1). (c) Geometry (not in scale) of the unit cell: a rectangular nanohole (rotated of 45° in the xy plane) milled in a gold layer.
Figure 2
Figure 2
Results from the design procedure (MT1 and MT3). (a, b) Numerically-synthesized phase and magnitude distributions, respectively, of the transmission coefficient pertaining to the single nanoholes in the supercell (shown on top) of the MT1 design (with parameters as given in Table 1), for the co-polarized (blue square markers) and cross-polarized (red circle markers) components, assuming an infinite periodic array of period lx = ly = 1 μm, under normally-incident x-polarized plane-wave illumination at λ = 1.56 μm. Element #1 is chosen as phase reference. Continuous curves are guides to the eye only. (c, d) Same as above, but for MT3 design.
Figure 3
Figure 3
Example of a fabricated sample. (a) SEM image of the MT3 sample, displaying the entire fiber cross-section. (b, c) Two magnified details, showing the entire metasurface and two unit cells, respectively.
Figure 4
Figure 4
Far-field characterization (MT1 and MT3) without polarization control. (a) Simulated electric field-intensity profiles (at z = 8 mm and y=0) of the ordinary and anomalous beams (blue and red curves, respectively), for MT1 sample (with parameters as given in Table 1). Results are obtained by averaging the co-polar and cross-polar responses, respectively, under normally-incident x- and y-polarized illuminations at λ = 1.56 μm. (b) Measured field-intensity map at z = 8 mm. (c) Transverse cuts at y = 0 comparing the measured (black-solid curve) and simulated (magenta-dashed curve) results. Numerical results are obtained by averaging the total electric-field intensities for normally-incident x- and y-polarized illuminations. The structure is considered as infinitely-periodic along y, whereas, along the x-direction, a finite-size ∼20 μm is assumed, together with a Gaussian-beam taper (with waist size of 5μm) in the illumination. (df) Same as above, but for MT3 sample.
Figure 5
Figure 5
Far-field characterization (MT3) with polarization control. (ac) Measured field-intensity maps at z = 5.9 mm for MT3 sample (with parameters as given in Table 1) pertaining to the y-, oblique (45°) and x-polarized components, respectively, and assuming a y-polarized incident field (see also Supplementary Movie 1 for a finer sampling of the selected transmitted polarization).
Figure 6
Figure 6
Examples of fabricated samples. (a, b) SEM images (magnified details) of the MT5 and benchmark (phase-gradient-free) samples, respectively.
Figure 7
Figure 7
Perspectives in sensing applications (MT5). (a, b) Measured and simulated, respectively, reflectivity spectra in the absence (red-dashed curves) and presence (blue-solid curves) of a 40 nm overlay of SiOx. (c, d) Simulated electric-field magnitude map over a supercell (at y=0, nearby the MT) for the co-polarized and cross-polarized component, respectively, at λ = 1.46 μm, assuming a normally-incident x-polarized plane-wave illumination. (e, f) Corresponding longitudinal cuts at x = 0.265 μm. The inset shows the MT5 supercell (with parameters as given in Table 1). Fields are normalized with respect to the incident-field amplitude.
Figure 8
Figure 8
Perspectives in sensing applications (benchmark MT). (a, b) Measured and simulated, respectively, reflectivity spectra in the absence (red-dashed curves) and presence (blue-solid curves) of a 40-nm-thick overlay of SiOx. (c, d) Simulated electric-field magnitude map over a supercell (at y=0, nearby the MT) for the co-polarized and cross-polarized component, respectively, at λ = 1.62 μm, assuming a normally-incident x-polarized plane-wave illumination. (e, f) Corresponding longitudinal cuts at x = 0.265 μm. The inset shows the benchmark supercell. Fields are normalized with respect to the incident-field amplitude.
Figure 9
Figure 9
Resonant field distributions (MT5 and benchmark). (a, b) Simulated electric-field magnitude maps over a supercell at the MT interface z = 50nm, for the MT5 (at λ = 1.46 μm) and benchmark (at λ = 1.62 μm) configurations, respectively, assuming a normally-incident x-polarized plane-wave illumination. (c, d) Corresponding transverse cuts at y=0. Fields are normalized with respect to the incident-field amplitude.

References

    1. Capolino F. Theory and Phenomena of Metamaterials. Boca Raton, FL, USA: CRC Press; 2009.
    1. Smith DR, Padilla WJ, Vier DC, Nemat-Nasser SC, Schultz S. Composite medium with simultaneously negative permeability and permittivity. Phys Rev Lett 2000; 84: 4184–4187. - PubMed
    1. Pendry JB. Negative refraction makes a perfect lens. Phys Rev Lett 2000; 85: 3966–3969. - PubMed
    1. Pendry JB, Schurig D, Smith DR. Controlling electromagnetic fields. Science 2006; 312: 1780–1782. - PubMed
    1. Valentine J, Zhang S, Zentgraf T, Ulin-Avila E, Genov DA et al. Three-dimensional optical metamaterial with a negative refractive index. Nature 2008; 455: 376–379. - PubMed