. 2017 May 5;6(5):e16231.
doi: 10.1038/lsa.2016.231. eCollection 2017 May.

Red light at intensities above 10 lx alters sleep-wake behavior in mice

Affiliations

Red light at intensities above 10 lx alters sleep-wake behavior in mice

Ze Zhang et al. Light Sci Appl. .

Abstract

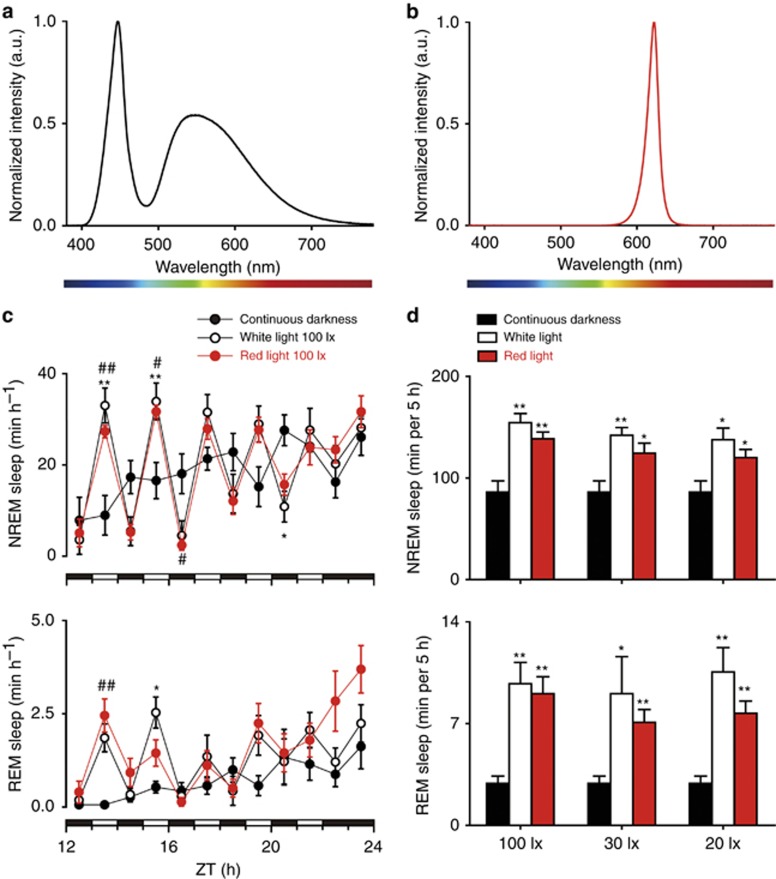
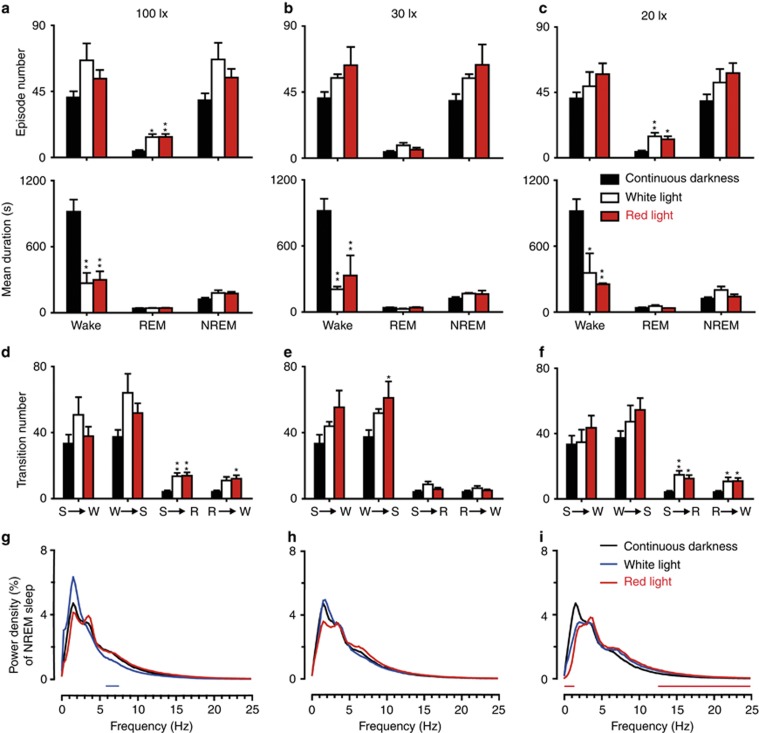
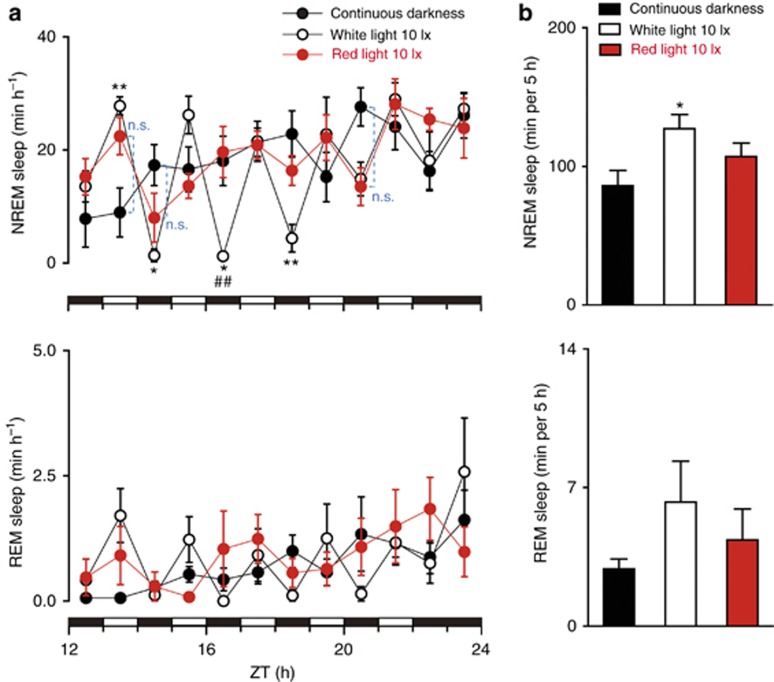
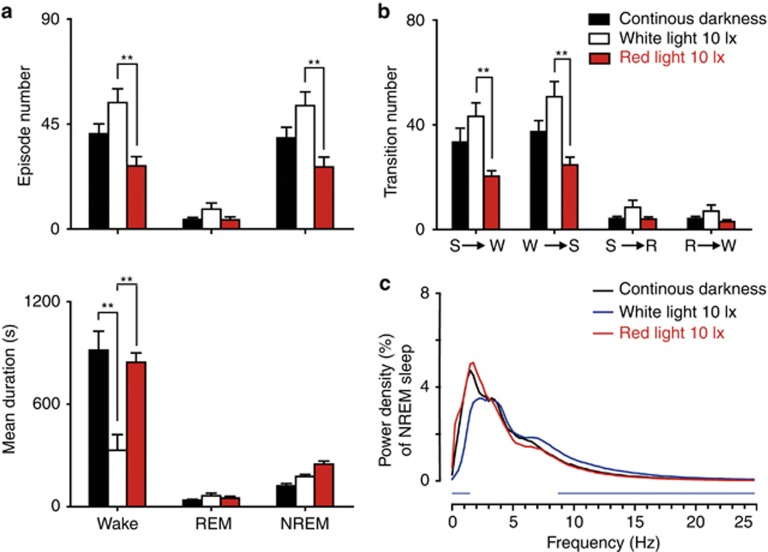
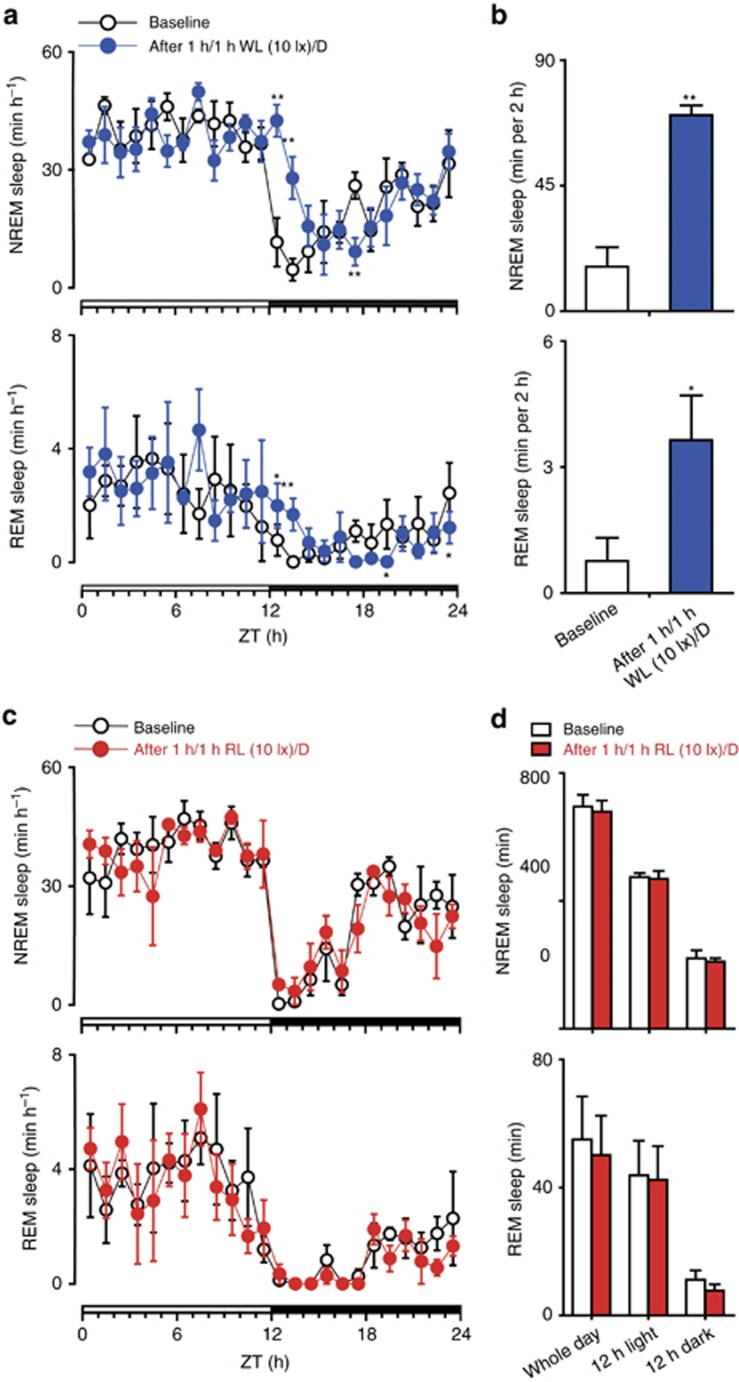
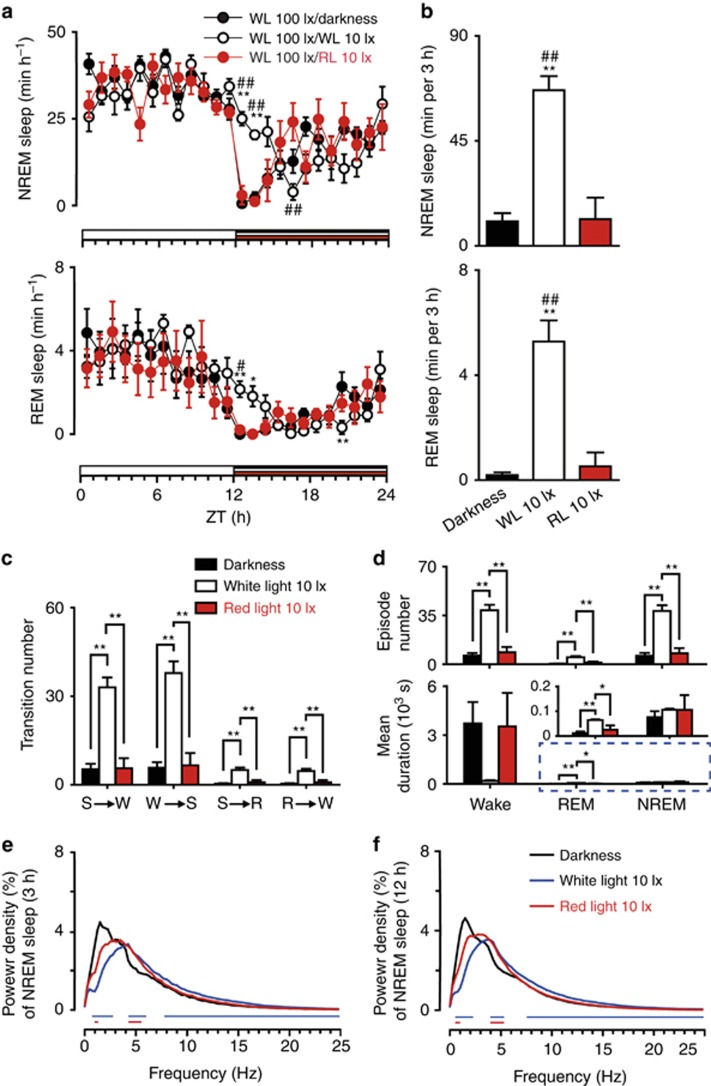
Sleep is regulated by two mechanisms: the homeostatic process and the circadian clock. Light affects sleep and alertness by entraining the circadian clock, and acutely inducing sleep/alertness, in a manner mediated by intrinsically photosensitive retinal ganglion cells. Because intrinsically photosensitive retinal ganglion cells are believed to be minimally sensitive to red light, which is widely used for illumination to reduce the photic disturbance to nocturnal animals during the dark phase. However, the appropriate intensity of the red light is unknown. In the present study, we recorded electroencephalograms and electromyograms of freely moving mice to investigate the effects of red light emitted by light-emitting diodes at different intensities and for different durations on the sleep-wake behavior of mice. White light was used as a control. Unexpectedly, red light exerted potent sleep-inducing effects and changed the sleep architecture in terms of the duration and number of sleep episodes, the stage transition, and the EEG power density when the intensity was >20 lx. Subsequently, we lowered the light intensity and demonstrated that red light at or below 10 lx did not affect sleep-wake behavior. White light markedly induced sleep and disrupted sleep architecture even at an intensity as low as 10 lx. Our findings highlight the importance of limiting the intensity of red light (⩽10 lx) to avoid optical influence in nocturnal behavioral experiments, particularly in the field of sleep and circadian research.

Keywords: circadian; light; light-emitting diode; masking.


Conflict of interest statement

The authors declare no conflict of interest.

Figures

Figure 1
Figure 1
Effects of 100, 30 and 20 lx white light and red light pulses on NREM sleep and REM sleep during the dark phase. (a, b) The normalized electroluminescence spectra (a.u., arbitrary unit) of white (a) and red (b) LED sources. (c) Time course changes in NREM sleep and REM sleep in mice, which are exposed to 100 lx white light in the day and a 1 h/1 h L (100 lx white or red light)/D cycle or constant darkness at night. Each cycle represents the hourly mean±SEM of NREM sleep and REM sleep. Black, white and red circles indicate the profiles of continuous darkness, white light and red light treatments, respectively. The filled and open bars on the x axes indicate light-off and light-on treatments, respectively, at night. *P<0.05, **P<0.01 indicate significant differences between white light and continuous darkness. #P<0.05, ##P<0.01 indicate significant differences between red light and continuous darkness. Data were assessed via two-way ANOVA followed by a Bonferroni test. (d) Total time spent in NREM sleep and REM sleep of the groups exposed to 100, 30 and 20 lx white or red light, as well as continuous darkness, during 5-h light-on phase. Black, white and red bars show the profiles of continuous darkness, white or red light treatments, respectively. Values are means±SEM (continuous darkness n=7; 100 lx, n=9; 30 lx, n=5-7; 20 lx, n=5, 6). *P<0.05, **P<0.01 compared with continuous darkness, assessed via one-way ANOVA followed by a Bonferroni test.
Figure 2
Figure 2
Episode number, mean duration (ac), stage transition (df) and EEG power density of NREM sleep (gi) during 5-h light-on phase. Black, white and red bars show the profiles of continuous darkness, white and red light treatments, respectively. Values are means±SEM (100 lx, n=9; 30 lx, n=5–7; 20 lx, n=5, 6). *P<0.05, **P<0.01 compared with continuous darkness, assessed via one-way ANOVA followed by a Bonferroni test. Blue and red horizontal bars indicate the location of a statistically significant difference (P<0.05, two-tailed unpaired t-test) between white or red light and continuous darkness, respectively. R, REM sleep; S, NREM sleep; W, wake.
Figure 3
Figure 3
Effects of 10 lx white or red light pulses on NREM sleep and REM sleep during the dark phase. (a) Time course changes of NREM sleep and REM sleep in mice exposed to 100 lx white light in the day and a 1 h/1 h L (10 lx white or red light)/D cycle or continuous darkness at night. Each cycle represents the hourly mean±SEM of NREM sleep and REM sleep. Black, white and red circles indicate the profiles of continuous darkness, white light and red light treatments, respectively. The horizontal filled and open bars on the x axes indicate light-off and light-on treatments, respectively, at night. *P<0.05, **P<0.01 indicate significant differences between white light and continuous darkness. ##P<0.01 indicates significant differences between white light and red light. n.s. indicates no significant difference between red light and continuous darkness. Data shown are assessed via two-way ANOVA followed by a Bonferroni test. (b) Total time spent in NREM sleep and REM sleep of the groups of 10 lx white or red light, as well as continuous darkness, during 5-h light-on phase. Black, white and red bars show the profiles of continuous darkness, white light and red light treatments, respectively. Values are means±SEM (constant darkness n=7; 10 lx, n=6, 7). *P<0.05 compared with continuous darkness, assessed via one-way ANOVA followed by a Bonferroni test.
Figure 4
Figure 4
Episode number, mean duration (a), stage transition (b) and EEG power density of NREM sleep (c) during 5-h light-on phase. Black, white and red bars show the profiles of continuous darkness, white and red light (10 lx) treatments, respectively. Values are means±SEM (n=6, 7). **P<0.01 indicates significant differences between two groups. Data were assessed via one-way ANOVA followed by a Bonferroni test. Blue horizontal bars indicate the location of a statistically significant difference (P<0.05, two-tailed unpaired t-test) between white light and continuous darkness. R, REM sleep; S, NREM sleep; W, wake.
Figure 5
Figure 5
NREM sleep and REM sleep in mice after cessation of exposure to 1 h/1 h white light (WL) or red light (RL) at 10 lx/D. (a) Time course changes of NREM sleep and REM sleep in mice after ending exposure to 1 h/1 h WL at 10 lx/D. Each cycle represents the hourly mean±SEM of NREM sleep and REM sleep. White and blue circles indicate the profiles of the baseline day and the day after cessation of exposure to 1 h/1 h WL at 10 lx/D, respectively. The horizontal open and filled bars on the x axes indicate the 12-h dark and 12-h light periods, respectively. *P<0.05, **P<0.01 compared with baseline, assessed via two-way ANOVA followed by a Bonferroni test. (b) Total time spent in NREM sleep and REM sleep during the first 2 h of the dark phase after cessation of 1 h/1 h WL at 10 lx/D. (c) Time course changes of NREM sleep and REM sleep in mice after cessation of exposure to 1 h/1 h RL at 10 lx/D. Each cycle represents the hourly mean±SEM of NREM sleep and REM sleep. White and red circles indicate the profiles of the baseline day and the day after ending exposure to 1 h/1 h RL at 10  lx/D, respectively. The horizontal open and filled bars on the x axes indicate the 12-h dark and 12-h light periods, respectively. Data shown are assessed via two-way ANOVA followed by a Bonferroni test. (d) Total time spent in NREM sleep and REM sleep during the entire day, 12-h light phase and 12-h dark phase of the baseline day and the day after cessation of exposure to 1 h/1 h RL at 10 lx/D, respectively. Values are means±SEM (n=4). No significant difference compared with the baseline, assessed via a two-tailed paired t-test.
Figure 6
Figure 6
Effects of 10 lx white or red light exposure for 12 h on sleep during the entire dark phase. (a) Time course changes in NREM sleep and REM sleep in mice exposed to 100 lx white light (WL) during the day and exposed to darkness, 10 lx WL and red light (RL) at night. Each cycle represents the hourly mean±SEM of NREM and REM sleep. Black, white and red circles indicate the profiles of darkness, white and red light treatments, respectively. The horizontal black, white and red bars on the x axes indicate darkness, white light and red light treatments, respectively. *P<0.05, **P<0.01 indicate significant differences between white light and darkness. #P<0.05, ##P<0.01 indicate significant differences between white light and red light. Data shown are assessed via two-way ANOVA followed by a Bonferroni test. (b) Total time spent in NREM sleep and REM sleep for 3 h after 10 lx white or red light treatment. Black, white and red bars show the profiles of darkness, white and red light treatments, respectively. **P<0.01 or ##P<0.01 indicates significant differences compared with darkness or to red light, respectively. Data were assessed via one-way ANOVA followed by a Bonferroni test. (c, d) Stage transition (c), episode number and mean duration (d) in a 3-h period after the treatment of 10 lx white or red light. Black, white and red bars show the profiles of darkness, white and red light treatments, respectively. *P<0.05, **P<0.01 indicate significant differences between two groups. Data were assessed via one-way ANOVA followed by a Bonferroni test. R, REM sleep; S, NREM sleep; W, Wake. (e, f), EEG power density of NREM sleep within the first 3 h (e) and the entire 12 h (f) during the dark phase. Values are means±SEM (n=5–8). Blue and red horizontal bars indicate the location of a statistically significant difference (P<0.05, two-tailed unpaired t-test) between white or red light and continuous darkness, respectively.

Similar articles

Cited by

References

    1. Borbély AA. A two process model of sleep regulation. Hum Neurobiol 1982; 1: 195–204. - PubMed
    1. Daan S, Beersma DG, Borbély AA. Timing of human sleep: recovery process gated by a circadian pacemaker. Am J Physiol 1984; 246: R161–R183. - PubMed
    1. Muindi F, Zeitzer JM, Heller HC. Retino-hypothalamic regulation of light-induced murine sleep. Front Syst Neurosci 2014; 8: 135. - PMC - PubMed
    1. Bedrosian TA, Vaughn CA, Galan A, Daye G, Weil ZM et al. Nocturnal light exposure impairs affective responses in a wavelength-dependent manner. J Neurosci 2013; 33: 13081–13087. - PMC - PubMed
    1. Golombek DA, Rosenstein RE. Physiology of circadian entrainment. Physiol Rev 2010; 90: 1063–1102. - PubMed

LinkOut - more resources