. 2018 Sep 18;169(6):367-375.
doi: 10.7326/M18-1243. Epub 2018 Aug 28.

Opioid Prescribing in the United States Before and After the Centers for Disease Control and Prevention's 2016 Opioid Guideline

Affiliations

Opioid Prescribing in the United States Before and After the Centers for Disease Control and Prevention's 2016 Opioid Guideline

Amy S B Bohnert et al. Ann Intern Med. .

Abstract

Background: In response to adverse outcomes from prescription opioids, the Centers for Disease Control and Prevention (CDC) released the Guideline for Prescribing Opioids for Chronic Pain in March 2016.

Objective: To test the hypothesis that the CDC guideline release corresponded to declines in specific opioid prescribing practices.

Design: Interrupted time series analysis of monthly prescribing measures from the IQVIA transactional data warehouse and Real-World Data Longitudinal Prescriptions population-level estimates based on retail pharmacy data. Population size was determined by U.S. Census monthly estimates.

Setting: United States, 2012 to 2017.

Patients: Persons prescribed opioid analgesics.

Measurements: Outcomes included opioid dosage, days supplied, overlapping benzodiazepine prescriptions, and the overall rate of prescribing.

Results: The rate of high-dosage prescriptions (≥90 morphine equivalent milligrams per day) was 683 per 100 000 persons in January 2012 and declined by 3.56 (95% CI, -3.79 to -3.32) per month before March 2016 and by 8.00 (CI, -8.69 to -7.31) afterward. Likewise, the percentage of patients with overlapping opioid and benzodiazepine prescriptions was 21.04% in January 2012 and declined by 0.02% (CI, -0.04% to -0.01%) per month before the CDC guideline release and by 0.08% (CI, -0.08% to -0.07%) per month afterward. The overall opioid prescribing rate was 6577 per 100 000 persons in January 2012 and declined by 23.48 (CI, -26.18 to -20.78) each month before the guideline release and by 56.74 (CI, -65.96 to -47.53) per month afterward.

Limitation: No control population; inability to determine the appropriateness of opioid prescribing.

Conclusion: Several opioid prescribing practices were decreasing before the CDC guideline, but the time of its release was associated with a greater decline. Guidelines may be effective in changing prescribing practices.

Primary funding source: CDC.


Conflict of interest statement

Disclosures: Authors have disclosed no conflicts of interest. Forms can be viewed at www.acponline.org/authors/icmje/ConflictOfInterestForms.do?msNum=M18-1243.

Figures

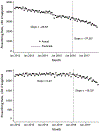
Appendix Figure 1.
Appendix Figure 1.
Rate of prescribing per 100 000 persons before and after release of the CDC’s Guideline for Prescribing Opioids for Chronic Pain in March 2016, stratified by days supplied. Dashed vertical lines represent the month of CDC guideline implementation (March 2016). CDC = Centers for Disease Control and Prevention. Top. Rate of prescriptions dispensed with <30 d supplied per 100 000 persons. Bottom. Rate of prescriptions dispensed with ≥30 d supplied per 100 000 persons. * Change in slope (i.e., rate of decline per month) from before to after the CDC guideline release was statistically significant at P < 0.001.
Appendix Figure 2.
Appendix Figure 2.
Count of prescriptions dispensed per month, per 100 000 persons, for opioid and benzodiazepine medications before and after release of the CDC’s Guideline for Prescribing Opioids for Chronic Pain in March 2016. Dashed vertical line represents the month of CDC guideline implementation (March 2016). CDC = Centers for Disease Control and Prevention.
Figure 1.
Figure 1.
Overall prescribing rate and dosage-related outcomes before and after release of the CDC’s Guideline for Prescribing Opioids for Chronic Pain in March 2016. Denominators in panels A to C are based on total U.S. population size. Dashed vertical lines represent the month of CDC guideline implementation (March 2016). CDC = Centers for Disease Control and Prevention; MME = morphine milligram equivalents. A. Count of all opioid prescriptions dispensed in a month, per 100 000 persons. B. Number of opioid prescriptions dispensed in a month to total a daily dosage >90 MME, per 100 000 persons. C. Total of all MME dispensed in a month, per person. D. Average daily dosage (in MME) per prescription, for all opioid prescriptions written in a month. * Change in slope (i.e., rate of decline per month) from before to after the CDC guideline release was statistically significant at P < 0.001.
Figure 2.
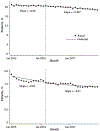
Figure 2.
Patient-level outcomes before and after release of the CDC’s Guideline for Prescribing Opioids for Chronic Pain in March 2016. Dashed vertical lines represent the month of CDC guideline implementation (March 2016). CDC = Centers for Disease Control and Prevention; ER/LA = extended-release or long-acting. Top. Percentage of patients with an opioid and a benzodiazepine prescription overlapping by ≥1 d. Bottom. Percentage of opioid-naive patients filling an ER/LA opioid prescription. * Change in slope (i.e., rate of decline per month) from before to after the CDC guideline release was statistically significant at P < 0.001.
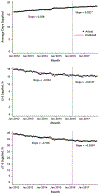
Figure 3.
Figure 3.
Outcomes regarding days supplied before and after release of the CDC’s Guideline for Prescribing Opioids for Chronic Pain in March 2016. Dashed vertical lines represent the month of CDC guideline implementation (March 2016). CDC = Centers for Disease Control and Prevention. Top. Average days supplied for all prescriptions dispensed in a month. Middle. Percentage of opioid prescriptions dispensed in a month with ≤3 d supplied. Bottom. Percentage of opioid prescriptions dispensed in a month with ≤7 d supplied. * P = 0.012. † P = 0.005. ‡ P < 0.001.

Comment in

References

    1. Hedegaard H, Warner M, Miniño AM Drug overdose deaths in the United States, 1999–2016 National Center for Health Statistics data brief. Hyattsville, MD: National Center for Health Statistics; 2017.
    1. Centers for Disease Control and Prevention (CDC). Emergency department visits involving nonmedical use of selected prescription drugs—United States, 2004–2008. MMWR Morb Mortal Wkly Rep. 2010;59:705–9. [PMID: ] - PubMed
    1. Han B, Compton WM, Jones CM, Cai R. Nonmedical prescription opioid use and use disorders among adults aged 18 through 64 years in the United States, 2003–2013. JAMA. 2015;314:1468–78. [PMID: ] doi:10.1001/jama.2015.11859 - DOI - PubMed
    1. Paulozzi LJ, Weisler RH, Patkar AA. A national epidemic of unintentional prescription opioid overdose deaths: how physicians can help control it. J Clin Psychiatry. 2011;72:589–92. [PMID: ] doi:10.4088/JCP.10com06560 - DOI - PubMed
    1. Bohnert AS, Valenstein M, Bair MJ, Ganoczy D, McCarthy JF, Ilgen MA, et al. Association between opioid prescribing patterns and opioid overdose-related deaths. JAMA. 2011;305:1315–21. [PMID: ] doi:10.1001/jama.2011.370 - DOI - PubMed

Publication types

MeSH terms