. 2018 Nov;61(11):2356-2370.
doi: 10.1007/s00125-018-4708-x. Epub 2018 Aug 30.

Innate immune activity as a predictor of persistent insulin secretion and association with responsiveness to CTLA4-Ig treatment in recent-onset type 1 diabetes

Affiliations

Innate immune activity as a predictor of persistent insulin secretion and association with responsiveness to CTLA4-Ig treatment in recent-onset type 1 diabetes

Susanne M Cabrera et al. Diabetologia. 2018 Nov.

Abstract

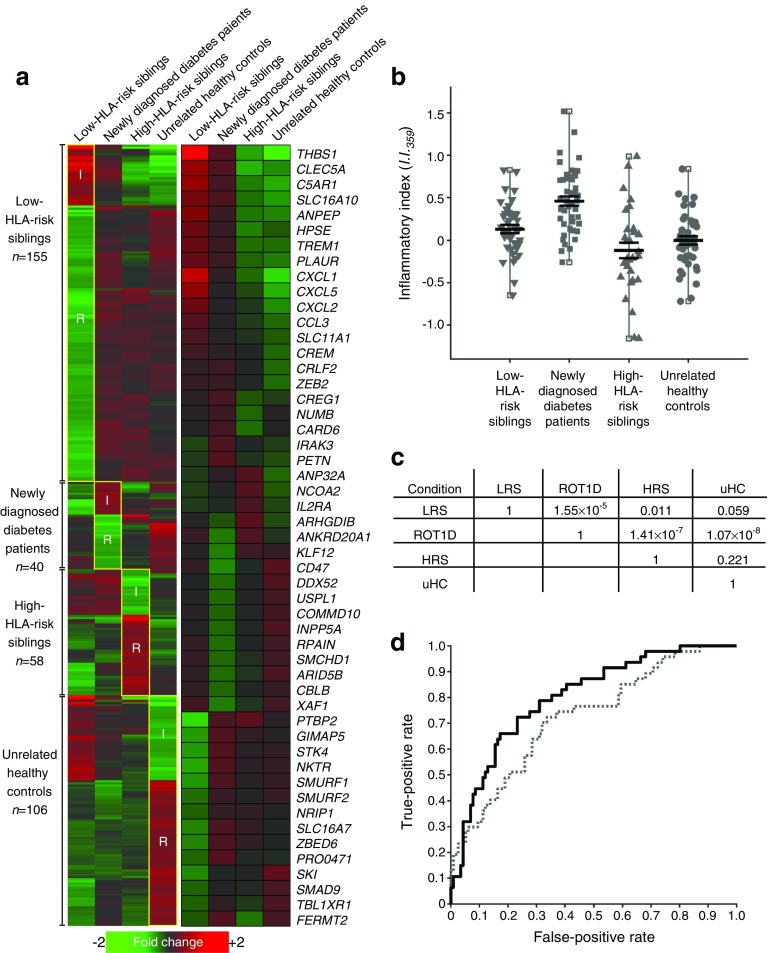
Aims/hypothesis: The study aimed to determine whether discrete subtypes of type 1 diabetes exist, based on immunoregulatory profiles at clinical onset, as this has significant implications for disease treatment and prevention as well as the design and analysis of clinical trials.

Methods: Using a plasma-based transcriptional bioassay and a gene-ontology-based scoring algorithm, we examined local participants from the Children's Hospital of Wisconsin and conducted an ancillary analysis of TrialNet CTLA4-Ig trial (TN-09) participants.

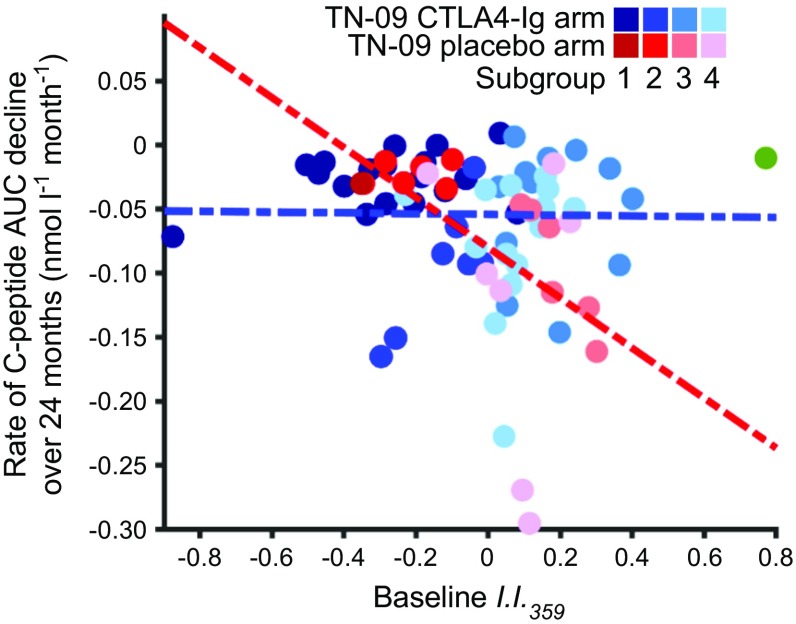
Results: The inflammatory/regulatory balance measured during the post-onset period was highly variable. Notably, a significant inverse relationship was identified between baseline innate inflammatory activity and stimulated C-peptide AUC measured at 3, 6, 12, 18 and 24 months post onset among placebo-treated individuals (p ≤ 0.015). Further, duration of persistent insulin secretion was negatively related to baseline inflammation (p ≤ 0.012) and positively associated with baseline abundance of circulating activated regulatory T cells (CD4+/CD45RA-/FOXP3high; p = 0.016). Based on these findings, data from participants treated with CTLA4-Ig were stratified by inflammatory activity at onset; in this way, we identified pathways and transcripts consistent with inhibition of T cell activation and enhanced immunoregulation. Variance among baseline plasma-induced signatures of TN-09 participants was further examined with weighted gene co-expression network analysis and related to clinical metrics. Four age-independent subgroups were identified that differed in terms of baseline innate inflammatory/regulatory bias, rate of C-peptide decline and response to CTLA4-Ig treatment.

Conclusions/interpretation: These data support the existence of multiple type 1 diabetes subtypes characterised by varying levels of baseline innate inflammation that are associated with the rate of C-peptide decline.

Data availability: Gene expression data files are publicly available through the National Center for Biotechnology Information Gene Expression Omnibus (accession number GSE102234).

Keywords: Biomarker; CTLA4-Ig; Disease heterogeneity; Honeymoon; Partial remission; Therapeutic response; Type 1 diabetes.


Conflict of interest statement

The authors declare that there is no duality of interest associated with this manuscript.

Figures

Fig. 1
Fig. 1
Refined scoring of plasma-induced transcriptional signatures. (a) Mean expression levels of the 359 probe sets that best distinguish individuals newly diagnosed with type 1 diabetes from the low-HLA-risk sibling, high-HLA-risk sibling, and unrelated healthy control cohorts. The analysis included: individuals with diabetes (n = 47, age 10.0 ± 2.9 years, blood glucose 8.6 ± 4.1 mmol/l, HbA1c 5.8 ± 9.3 mmol/mol [7.5 ± 1.2%]; baseline samples were collected 2–7 months after diagnosis when metabolic control had been achieved); low-HLA-risk siblings (n = 42, age 8.4 ± 2.0 years, blood glucose 5.2 ± 0.9 mmol/l); high-HLA-risk siblings (n = 30, age 8.6 ± 1.9 years, blood glucose 5.2 ± 0.7 mmol/l); and unrelated healthy control individuals (n = 44, age 15.0 ± 4.1 years, blood glucose 5.1 ± 0.7 mmol/l). Random forest analysis used 12,589 probe sets identified in the six possible comparisons between the four cohorts at a fold change >1.1 and an FDR <20%. The probe sets that exhibited a random forest Gini score >3.49 when any one group was compared with the three others were retained. A second analysis identified probe sets that were regulated at log2 ratio >|0.263| (1.2-fold) and FDR <20% when one cohort was compared with any of the three others. A total of 359 transcripts met both criteria. (a) The left section shows the relative expression levels of the 359 probe sets across the four cohorts. The second analysis enabled the definition of four data subsets, the number of transcripts within each data subset is shown on the left. The transcripts generally annotated as inflammatory and regulatory within each data subset are indicated; the upregulated transcripts in the low-HLA-risk sibling and diabetic individual data subsets are generally annotated as inflammatory, while upregulated transcripts in the high-HLA-risk sibling and unrelated healthy control data subsets are generally annotated as regulatory. The annotated dataset is available from the corresponding author on request. The right section shows the mean expression levels of a subset of well-annotated transcripts. (b) Ontology-based scoring of cross-sectional samples using I.I.359 significantly discriminates the diabetic cohort from the other cohorts. The mean I.I.359 for the 47 cross-sectional diabetes participants (mean ± SE 0.46 ± 0.05) was significantly higher than that observed for the 42 siblings with low HLA risk (0.13 ± 0.05), 30 siblings with high HLA risk (−0.12 ± 0.09) and 44 unrelated healthy control participants (0.00 ± 0.05). p values are shown in panel (c); two-tailed unpaired t tests for the comparisons between each cohort. (d) ROC curve for 359 probe sets (solid line; AUC = 0.80) shows improved discrimination of the diabetic cohort from the related and unrelated control cohorts compared with the previously reported 1374 probe sets described in Chen et al [22] (dotted line; AUC = 0.72). ROT1D, recent-onset type 1 diabetes; LRS, low-HLA-risk sibling; HRS, high-HLA-risk sibling; I, inflammatory; R, regulatory; uHC, unrelated healthy control group
Fig. 2
Fig. 2
The relationship between baseline I.I.359 and future beta cell function. A significant inverse relationship exists between baseline I.I.359 and 2 h C-peptide AUC percent change from baseline at 3, 6, 12, 18 and 24 months in 19 placebo-treated TN-09 participants (all p < 0.015) but not in 54 CTLA4-Ig-treated TN-09 participants. (a) 3 months: placebo treated, slope = −0.85, r2 = 0.48, p = 0.001; CTLA4-Ig treated, slope = 0.07, r2 = 0.002, p = 0.731. (b) 6 months: placebo treated, slope = −0.84, r2 = 0.36, p = 0.006; CTLA4-Ig treated, slope = 0.12, r2 = 0.008, p = 0.522. (c) 12 months: placebo treated, slope = −0.90; r2 = 0.29; p = 0.015; CTLA4-Ig treated, slope = −0.06; r2 = 0.002; p = 0.768. (d) 18 months: placebo treated, slope = −0.90, r2 = 0.37; p = 0.004; CTLA4-Ig treated, slope = 0.01, r2 = 0.0001, p = 0.939. (e) 24 months: placebo treated, slope = −0.91, r2 = 0.56; p = 0.0002; CTLA4-Ig treated, slope = 0.18, r2 = 0.017, p = 0.343. The data are similar if considered as baseline-normalised C-peptide AUC. (f) Baseline I.I.359 is inversely related to rate (slope) of C-peptide decline over the 24 month study period: placebo treated, slope = −0.18, r2 = 0.21; p = 0.041; CTLA4-Ig treated, slope = −0.003, r2 = 0.0003, p = 0.909. A truncated linear regression was used to estimate the slope of decrease for each individual. Larger negative slope values imply faster decline of stimulated C-peptide. The data are similar if considered as baseline-normalised C-peptide AUC. Black solid circles and solid line, placebo-treated; grey open circles and dotted line, CTLA4-Ig treated
Fig. 3
Fig. 3
Inflammation levels at onset of type 1 diabetes correlate with duration of the post-onset partial remission. (a) Among 19 TN-09 participants in the placebo arm (ages 8–35 years), Weibull (solid line, grey shaded area = 1 SE) and Cox regression (dashed line) analyses identified an inverse relationship between I.I.359 and median remission duration (p = 0.012). The partial remission period was defined as the length of time from diagnosis in which the 2 h stimulated C-peptide AUC was >0.2 nmol/l. (b) Weibull (solid line, grey shaded area = 1 SE) and Cox regression (dotted line) analyses identified a significant relationship between I.I.359 and median remission duration among 26 local individuals with diabetes (p = 6.8 × 10−10). These participants were aged 4–16 years and possessed high-risk HLA haplotypes; samples were collected 2–7 months after diagnosis (see ESM Table 1 for additional characteristics). As dynamic testing was not performed on the local cohort, the IDAA1c was determined from HbA1c and total daily insulin doses at post-onset clinic visits as described in Mortensen et al [27]. IDAA1c ≤9 is reflective of a stimulated C-peptide >0.3 nmol/l; thus, the remission duration was defined as the last quarterly clinic visit when IDAA1c was ≤9. Among TN-09 participants in the placebo arm, remission lengths determined using the IDAA1c were highly correlated with those determined through dynamic testing (r = 0.79); however, as anticipated [49], on average, the use of the IDAA1c underestimated partial remission durations relative to dynamic testing (1.2 ± 1.0 years vs 2.2 ± 1.5 years, respectively). In (a, b) participant age range is indicated by colour: green, 0–6 years; black, >6–12 years; red, >12–18 years; blue, >18 years; boxes indicate participants in remission at the last visit. (c, d) Kaplan–Meier analysis: the proportion of TN-09 placebo-arm participants (n = 19) (c) and local individuals with diabetes (n = 26) (d) in remission was compared for those with I.I.359 above the median (dashed line) and those with I.I.359 below the median (solid line). A logrank test found participants with I.I.359 above the median were significantly different in both populations (TN-09: p = 0.016; local individuals: p = 0.005). (e) Representative flow cytometry profiles showing the gating strategy for resting and activated Treg populations in cryopreserved PBMCs from local individuals with diabetes. Resting and activated CD4+ Tregs were respectively defined as CD45RA+/FOXP3low and CD45RA/FOXP3high. Since CD45RA and CD45RO are different CD45 isoforms that are respectively expressed on naive and activated/memory T cells, the expression of CD45RO as well as CD25 confirmed the phenotype of resting (CD45RO/CD25+) and activated (CD45RO+/CD25high) Tregs. Each analysis included fluorescence minus one controls to ensure correct gating. (f) Per cent activated Tregs among total (active + resting) Tregs in cryopreserved PBMCs collected from 23 local individuals with diabetes during the immediate post-onset period. Eight of these participants were among the 26 analysed by plasma-induced transcription. The data were classified as having shorter or longer partial remissions using the Jenks natural breaks method. The resulting groups had ages of 8.4 ± 3.3 and 11.3 ± 3.8 years, respectively (not significant, p > 0.05). The per cent activated Treg was higher in those with longer vs shorter partial remissions (p = 0.016). The data are similar if plotted as percentage of activated Treg among total CD4+ T cells
Fig. 4
Fig. 4
The relationship between I.I.359 and age of clinical onset. (a) Among the 74 TN-09 participants analysed, the age at diagnosis was directly related to baseline 2 h C-peptide AUC (r2 = 0.28, p = 2.1 × 10−5). The baseline I.I.359 was independent of age in TN-09 (b) and local (c) participants (n = 26). In (a, b), black solid circles, placebo treated (n = 19); grey open circles, CTLA4-Ig treated (n = 54); dotted/dashed vertical line, 18 years of age
Fig. 5
Fig. 5
Signature of therapeutic response in TN-09. (a) Analysis of the 1509 probe sets regulated between the CTLA4-Ig responders (n = 8) and rapidly progressing placebo-treated individuals (n = 7) matched for baseline I.I.359 at the 3 month time point. The top three panels (left to right) illustrate two-way clustering of the selected and excluded participants in each arm. Left panel, mean expression of the four groups. Middle panel, participants selected for the analysis. Right panel, remaining CTLA4-Ig- and placebo-treated participants. Lower three panels, expression levels of a selected set of well-annotated transcripts. The colour bar indicates assigned treatment arm: red, placebo; blue, CTLA4-Ig. Note: samples were not available for two placebo-treated participants at the 3 month time point. The annotated dataset is available from the corresponding author on request. (b) Mean expression levels of the 1509 differentially induced probe sets at 12 and 24 months. (c) Upstream regulator analysis using IPA. A z score >2.0 is significantly activated; a z score >−2.0 is significantly inhibited. (d) CTLA4-Ig add-back experiment. The mean induced expression levels of the 1509 probe sets after plasma of five local untreated individuals with diabetes were supplemented with 0 μg/ml, 25 μg/ml or 82 μg/ml CTLA4-Ig are shown. ROT1D, recent-onset type 1 diabetes
Fig. 6
Fig. 6
Analysis of highly variant transcripts in baseline signatures indicates the existence of type 1 diabetes subgroups. (a) Identification of highly variant transcripts common to TN-09 participants (n = 74) and local individuals with diabetes (n = 26). The Affymetrix U133 plus 2.0 array has probe sets for interrogation of >47,000 transcripts. The 20,000 probe sets that, on average, exhibited the lowest signal intensity were filtered from the analysis (maximum log2 intensity <4 RFU). The 7000 probe sets exhibiting the greatest median absolute deviation were retained. (b) Co-expression networks among the 3159 commonly variant transcripts were identified with WGCNA using a power of β = 12 (linear regression model fitting index R2 > 0.8). Twelve co-expression modules were identified (represented by rows, labelled by colour). The number of probe sets assigned to each module is indicated; 79/3159 (2.5%) could not be assigned to a co-expression network. Columns represent a trait or cohort subset. The correlation coefficient shown within each box is between the module eigengene and the trait or cohort; the correlation p value is given in parentheses. An eigengene is defined as the first principal component of a given module and is representative of the expression profiles of genes within that module. Red represents a positive correlation between the module eigengene and trait; green represents a negative correlation. Significant relationships were not detected with age, sex, Tanner stage, HbA1c at baseline, HLA, autoantibody status, BMI, duration of disease or complete blood cell counts. (c) Dendrogram illustrating co-expression modules. Each vertical line corresponds to a gene. The y-axis indicates the network distance (1 – topological overlap), values closer to 0 indicate greater similarity of transcript expression profiles across samples. Co-expression modules are indicated by colours in the first colour band. The additional colour bands illustrate the positively correlated (progressively red) or negatively correlated (progressively blue) transcripts for the trait/cohorts. (d) Hierarchical clustering of the baseline signatures of TN-09 participants using the 916 significantly regulated transcripts belonging to the three modules significantly correlated with 2 h AUC at baseline and the rate of C-peptide decline within the placebo-treated arm. The three modules included 85 transcripts used to calculate I.I.359 (85/359, 23.7%, χ2 < 1.0 × 10−4). Four major subgroups of individuals with new onset diabetes are indicated, none of which significantly differ by age or baseline C-peptide AUC. Colour bars indicate: fold change, baseline C-peptide AUC, rate of C-peptide decline over 24 months, selected CTLA4-Ig responders (as in Fig. 5; blue), selected rapidly progressing placebos (as in Fig. 5; ‘Selected fast placebos’; peach), age at baseline and I.I.359. The colour bar indicates assigned treatment arm: red, placebo; blue, CTLA4-Ig. The 3159 commonly variant probe sets and the modules to which they were assigned are available as an annotated dataset from the corresponding author on request
Fig. 7
Fig. 7
Type 1 diabetes subgroups exhibit different responses to CTLA4-Ig treatment. (a) Heatmaps illustrating expression levels of the 916 significantly regulated transcripts belonging to the three modules significantly correlated with 2 h C-peptide AUC at baseline and the placebo-treated arm of TN-09; an annotated heatmap is shown below. The four major subgroups (as shown in Fig. 6d) are indicated for each arm. Well-annotated transcripts are illustrated, and the module to which they belong is indicated by the colour bar on the left. Colour bars are provided that indicate: fold change; baseline C-peptide AUC; rate of C-peptide decline over 24 months; selected CTLA4-Ig responders (as in Fig. 5; blue); selected placebos (as in Fig. 5; ‘Selected fast placebos’; peach); age at baseline; and I.I.359. (b) TN-09 participants belonging to subgroups 1–4 exhibit different responses to CTLA4-Ig treatment. Tabulated are subgroup mean values for each metric. Statistical differences were assessed with a two-tailed unpaired Student’s t test, superscript letters denote p < 0.05 for: aCTLA4-Ig subgroup 1 vs CTLA4-Ig subgroup 2; bCTLA4-Ig subgroup 1 vs CTLA4-Ig subgroup 3; cCTLA4-Ig subgroup 1 vs CTLA4-Ig subgroup 4; dCTLA4-Ig subgroup 2 vs CTLA4-Ig subgroup 3; eCTLA4-Ig subgroup 2 vs CTLA4-Ig subgroup 4; fCTLA4-Ig subgroup 3 vs placebo subgroup 3; gplacebo subgroup 2 vs placebo subgroup 3; and hplacebo subgroup 2 vs placebo subgroup 4
Fig. 8
Fig. 8
Type 1 diabetes subgroups exhibit different rates of C-peptide decline and responses to CTLA4-Ig treatment. A significant inverse relationship between baseline I.I.359 and the rate (slope) of C-peptide decline in placebo-treated TN-09 participants is described in Fig. 2f. Here, this relationship is considered from the perspective of subgroups 1–4. The green data point is the outlying CTLA4-Ig participant not assigned to a subgroup (left-most participant in Fig. 6d). Regression lines are shown for the CTLA4-Ig and placebo arms of TN-09 in blue and red, respectively

References

    1. Morran MP, Vonberg A, Khadra A, Pietropaolo M. Immunogenetics of type 1 diabetes mellitus. Mol Asp Med. 2015;42:42–60. doi: 10.1016/j.mam.2014.12.004. - DOI - PMC - PubMed
    1. Kronenberg D, Knight RR, Estorninho M, et al. Circulating preproinsulin signal peptide-specific CD8 T cells restricted by the susceptibility molecule HLA-A24 are expanded at onset of type 1 diabetes and kill beta-cells. Diabetes. 2012;61:1752–1759. doi: 10.2337/db11-1520. - DOI - PMC - PubMed
    1. Arif S, Tree TI, Astill TP, et al. Autoreactive T cell responses show proinflammatory polarization in diabetes but a regulatory phenotype in health. J Clin Investig. 2004;113:451–463. doi: 10.1172/JCI19585. - DOI - PMC - PubMed
    1. Peakman M, Stevens EJ, Lohmann T, et al. Naturally processed and presented epitopes of the islet cell autoantigen IA-2 eluted from HLA-DR4. J Clin Investig. 1999;104:1449–1457. doi: 10.1172/JCI7936. - DOI - PMC - PubMed
    1. Pociot F, Lernmark A. Genetic risk factors for type 1 diabetes. Lancet. 2016;387:2331–2339. doi: 10.1016/S0140-6736(16)30582-7. - DOI - PubMed

Publication types