

Mass Spectrometry Imaging and Integration with Other Imaging Modalities for Greater Molecular Understanding of Biological Tissues
- PMID: 30167993
- PMCID: PMC6244545
- DOI: 10.1007/s11307-018-1267-y
Mass Spectrometry Imaging and Integration with Other Imaging Modalities for Greater Molecular Understanding of Biological Tissues
Abstract
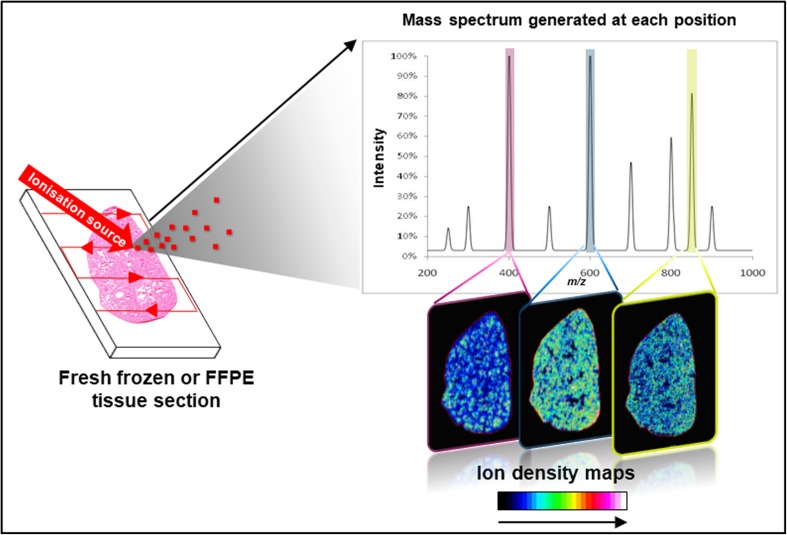
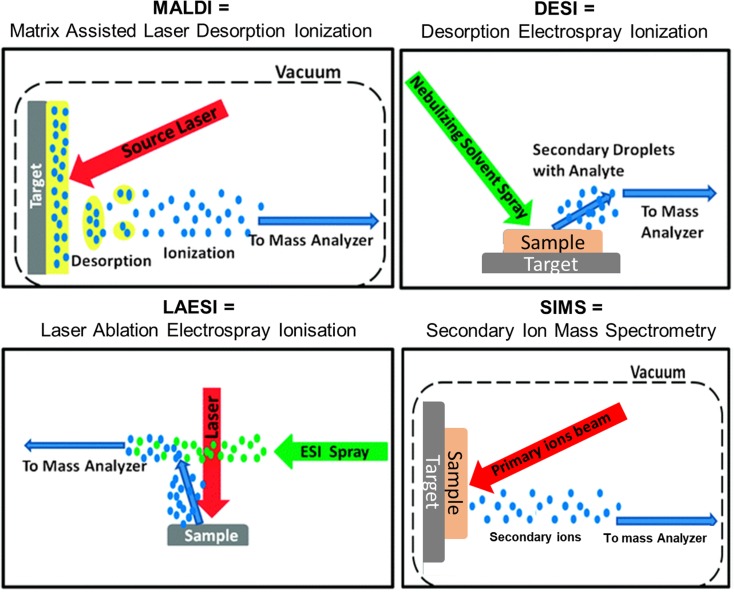
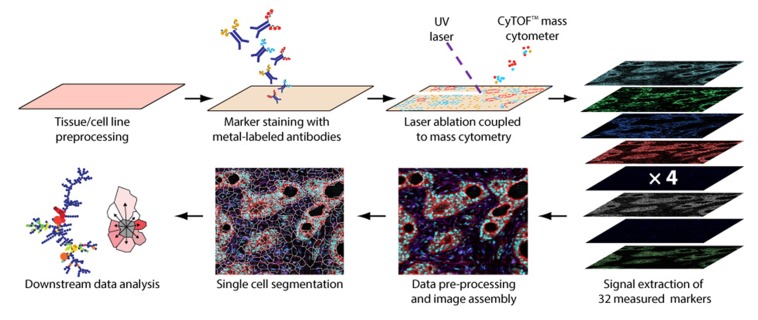
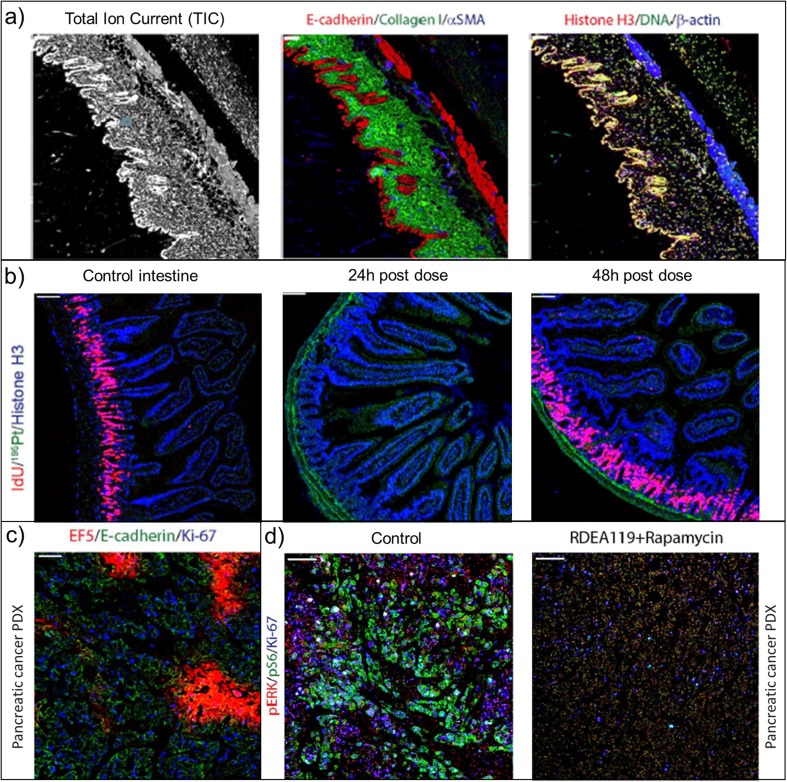
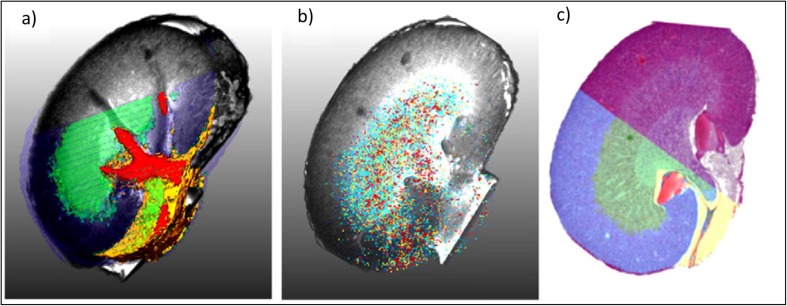
Over the last two decades, mass spectrometry imaging (MSI) has been increasingly employed to investigate the spatial distribution of a wide variety of molecules in complex biological samples. MSI has demonstrated its potential in numerous applications from drug discovery, disease state evaluation through proteomic and/or metabolomic studies. Significant technological and methodological advancements have addressed natural limitations of the techniques, i.e., increased spatial resolution, increased detection sensitivity especially for large molecules, higher throughput analysis and data management. One of the next major evolutions of MSI is linked to the introduction of imaging mass cytometry (IMC). IMC is a multiplexed method for tissue phenotyping, imaging signalling pathway or cell marker assessment, at sub-cellular resolution (1 μm). It uses MSI to simultaneously detect and quantify up to 30 different antibodies within a tissue section. The combination of MSI with other molecular imaging techniques can also provide highly relevant complementary information to explore new scientific fields. Traditionally, classical histology (especially haematoxylin and eosin-stained sections) is overlaid with molecular profiles obtained by MSI. Thus, MSI-based molecular histology provides a snapshot of a tissue microenvironment and enables the correlation of drugs, metabolites, lipids, peptides or proteins with histological/pathological features or tissue substructures. Recently, many examples combining MSI with other imaging modalities such as fluorescence, confocal Raman spectroscopy and MRI have emerged. For instance, brain pathophysiology has been studied using both MRI and MSI, establishing correlations between in and ex vivo molecular imaging techniques. Endogenous metabolite and small peptide modulation were evaluated depending on disease state. Here, we review advanced 'hot topics' in MSI development and explore the combination of MSI with established molecular imaging techniques to improve our understanding of biological and pathophysiological processes.
Keywords: Histology; Imaging mass cytometry (IMC); Magnetic resonance imaging (MRI); Mass spectrometry imaging (MSI); Molecular imaging; Pathology.
Conflict of interest statement
The authors declare no conflict of interest.
Figures
References
-
- Caprioli RM, Farmer TB, Gile J. Molecular imaging of biological samples: localization of peptides and proteins using MALDI-TOF MS. Anal Chem. 1997;69:4751–4760. - PubMed
-
- Takats Z, Wiseman JM, Gologan B, Cooks RG. Mass spectrometry sampling under ambient conditions with desorption electrospray ionization. Science. 2004;306:471–473. - PubMed
-
- Vertes A, Nemes P. Laesi for atmospheric pressure, in vivo and imaging mass spectrometry. 2009. - PubMed
-
- Schwamborn K, Kriegsmann M, Weichert W. MALDI imaging mass spectrometry—from bench to bedside. Biochim Biophys Acta. 2017;1865:776–783. - PubMed
-
- Nilsson A, Goodwin RJ, Shariatgorji M, et al. Mass spectrometry imaging in drug development. Anal Chem. 2015;87:1437–1455. - PubMed
Publication types
MeSH terms
Substances
LinkOut - more resources
Full Text Sources
Other Literature Sources
