

Inter-reader variability of SPECT MPI readings in low- and middle-income countries: Results from the IAEA-MPI Audit Project (I-MAP)
- PMID: 30168029
- PMCID: PMC7174263
- DOI: 10.1007/s12350-018-1407-4
Inter-reader variability of SPECT MPI readings in low- and middle-income countries: Results from the IAEA-MPI Audit Project (I-MAP)
Abstract
Background: Consistency of results between different readers is an important issue in medical imaging, as it affects portability of results between institutions and may affect patient care. The International Atomic Energy Agency (IAEA) in pursuing its mission of fostering peaceful applications of nuclear technologies has supported several training activities in the field of nuclear cardiology (NC) and SPECT myocardial perfusion imaging (MPI) in particular. The aim of this study was to verify the outcome of those activities through an international clinical audit on MPI where participants were requested to report on studies distributed from a core lab.
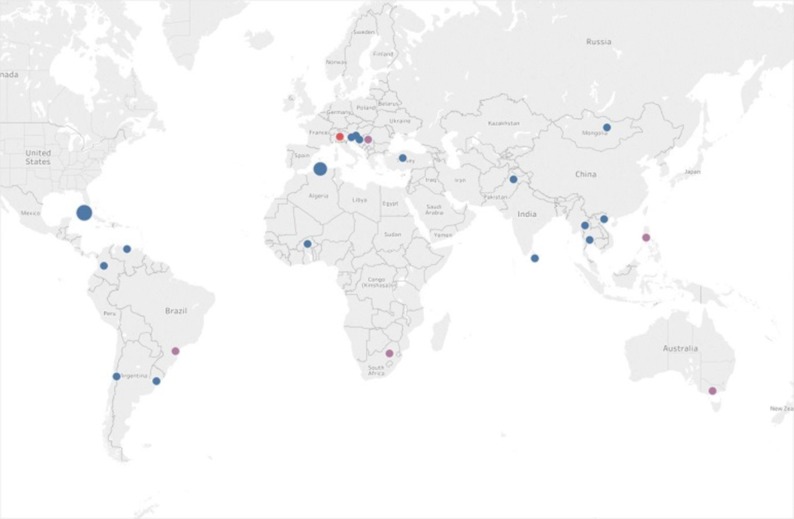
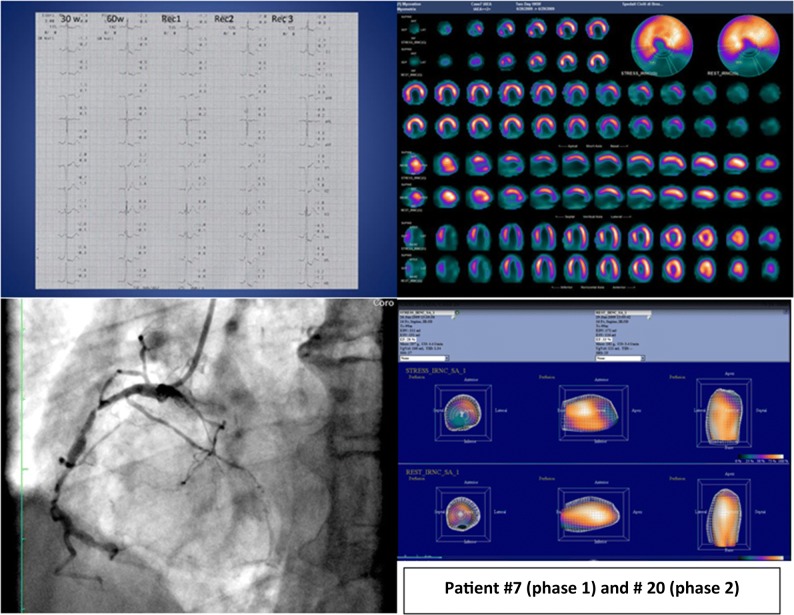
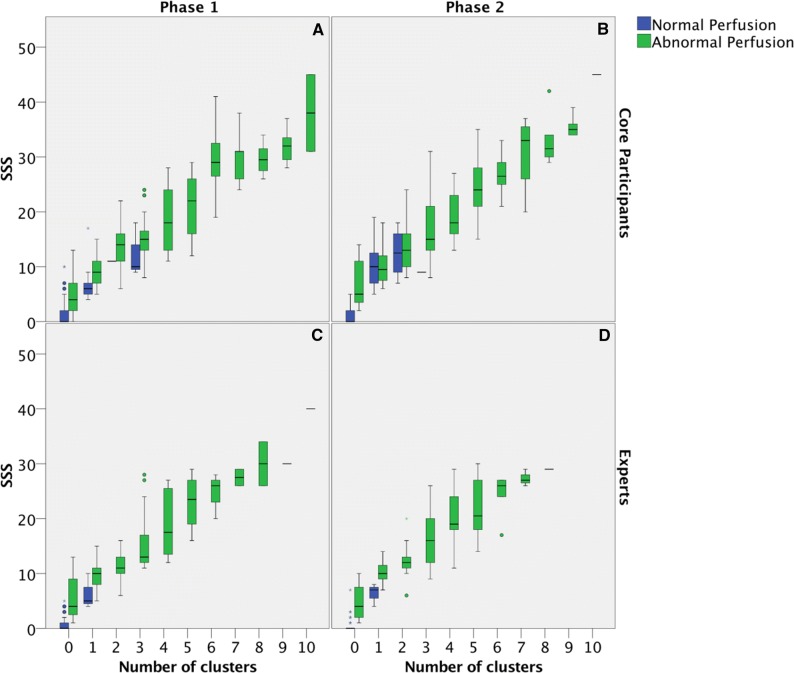
Methods: The study was run in two phases: in phase 1, SPECT MPI studies were distributed as raw data and full processing was requested as per local practice. In phase 2, images from studies pre-processed at the core lab were distributed. Data to be reported included summed stress score (SSS); summed rest score (SRS); summed difference score (SDS); left ventricular (LV) ejection fraction (EF) and end- diastolic volume (EDV). Qualitative appraisals included the assessment of perfusion and presence of ischemia, scar or mixed patterns, presence of transient ischemic dilation (TID), and risk for cardiac events (CE). Twenty-four previous trainees from low- and middle-income countries participated (core participants group) and their results were assessed for inter-observer variability in each of the two phases, and for changes between phases. The same evaluations were performed for a group of eleven international experts (experts group). Results were also compared between the groups.
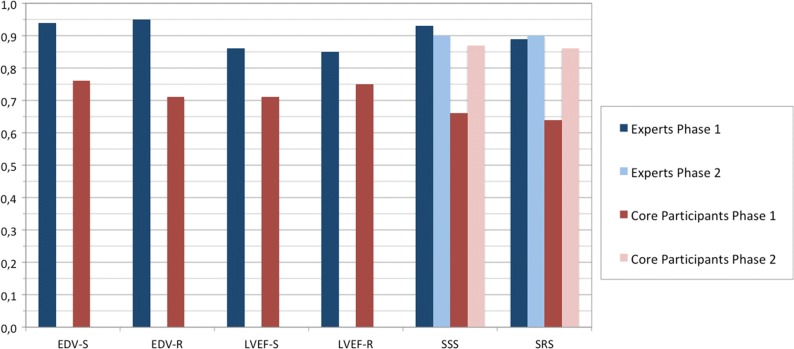
Results: Expert readers showed an excellent level of agreement for all parameters in both phase 1 and 2. For core participants, the concordance of all parameters in phase 1 was rated as good to excellent. Two parameters which were re-evaluated in phase 2, namely SSS and SRS, showed an increased level of concordance, up to excellent in both cases. Reporting of categorical variables by expert readers remained almost unchanged between the two phases, while core participants showed an increase in phase 2. Finally, pooled LVEF values did not show a significant difference between core participants and experts. However, significant differences were found between LVEF values obtained using different software packages for cardiac analysis.
Conclusions: In this study, inter-observer agreement was moderate-to-good for core group readers and good-to-excellent for expert readers. The quality of reporting is affected by the quality of processing. These results confirm the important role of the IAEA training activities in improving imaging in low- and middle-income countries.
Keywords: CAD; Gated SPECT; Image interpretation; Myocardial ischemia and infarction.
Figures

Similar articles
-
Comparative assessment of rest and post-stress left ventricular volumes and left ventricular ejection fraction on gated myocardial perfusion imaging (MPI) and echocardiography in patients with transient ischaemic dilation on adenosine MPI: myocardial stunning or subendocardial hypoperfusion?J Nucl Cardiol. 2012 Aug;19(4):735-42. doi: 10.1007/s12350-012-9571-4. Epub 2012 May 8. J Nucl Cardiol. 2012. PMID: 22565241
-
Left ventricular function in response to dipyridamole stress: head-to-head comparison between 82Rubidium PET and 99mTc-sestamibi SPECT ECG-gated myocardial perfusion imaging.Eur J Nucl Med Mol Imaging. 2017 May;44(5):876-885. doi: 10.1007/s00259-016-3588-x. Epub 2016 Dec 16. Eur J Nucl Med Mol Imaging. 2017. PMID: 27987028
-
Does perfusion pattern influence stress-induced changes in left ventricular mechanical dyssynchrony on thallium-201-gated SPECT myocardial perfusion imaging?J Nucl Cardiol. 2015 Feb;22(1):36-43. doi: 10.1007/s12350-014-9979-0. Epub 2014 Aug 22. J Nucl Cardiol. 2015. PMID: 25145635
-
Advantages and disadvantages of PET and SPECT in a busy clinical practice.J Nucl Cardiol. 2012 Feb;19 Suppl 1:S3-11. doi: 10.1007/s12350-011-9490-9. J Nucl Cardiol. 2012. PMID: 22259006 Review.
-
Quantitative Clinical Nuclear Cardiology, Part 1: Established Applications.J Nucl Cardiol. 2020 Feb;27(1):189-201. doi: 10.1007/s12350-019-01906-6. Epub 2019 Oct 25. J Nucl Cardiol. 2020. PMID: 31654215 Review.
Cited by
-
Head-to-Head Comparison of CZT-SPECT and SPECT/CT Myocardial Perfusion Imaging: Interobserver and Intraobserver Agreement and Diagnostic Performance.Life (Basel). 2023 Sep 7;13(9):1879. doi: 10.3390/life13091879. Life (Basel). 2023. PMID: 37763283 Free PMC article.
-
Best practice for the nuclear medicine technologist in CT-based attenuation correction and calcium score for nuclear cardiology.Eur J Hybrid Imaging. 2020 Jul 6;4(1):11. doi: 10.1186/s41824-020-00080-0. Eur J Hybrid Imaging. 2020. PMID: 34191150 Free PMC article. Review.
-
The QuADRANT study: current status and recommendations for improving uptake and implementation of clinical audit of medical radiological procedures in Europe-the nuclear medicine perspective.Eur J Nucl Med Mol Imaging. 2023 Jul;50(9):2576-2581. doi: 10.1007/s00259-023-06203-6. Eur J Nucl Med Mol Imaging. 2023. PMID: 37162511 Free PMC article. No abstract available.
References
-
- https://www.iaea.org/. Last accessed 22 May 2018.
-
- https://www.iaea.org/about/organizational-structure/department-of-nuclea.... Last accessed 22 May 2018.
-
- https://www.iaea.org/topics/nuclear-medicine-and-diagnostic-imaging-section. Last accessed 22 May 2018.
-
- https://sustainabledevelopment.un.org/sdg3. Last accessed on 08 June 2018.
-
- http://www.who.int/nmh/en/. Last accessed 08 June 2018.
MeSH terms
Substances
LinkOut - more resources
Full Text Sources
Other Literature Sources
Miscellaneous
