. 2019 Jan;160(1):117-135.
doi: 10.1097/j.pain.0000000000001385.

Betulinic acid, derived from the desert lavender Hyptis emoryi, attenuates paclitaxel-, HIV-, and nerve injury-associated peripheral sensory neuropathy via block of N- and T-type calcium channels

Affiliations

Betulinic acid, derived from the desert lavender Hyptis emoryi, attenuates paclitaxel-, HIV-, and nerve injury-associated peripheral sensory neuropathy via block of N- and T-type calcium channels

Shreya S Bellampalli et al. Pain. 2019 Jan.

Abstract

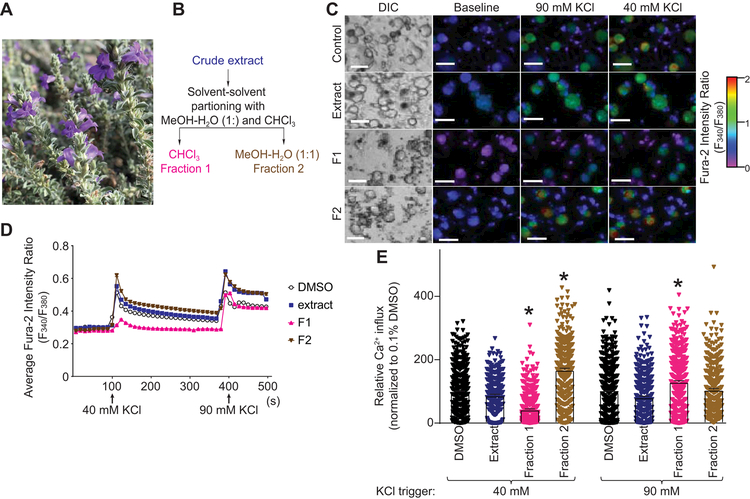
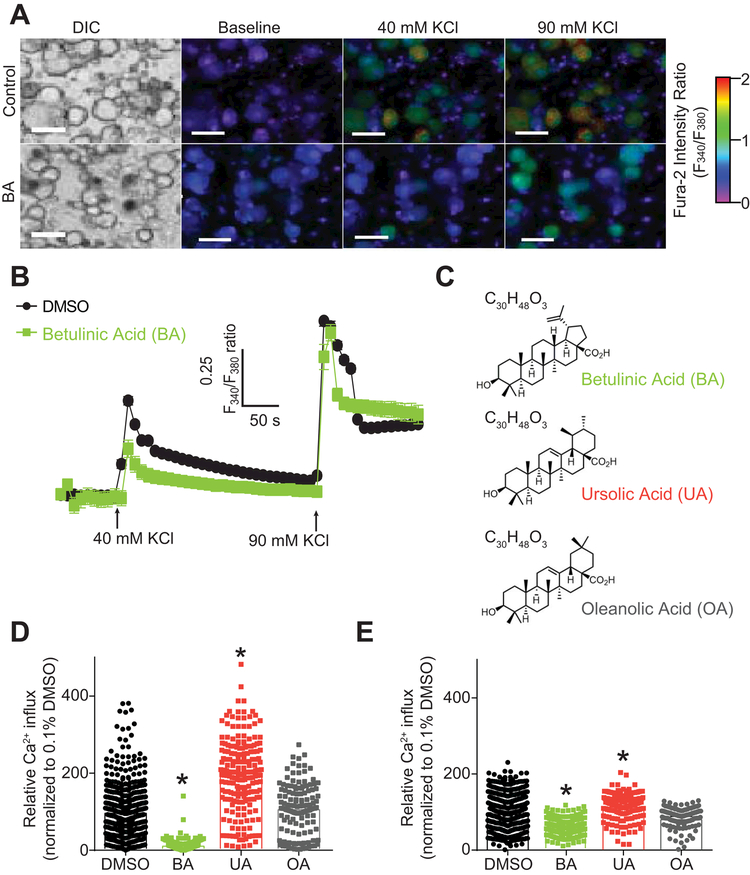
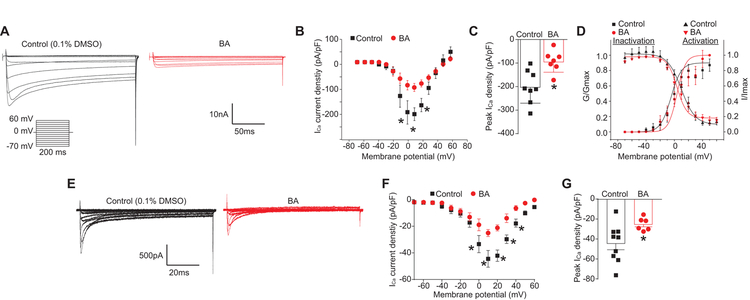
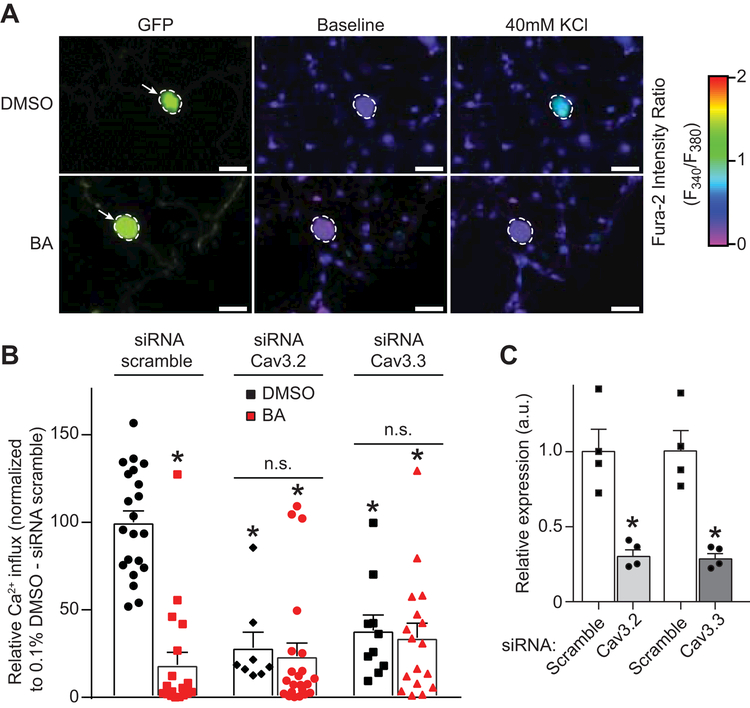
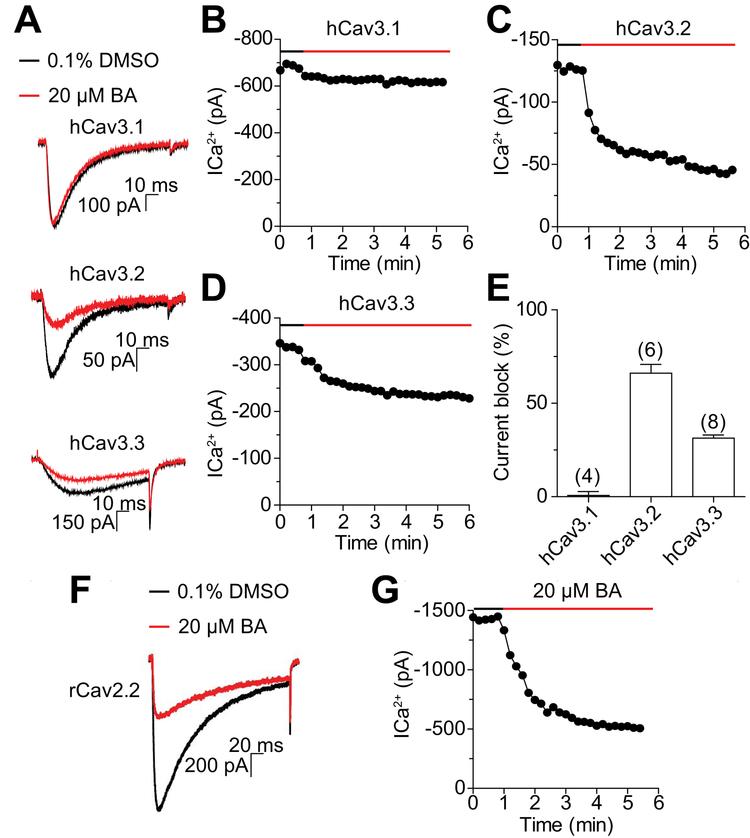
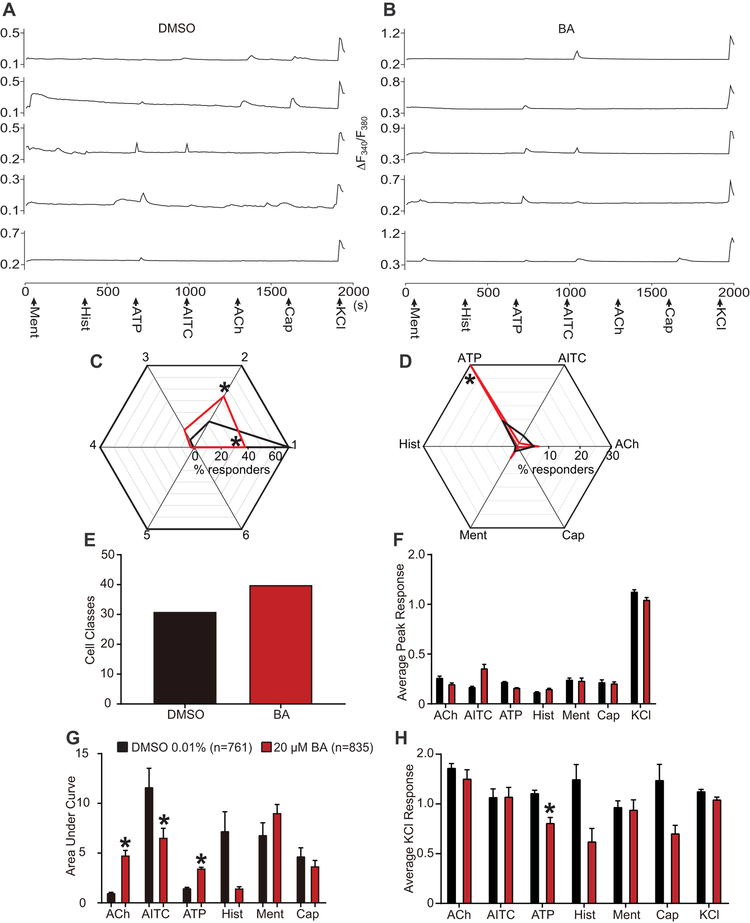
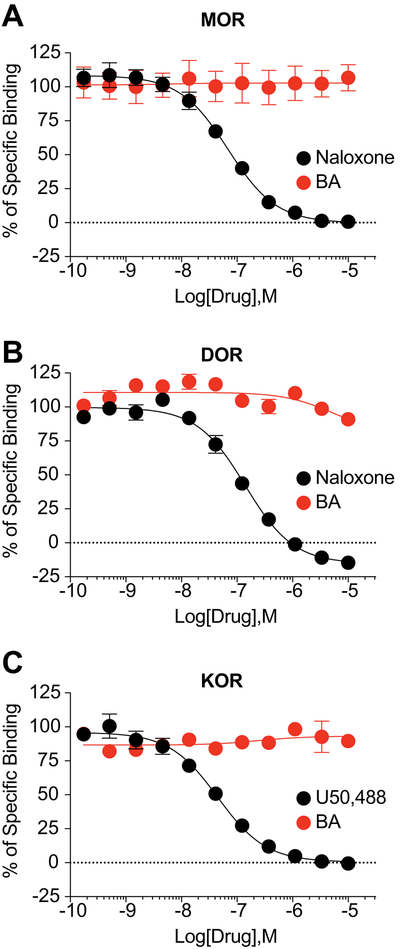
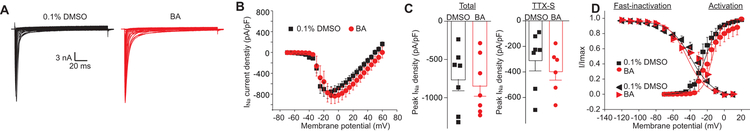
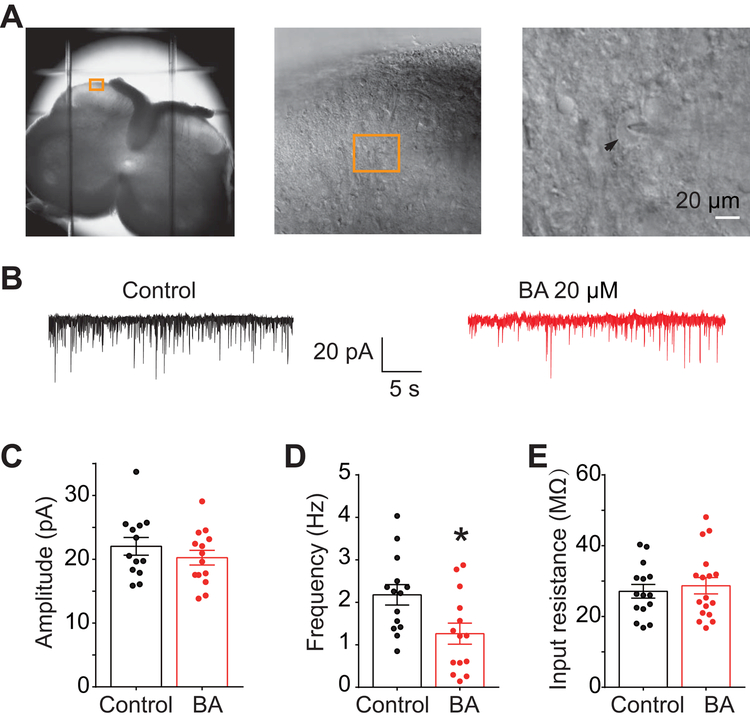
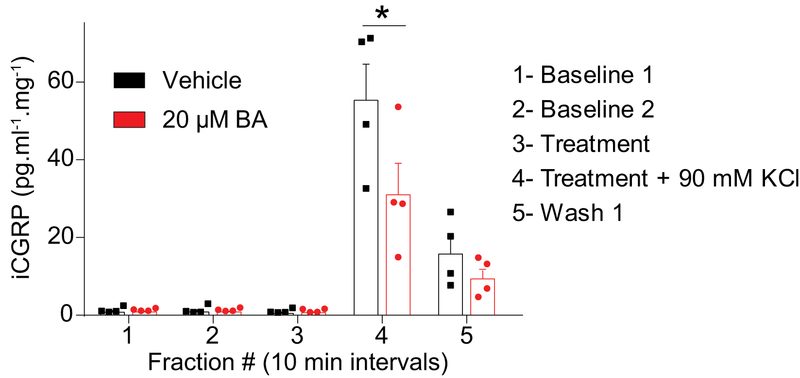
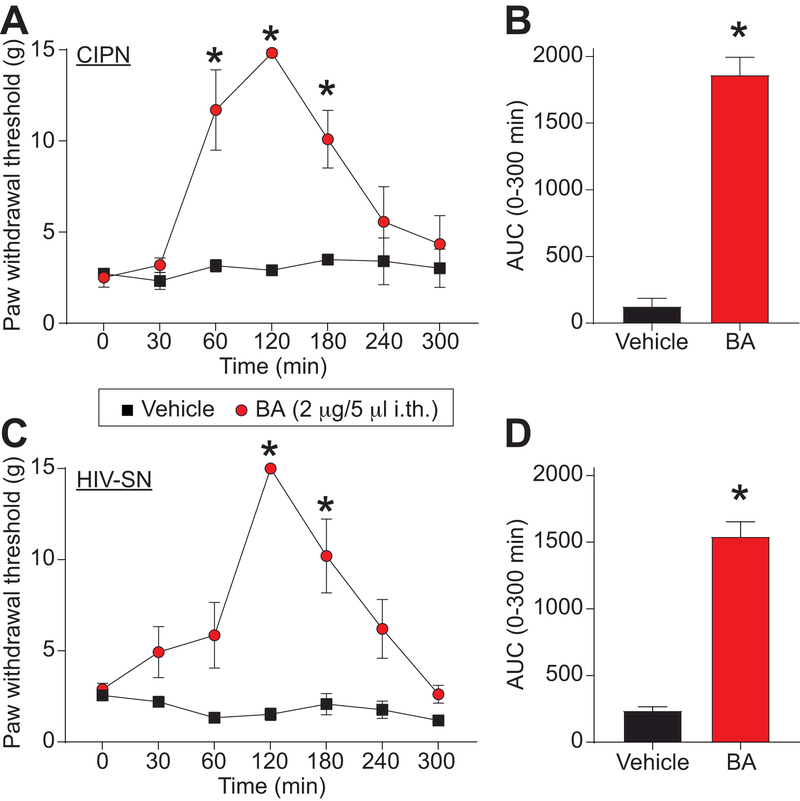
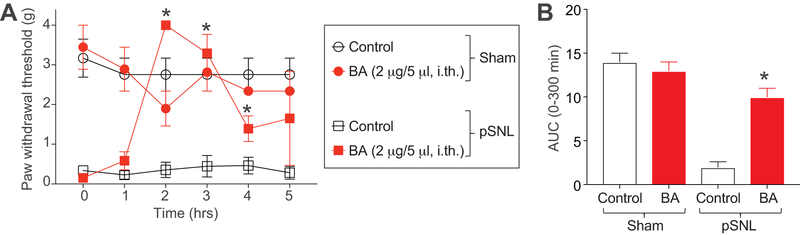
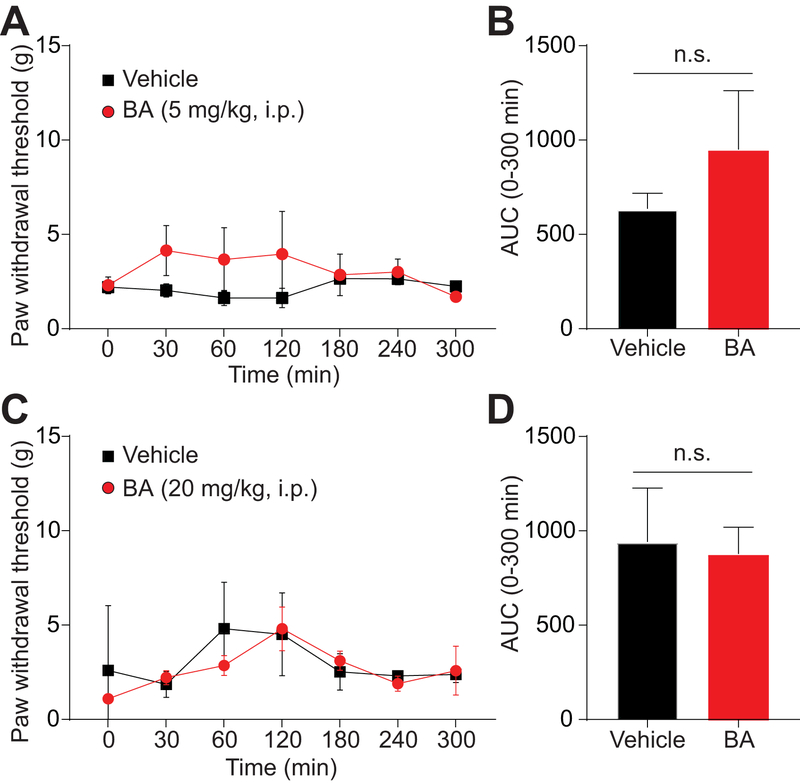
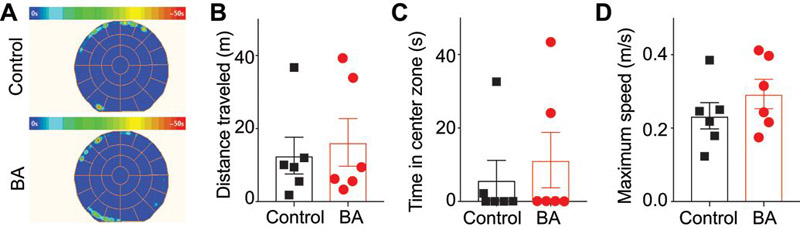
The Federal Pain Research Strategy recommended development of nonopioid analgesics as a top priority in its strategic plan to address the significant public health crisis and individual burden of chronic pain faced by >100 million Americans. Motivated by this challenge, a natural product extracts library was screened and identified a plant extract that targets activity of voltage-gated calcium channels. This profile is of interest as a potential treatment for neuropathic pain. The active extract derived from the desert lavender plant native to southwestern United States, when subjected to bioassay-guided fractionation, afforded 3 compounds identified as pentacyclic triterpenoids, betulinic acid (BA), oleanolic acid, and ursolic acid. Betulinic acid inhibited depolarization-evoked calcium influx in dorsal root ganglion (DRG) neurons predominantly through targeting low-voltage-gated (Cav3 or T-type) and CaV2.2 (N-type) calcium channels. Voltage-clamp electrophysiology experiments revealed a reduction of Ca, but not Na, currents in sensory neurons after BA exposure. Betulinic acid inhibited spontaneous excitatory postsynaptic currents and depolarization-evoked release of calcitonin gene-related peptide from lumbar spinal cord slices. Notably, BA did not engage human mu, delta, or kappa opioid receptors. Intrathecal administration of BA reversed mechanical allodynia in rat models of chemotherapy-induced peripheral neuropathy and HIV-associated peripheral sensory neuropathy as well as a mouse model of partial sciatic nerve ligation without effects on locomotion. The broad-spectrum biological and medicinal properties reported, including anti-HIV and anticancer activities of BA and its derivatives, position this plant-derived small molecule natural product as a potential nonopioid therapy for management of chronic pain.


Conflict of interest statement

Conflict of interest – There is no conflict of interest for any of the authors.

Figures

Figure 1.
Figure 1.. Fractionation of Hyptis emoryi (H. emoryi) extract and the effect of the extract and its fractions on depolarization-evoked Ca2+ influx in DRG sensory neurons.
(A) Photograph of the plant, H. emoryi used in this study. (B) Fractionation of H. emoryi yielding fractions F1 and F2. (C) Differential interference contrast (DIC) and pseudocolored fluorescent images visualized for Fura2-AM in Dorsal Root Ganglia (DRG) neurons. Neurons were sequentially stimulated with 40 mM and 90 mM KCl for a period of 15 seconds following an initial 1-minute baseline measurement, and response was measured for 3 minutes after each challenge. Scale bar is 20 µm. Fluorescence scale indicates Fura-2AM ratio-metric fluorescence value (F340/F380). High values correspond to high intracellular [Ca2+] indicated in red. (D) Traces of response average of >300 neurons treated with H. emoryi extract (440 µg.ml−1) or its fractions F1and F2 (88.4 µg.ml−1). Arrows indicate the beginning of a 15-second stimulation period with 40 or 90 mM KCl as stated. (E) Peak calcium responses of sensory neurons incubated overnight with H. emoryi extract, derived fractions F1 and F2, and 0.1% DMSO (vehicle) in response to 40 and 90 mM KCl (n= 271–518 neurons). Responses were normalized to that of the vehicle and show average response ± S.E.M. Asterisks indicate statistical significance compared with cells treated with the vehicle (p<0.05, one-way ANOVA with Dunnett’s post-hoc test).
Figure 2.
Figure 2.. BA inhibits depolarization-evoked Ca2 influx in DRG sensory neurons.
(A) Differential interference contrast (DIC) and pseudocolored fluorescent images visualized for Fura2-AM before and after stimulations with 40 mM and 90 mM KCl. A stimulation period of 15 seconds each with 40 and 90 mM KCl followed an initial 1-minute baseline measurement; response was subsequently measured for 3 minutes after each stimulation. Scale bar is 20 µm. Fluorescent scale shows relative intracellular calcium [Ca2+] in each Dorsal Root Ganglia (DRG) neuron (F340/F380). (B) Traces of response average of compounds BA, UA, OA and vehicle (0.1% DMSO). Arrows indicate the initiation of a 15 second stimulation period of the DRG sensory neurons with 40 or 90 mM KCl as indicated. (C) Structures and molecular formulas of compounds BA, UA, and OA. (D-E) Bar graphs show normalized peak calcium response average ± S.E.M. of DRG sensory neurons incubated overnight with a 20 µM concentration of compounds BA, UA, OA and vehicle in response to 40 (D) and 90mM KCl (E). Responses were normalized to that of the DMSO. Asterisks indicate statistical significance compared with cells treated with the vehicle (p<0.05, one-way ANOVA with Dunnett’s post-hoc test).
Figure 3.
Figure 3.. BA diminishes Ca2+ currents in DRG sensory neurons.
(A) Representative traces of Ca2+ currents evoked from 200 millisecond prepulses between −70 mV and +60 mV, illustrated from DRG sensory neurons treated with 0.1% DMSO or 20 µM of BA. (B) Summary of the normalized (pA/pF) calcium current density and (C) bar graph showing peak Ca2+ current density at +10 mV (mean ± s.e.m.) from DRG sensory neurons treated with 0.1% DMSO (vehicle) or 20 µM of BA as indicated (n = 10 cells per condition). Asterisks indicate statistical significance compared with cells treated with 0.1% DMSO (*p<0.05, unpaired 2-tailed t test). (D) Boltzmann fits for normalized conductance G/Gmax-voltage relations for voltage dependent inactivation and activation of sensory neurons treated with vehicle or a 20 µM concentration of BA as indicated. (E) Representative traces of T-type Ca2+ currents, evoked from 200 millisecond prepulses between −60 mV and +60 mV, from DRG sensory neurons treated with 0.1% DMSO (black) or 20 µM BA (red). T-type currents were pharmacologically isolated using blockers of all other channels (see Methods). (F) Summary of the normalized (pA/pF) T-type calcium current density versus voltage and peak Ca2+ current density at +10 mV (mean ± s.e.m.) (G) from DRG neurons treated with 0.1% DMSO (vehicle, n=9) or 20 µM BA (n=6). Asterisks indicate statistical significance compared with cells treated with 0.1% DMSO (*p<0.05, unpaired 2-tailed t test).
Figure 4.
Figure 4.. Downregulation of Cav3.2 and Cav3.3 channels blocks BA-mediated inhibition of depolarization-evoked Ca2 influx through T-type Ca2+ Channels.
Dorsal root ganglion neurons were transfected during plating with a GFP construct and a scramble siRNA or with siRNAs against Cav3.2 or Cav3.3. A representative experiment (bright field with GFP fluorescence (left panels), and pseudocolored fluorescent images visualized for Fura2-AM before (middle panels) and after stimulations with 40 mM KCl (right panels). In this experiment, vehicle (DMSO)-treated neurons with GFP responds to KCl, whereas BA-treated neuron with GFP fluorescence demonstrates significantly decreased response. (B) Bar graph shows peak calcium response averages ± S.E.M. of DRG sensory neurons treated as indicated. Responses were normalized to that of DMSO (vehicle) in the siRNA scramble condition. Statistical significance compared to vehicle-treated cells is indicated via asterisks (p<0.05, 2-way ANOVA with Sidak’s post hoc test) (n = 8–22 cells per condition). (C) Bar graph showing quantitative RT–PCR analysis of Cav3.2 and Cav3.3 transcripts in DRGs treated with scramble, Cav3.2 or Cav3.3 siRNAs. (n=3). mean ± s.e.m., *p<0.05 Mann-Whitney test. These experiments were done in a blinded fashion.
Figure 5.
Figure 5.. BA inhibits T- and N-type currents in heterologous cells.
(A) Representative traces before (black) and after (red) application of 20 µM BA. Currents were evoked from −100 to −30 mV for 100ms. Top hCav3.1, middle hCav3.2 and bottom hCav3.3. Representative example of time course of BA-mediated inhibition of hCav3.1 (B), hCav3.2 (C), and hCav3.3 (D). (E) Effect of BA on current amplitude of transiently expressed hCav3.1, hCav3.2 and hCav3.3 channels. (F) Representative traces before (black) and after (red) application of 20 µM BA. Currents were evoked from −100 to +10 mV for 250 ms in cells (n=4) expressing rCav2.2. (G) Representative example of time course of BA-mediated inhibition of rCav2.2. Data are presented as mean ± s.e.m. Number of cells are shown in parentheses.
Figure 6.
Figure 6.. Functional ‘fingerprinting’ of DRG neuronal subclasses following treatment with BA.
Representative traces of sensory neurons treated with 0.1% DMSO (vehicle). (A) or BA (20µM) (B) responding to constellation pharmacology triggers (menthol (400 nM), histamine (50 µM), ATP (10 µM), AITC (200 µM), acetylcholine (1 mM), capsaicin (100 nM) and KCl (90 mM)) during Ca2+ imaging. Each trace represents an individual neuron; a typical experimental trial records the responses of >200 neurons concurrently. The x-axis represents time in seconds, the y-axis shows the relative intracellular calcium [Ca2+] in each DRG neurons (i.e. the F340/F380 ratio). (C) Percentage of DRG sensory neurons that responded to indicated number of triggers. “0” indicates those neurons that only responded to none other than KCl stimulus. (D) Percentage of sensory neurons responding to major classes of constellation triggers. (E) Number of overall functional DRG sensory neuronal classes as a result of treatment with vehicle or BA (20 µM). Average peak response (F) and area under the curve (G) is shown for calcium response in sensory neurons post-indicated treatment, after stimulation by major classes of constellation triggers. Area under the curve was calculated with Graphpad Prism software using the trapezoid rule. (H) Average peak KCl-evoked response of sensory neurons post-indicated treatment. Statistical significance compared with cells treated with 0.1% DMSO are indicated by asterisks (*p<0.05; Student’s t-test). Abbreviations for constellation triggers are as follows: ACh = acetylcholine; AITC = allyl isothiocyanate; ATP = adenosine triphosphate; Hist = histamine; Ment = menthol; Cap = capsaicin; KCl = potassium chloride. Data was acquired from a total of 3 independent experiments with an overall n of 761 (from 4 coverslips) for vehicle (0.1% DMSO) and 835 (from 3 coverslips) for BA (20 µM).
Figure 7.
Figure 7.. BA does not bind to the opioid receptors.
Competition radioligand binding was performed in CHO cells expressing the human MOR, DOR, or KOR (see Methods for details). BA or a positive control compound was competed against 3H-diprenorphine in all 3 cell lines. Curves reported as the mean ± SEM of the mean value from each individual experiment in n = 3 independent experiments. The KI also reported as the mean ± SEM of the individual value from each of n = 3 independent experiments. BA did not produce competition binding up to 10 μM in any cell line. (A) MOR: Naloxone KI = 33.9 ± 1.7 nM. (B) DOR: Naloxone KI = 55.7 ± 6.7 nM. (C) KOR: U50,488 KI = 22.4 ± 4.1 nM.
Figure 8.
Figure 8.. Treatment with BA does not affect Na+ currents in DRG sensory neurons.
(A) Representative traces of Na + currents evoked from 200 millisecond prepulses between −70 mV and +60 mV with voltage protocol, illustrated from DRG sensory neurons treated with 0.1% DMSO or 20 µM BA. (B) Normalized current (pA/pF) versus voltage relationship of the sodium current density. (C) Scatter graph showing total peak Na+ current density at −10 mV (left bars) and TTX-sensitive Na+ current (right bars) (mean ± s.e.m.) from DRG sensory neurons treated with 0.1% DMSO (vehicle) or 20 µM BA (n = 8 cells per condition). No statistical significance was detected compared with cells treated with 0.1% DMSO (p>0.05, Mann-Whitney test). (D) Boltzmann fits for normalized conductance G/Gmax-voltage relations for voltage dependent fast-inactivation and activation of sensory neurons treated with vehicle or a 20 µM BA.
Figure 9.
Figure 9.. Betulinic acid decreases spontaneous excitatory post-synaptic current in substantia gelatinosa neurons.
(A) Anatomy and location of neurons with rat slices used for electrophysiology patch-clamp recordings. Arrow indicates the cell being patched (shadow of the pipette is also seen atop the cell). (B) Representative traces recorded from control (0.1% DMSO) and BA (20 µM)-treated groups. (C) Spontaneous EPSC amplitude as a result of treatment with DMSO or BA. (D) Spontaneous EPSC frequency as a result of treatment with DMSO or BA. (E) Input resistance of neurons recorded from both groups. Asterisks indicate significance compared with cells (n=13–14 per condition) treated with 0.1% DMSO (*p<0.05, unpaired 2-tailed t test).
Figure 10.
Figure 10.. CGRP release from spinal cord is inhibited by BA.
KCl (90 mM) depolarization-evoked CGRP release was measured from spinal cord tissue isolated from naïve adult rats as a result of pre- and co-incubation with 0.1% DMSO or 20 µM BA as indicated. Bar graph shows immunoreactive CGRP levels observed in bath solution normalized to the weight of each spinal cord tissue. Statistical significance is indicated by asterisks for fraction 4 (*p<0.05; 2-way ANOVA with Sidak’s post hoc test) in comparison with control treatment.
Figure 11.
Figure 11.. BA reduces paclitaxel-induced and gp120-induced mechanical allodynia.
(A) Paw withdrawal threshold of adult male rats (n=6) was measured 15 days after 4 intraperitoneal injections of paclitaxel. Rats were treated intrathecally (i.th.) with saline (vehicle) or BA (2 µg/5 μL) as indicated. Asterisks indicate statistical significance compared with tissue treated with saline (*p<0.05; 2-way ANOVA with a Student-Neuman–Kuels post hoc test). (B) Area under the curve was derived again as indicated before using Graphpad Prism. Statistical significance is indicated by asterisks (*p<0.05, Mann-Whitney test) in comparison to vehicle-treated rats. (C) Paw withdrawal threshold of adult male rats (n=6) was measured 15 days after 3 intrathecal injections of glycoprotein-120. Rats were treated with saline (vehicle) or BA (20μM) as indicated. Asterisks indicate statistical significance compared with tissue treated with saline (*p<0.05; 2-way ANOVA with a Student-Neuman–Kuels post hoc test). (D) Area under the curve was derived as indicated before using Graphpad Prism. Statistical significance is indicated by asterisks (*p<0.05, Mann-Whitney test) in comparison to vehicle-treated rats. Chemotherapy induced peripheral neuropathy (CIPN); HIV-induced sensory neuropathy (HIV-SN).
Figure 12.
Figure 12.. BA reduces pSNL-induced mechanical allodynia.
(A) Paw withdrawal threshold of adult female mice (n=3–4) was measured 7 days after pSNL or sham surgery as indicated. Mice were intrathecally (via lumbar puncture) treated with saline (vehicle) or BA (2 µg/5 μL, i.th.) as indicated. Asterisks indicate statistical significance compared with mice treated with saline (*p<0.05; 2-way ANOVA with a Student-Neuman–Kuels post hoc test). (B) Area under the curve was derived again as indicated before using Graphpad Prism. Statistical significance is indicated by asterisks (*p<0.05, Mann-Whitney test) in comparison to vehicle-treated rats.
Figure 13.
Figure 13.. Systemic BA administration does not reverse paclitaxel-induced mechanical allodynia.
Paw withdrawal threshold of adult male rats (n=6) was measured 15 days after 4 intraperitoneal injections of paclitaxel. Rats were treated intraperitoneally (i.p.) with saline (vehicle) or two doses of BA (5 (A, B) or 20 mg/kg (C, D)). Time course and AUC are shown. No statistical significance was seen with BA (p>0.05; 2-way ANOVA with a Student-Neuman–Kuels post hoc test).
Figure 14.
Figure 14.. BA does not affect anxiety, locomotion, or exploratory behaviors of paclitaxel-treated rats.
(A) Average heat maps of animals’ position for animals (n=6) treated with 0.1% DMSO (top) or BA (2 µg/5 μL) (bottom). Scatter plots of total distance traveled as a result of treatment with DMSO or BA (p=0.9372 Mann-Whitney test) (B), time in center zone as a result of treatment with DMSO or BA (p=0.8485, Mann-Whitney test) (C), and maximum speed of animals as a result of treatment with DMSO or BA (p=0.4848, Mann-Whitney test) (D). There were no statistical differences between the two conditions for any of the parameters tested.

References

    1. Ahangarpour A, Oroojan AA, Khorsandi L, Shabani R, Mojaddami S. Preventive effects of betulinic acid on streptozotocinnicotinamide induced diabetic nephropathy in male mouse. Journal of nephropathology 2016;5(4):128–133. - PMC - PubMed
    1. Barsa JA, Sauders JC. Amitriptyline (Elavil), a new antidepressant. Am J Psychiatry 1961;117:739–740. - PubMed
    1. Benyamin R, Trescot AM, Datta S, Buenaventura R, Adlaka R, Sehgal N, Glaser SE, Vallejo R. Opioid complications and side effects. Pain physician 2008;11(2 Suppl):S105–120. - PubMed
    1. Bernal Sierra YA, Haseleu J, Kozlenkov A, Begay V, Lewin GR. Genetic Tracing of Cav3.2 T-Type Calcium Channel Expression in the Peripheral Nervous System. Frontiers in molecular neuroscience 2017;10:70. - PMC - PubMed
    1. Bildziukevich U, Rarova L, Saman D, Wimmer Z. Picolyl amides of betulinic acid as antitumor agents causing tumor cell apoptosis. European journal of medicinal chemistry 2018;145:41–50. - PubMed

MeSH terms