. 2019 May/Jun;40(3):577-591.
doi: 10.1097/AUD.0000000000000630.

Residual Cochlear Function in Adults and Children Receiving Cochlear Implants: Correlations With Speech Perception Outcomes

Affiliations

Residual Cochlear Function in Adults and Children Receiving Cochlear Implants: Correlations With Speech Perception Outcomes

Tatyana Elizabeth Fontenot et al. Ear Hear. 2019 May/Jun.

Erratum in

Abstract

Objectives: Variability in speech perception outcomes with cochlear implants remains largely unexplained. Recently, electrocochleography, or measurements of cochlear potentials in response to sound, has been used to assess residual cochlear function at the time of implantation. Our objective was to characterize the potentials recorded preimplantation in subjects of all ages, and evaluate the relationship between the responses, including a subjective estimate of neural activity, and speech perception outcomes.

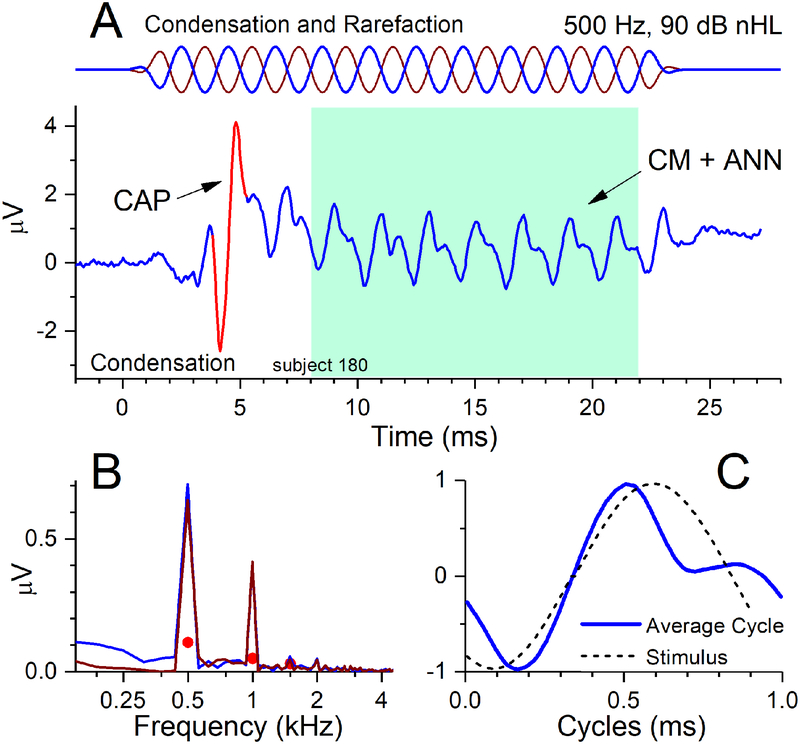
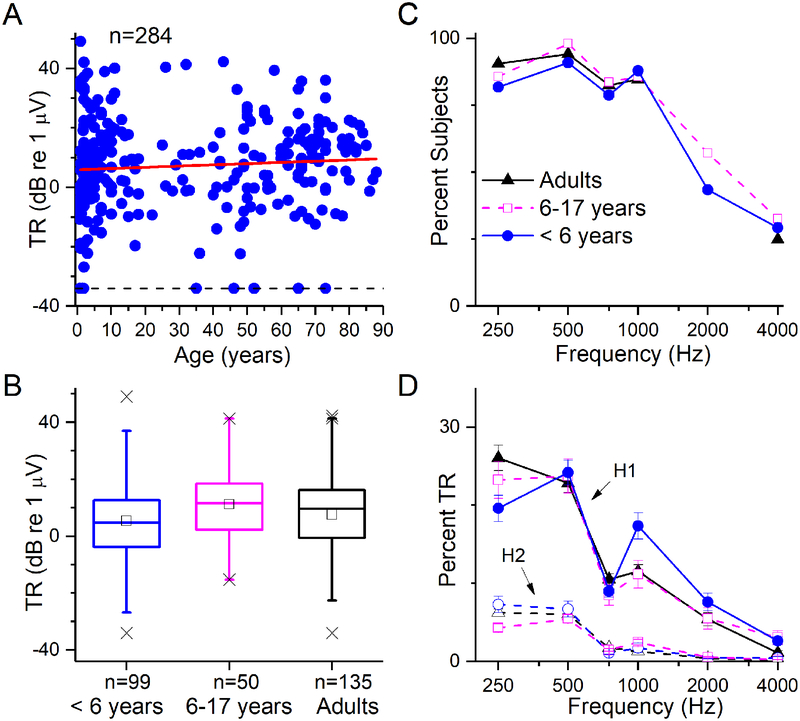
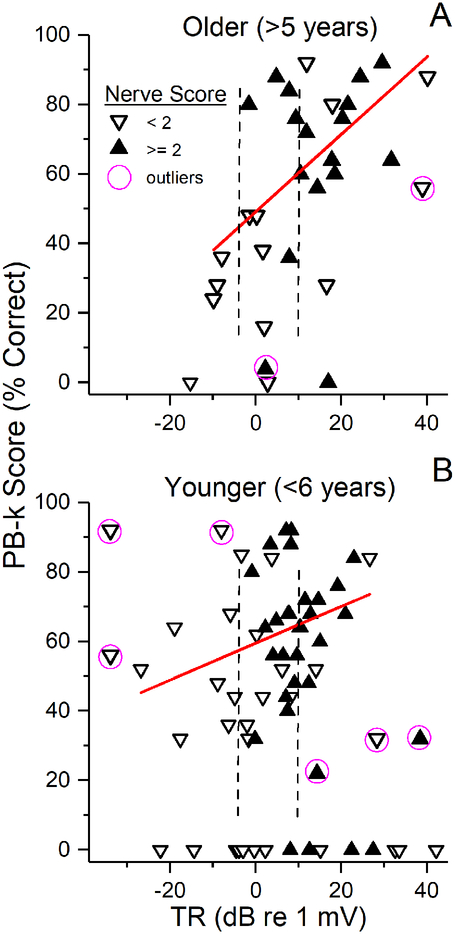
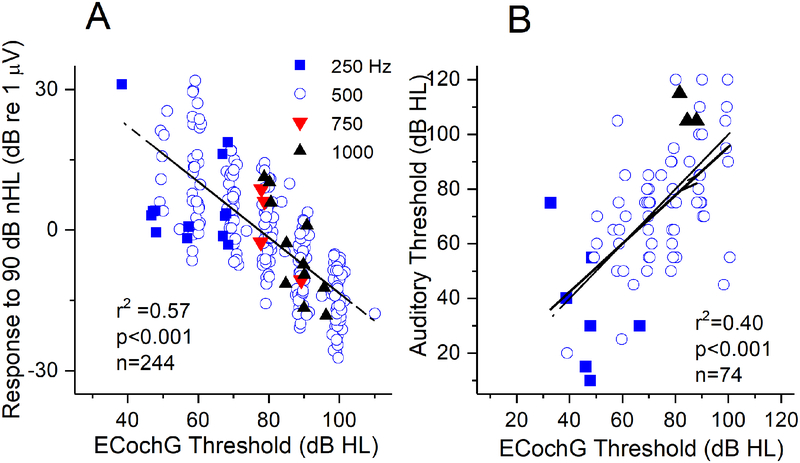
Design: Electrocochleography was recorded in a prospective cohort of 284 candidates for cochlear implant at University of North Carolina (10 months to 88 years of ages). Measurement of residual cochlear function called the "total response" (TR), which is the sum of magnitudes of spectral components in response to tones of different stimulus frequencies, was obtained for each subject. The TR was then related to results on age-appropriate monosyllabic word score tests presented in quiet. In addition to the TR, the electrocochleography results were also assessed for neural activity in the forms of the compound action potential and auditory nerve neurophonic.

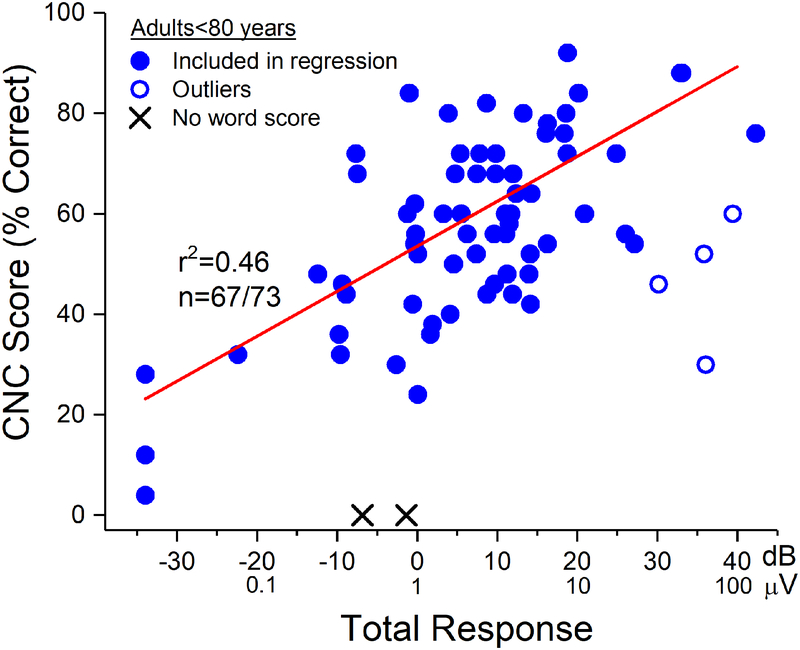
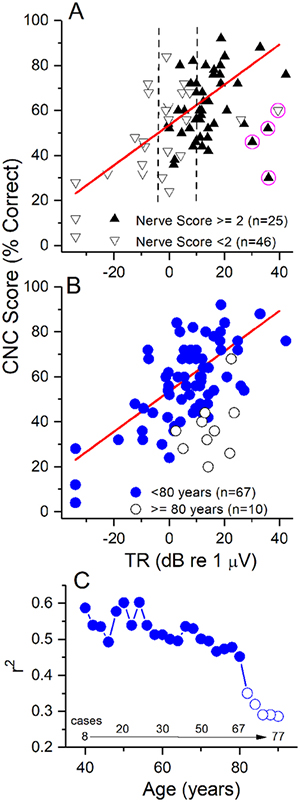
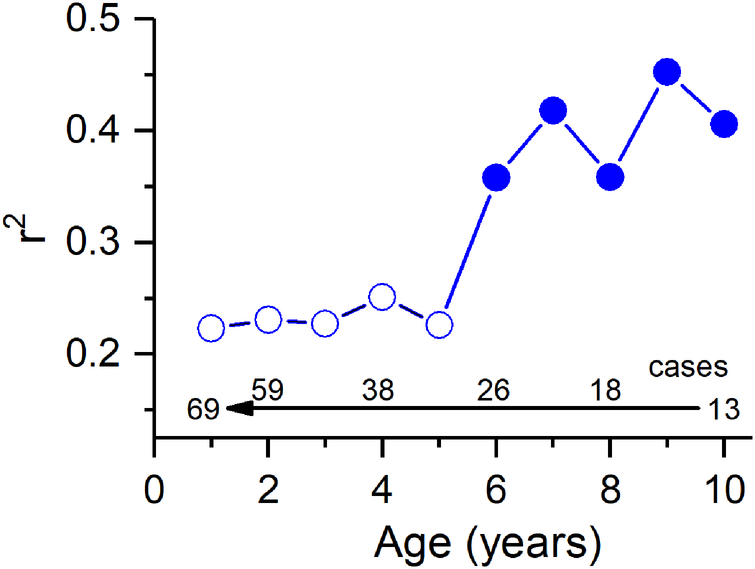
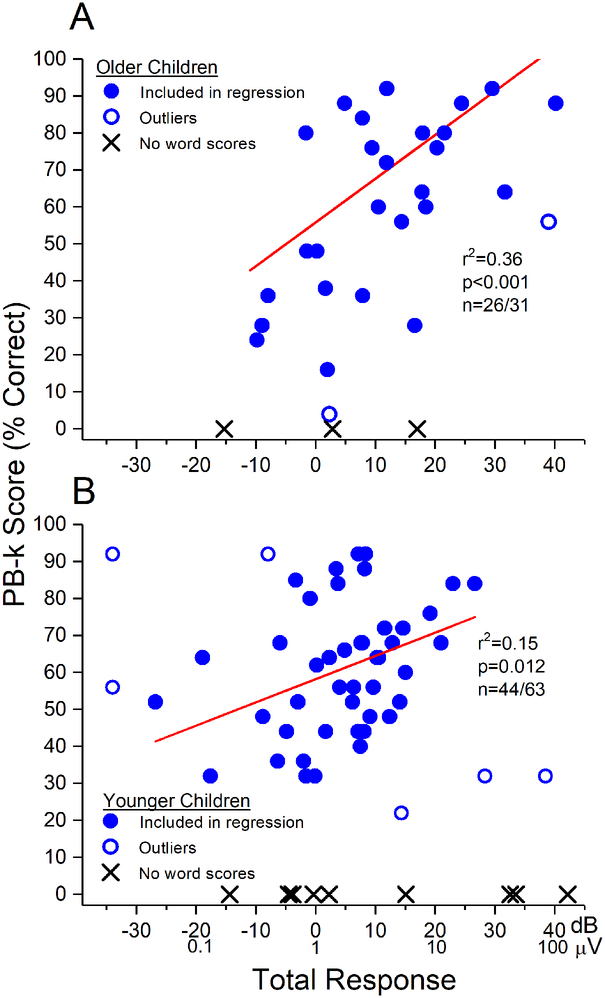
Results: The TR magnitude ranged from a barely detectable response of about 0.02 µV to more than 100 µV. In adults (18 to 79 years old), the TR accounted for 46% of variability in speech perception outcome by linear regression (r = 0.46; p < 0.001). In children between 6 and 17 years old, the variability accounted for was 36% (p < 0.001). In younger children, the TR accounted for less of the variability, 15% (p = 0.012). Subjects over 80 years old tended to perform worse for a given TR than younger adults at the 6-month testing interval. The subjectively assessed neural activity did not increase the information compared with the TR alone, which is primarily composed of the cochlear microphonic produced by hair cells.

Conclusions: The status of the auditory periphery, particularly of hair cells rather than neural activity, accounts for a large fraction of variability in speech perception outcomes in adults and older children. In younger children, the relationship is weaker, and the elderly differ from other adults. This simple measurement can be applied with high throughput so that peripheral status can be assessed to help manage patient expectations, create individually-tailored treatment plans, and identify subjects performing below expectations based on residual cochlear function.


Conflict of interest statement

Conflicts of Interest and Source of Funding

Dr. Fitzpatrick, Dr. Adunka, Dr. Buchman, Dr. Teagle, Dr. Pillsbury and Dr. Brown have consulting arrangements and research projects with MED-EL, Cochlear Corp and Advanced Bionics. This project was funded by NIH through NIDCD (5T32DC005360-12 and 1-F30-DC-015168-01A1) and by a research contract with MED-EL Corporation.

Figures

Figure 1.
Figure 1.
Example of an ECochG response to a 500 Hz tone burst at 90 dB nHL. (A) The stimulus (top) was presented in alternating condensation and rarefaction phases. The time waveform shows a CAP (arrow) to the stimulus onset and the ongoing response to the tone (shaded box). To the extent the cochlea retains neural responses to sound this ongoing portion can contain an ANN in addition the CM (see text). This case contained an ANN, as indicated by the spectral and temporal response patterns. (B) The spectral pattern shows peaks above the level of significance (filled circles) to harmonics 1–3 (500, 1000 and 1500 Hz). While the CM and ANN both produce even and odd harmonics, such a large second harmonic is indicative of neural activity. (C) The temporal pattern is shown as an ‘average cycle’ (solid line) that was obtained by averaging each cycle of the ongoing response. A representation of the stimulus (dashed line) is shown for comparison, after being shifted in phase to the point where the correlation between stimulus and response was maximal. The distortion in the average cycle is not consistent with those produced by the CM due to saturation (see text), and is thus affected by the ANN.
Figure 2.
Figure 2.
Distributions of ECochG responses. (A) TR as a function of age. The TR spanned a wide range for all age groups, from infants to the elderly. The regression line (red) showed no significant trend with age (r2=0.006, p=0.19). (B) Boxplot of TR distribution by age group. Bars represent median values, squares are the means, boxes are the semi-interquartile range, whiskers are to 99% of the distributions and X’s are the maximum and minimum values and values outside 99%. There was a small but significant (see text) trend between the groups for the youngest children to have a smaller TR (C) Proportion of the subject population in each age group with a significant response to each of the tested frequencies. A high proportion of subjects had responses from 250–1000 Hz, and lower proportions for 2000 and 4000 Hz. (D) The percent of the TR contributed by each frequency for the first (solid lines) and second (dashed lines) harmonics (H1 and H2). The HI contributed a larger fraction than the H2 across all frequencies, and both the H1 and H2 were larger for 250 and 500 Hz than the other frequencies. Although not a clean separation, the CM is primarily in H1, and the ANN, if present, will increase the H2. Thus, the CM appeared to be the largest fraction of the response, even to the lowest frequencies where the ANN would be expected to be the largest. To compute these percentages, the magnitude at each frequency was divided by the TR and multiplied by 100 to produce a percentage; results shown are the means and standard errors of these percentages across all cases, with −34 dB (0.02 uV) inserted for all cases without a significant response (proportion with no response was the data shown in C subtracted from 100).
Figure 3.
Figure 3.
TR vs. CNC word score results at 6 months post-activation in adult CI subjects <80 years old. The regression data shown is based on the group of subjects indicated by the filled circles. The outliers (open circles) had lower CNC scores (poorer performance) than their TRs would indicate. Two subjects did not reach open-set speech perception testing at 6 months after the CI was activated (X symbols).
Figure 4.
Figure 4.
Inclusion of nerve scores and the elderly. (A) Nerve scores. Cases with poor nerve scores (down triangles) were those with no evidence of ANN or CAP (nerve score=0), to one or the other being present but not prominent (nerve score =1). Cases with good nerve scores (up triangles were those where the CAP and ANN were present but not prominent, or one or the other was present and prominent (nerve score =2); to those where both were present and one was prominent (nerve score =3) to those where both were prominent (nerve score =4). Data is the same as in Fig. 3. Most case with large TRs (> 10 dB or 3.16 μV, right dashed line) had good nerve scores, while most cases with smalls with TRs (<−6 dB, or 0.5 uV) had poor nerve scores (down triangles). Cases in-between were mixed, but with no systematic distribution indicating poor nerve scores were associated with worse word score outcomes. (B) Addition of cases 80 years and older. For the younger adults only those cases included in the regression from Fig. 3are shown. Subjects 80 years and older generally had lower speech perceptions scores for a given TR, although there was overlap with the younger group. (C). A cumulative regression function where subjects with increasingly older ages were progressively added and the r2 recalculated. The r2 was >0.45 and relatively stable until subjects ≥80 years old were included, at which point it abruptly declined, ending at <0.3.
Figure 5.
Figure 5.
A cumulative regression function where subjects with younger ages were progressively added and the r2 recalculated. For ages 6–18 years the r2 was above about 0.35, while inclusion of children younger than 6 caused a sharp decrease. As with the adults, this cohort excluded outliers and those who did not achieve word scores (see Fig. 6).
Figure 6.
Figure 6.
TR vs. PB-k word score in pediatric subjects. (A) Subjects 6 years and older. (B) Subjects younger than 6 years. In both groups the regression lines include the cases with the filled circles. The r2 for the regression was 0.36, but fell to 0.15 in the younger children. Both populations had outliers with word score outcomes lower than expected from their TR, similar to those identified in the adult population. An additional type of outlier was seen in the younger children where the TR was small or absent but the word score outcomes high or fairly high. There were many more cases with no word score results in the younger children compared to the older children or adults.
Figure 7.
Figure 7.
Inclusion of nerve scores in children. (A) Subjects 6 years and older. (B) Subjects younger than 6 years. As with adults, most case with large TRs (> 10 dB or about 3 μV, dotted line) showed a good nerve score, while cases with TR just below 10 dB were mixed, and cases below about 0 dB (1) all had only sinusoidal responses indicative of CM with no CAP; i.e., were poor nerve. Unlike adults, case with no word scores often had TRs large enough for neural activity to be evaluated.
Figure 8.
Figure 8.
Threshold evaluations. (A) ECochG threshold vs. magnitude. The threshold was taken at the frequency indicated by the symbol, and the response magnitude was the sum of the significant harmonics to 90 dB nHL (corrected to HL for plotting). To look for saturation we plotted the r2 to both a linear and sigmoidal fit; since these were similar the saturation is minimal. (B). ECochG threshold vs. audiometric thresholds. These were significantly correlated, and there were many ECochG thresholds that were lower than the audiometric thresholds (above the dashed line of equality).

References

    1. Abbas PJ, Tejani VD, Scheperle RA, et al. (2017). Using Neural Response Telemetry to Monitor Physiological Responses to Acoustic Stimulation in Hybrid Cochlear Implant Users. Ear Hear, 38, 409–425. - PMC - PubMed
    1. Acharya AN, Tavora-Vieira D, Rajan GP (2016). Using the Implant Electrode Array to Conduct Real-time Intraoperative Hearing Monitoring During Pediatric Cochlear Implantation: Preliminary Experiences. Otol Neurotol, 37, e148–153. - PubMed
    1. Adunka OF, Dillon MT, Adunka MC, et al. (2013). Hearing preservation and speech perception outcomes with electric-acoustic stimulation after 12 months of listening experience. Laryngoscope, 123, 2509–2515. - PubMed
    1. Ahmad FI, Demason CE, HF BT, et al. (2012). Cochlear implantation in children with postlingual hearing loss. Laryngoscope. - PubMed
    1. Aminpour S, Tinling SP, Brodie HA (2005). Role of tumor necrosis factor-alpha in sensorineural hearing loss after bacterial meningitis. Otol Neurotol, 26, 602–609. - PubMed

Publication types