Comparative Study
. 2018 Aug 31;13(8):e0202344.
doi: 10.1371/journal.pone.0202344. eCollection 2018.

Machine learning models in electronic health records can outperform conventional survival models for predicting patient mortality in coronary artery disease

Affiliations
Comparative Study

Machine learning models in electronic health records can outperform conventional survival models for predicting patient mortality in coronary artery disease

Andrew J Steele et al. PLoS One. .

Abstract

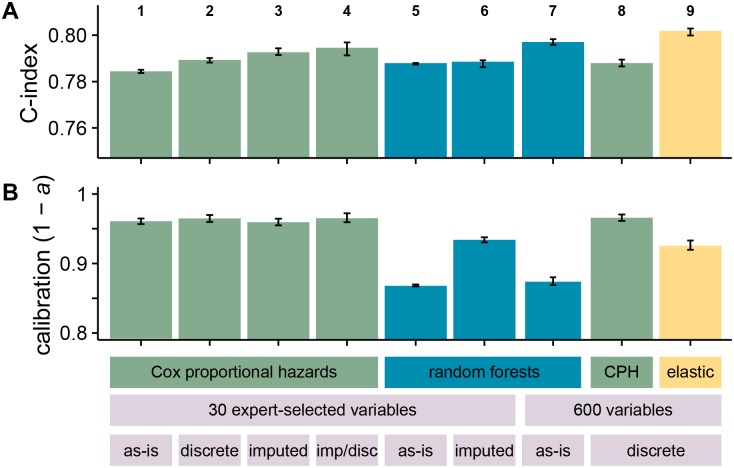
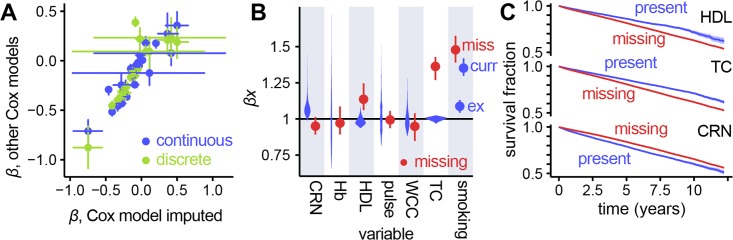
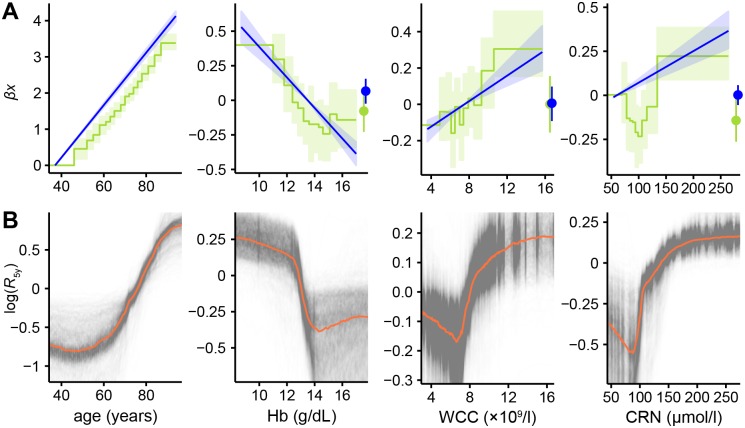
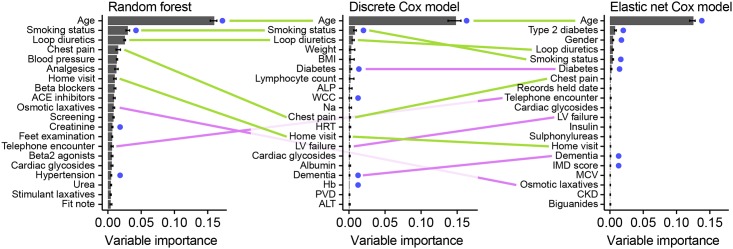
Prognostic modelling is important in clinical practice and epidemiology for patient management and research. Electronic health records (EHR) provide large quantities of data for such models, but conventional epidemiological approaches require significant researcher time to implement. Expert selection of variables, fine-tuning of variable transformations and interactions, and imputing missing values are time-consuming and could bias subsequent analysis, particularly given that missingness in EHR is both high, and may carry meaning. Using a cohort of 80,000 patients from the CALIBER programme, we compared traditional modelling and machine-learning approaches in EHR. First, we used Cox models and random survival forests with and without imputation on 27 expert-selected, preprocessed variables to predict all-cause mortality. We then used Cox models, random forests and elastic net regression on an extended dataset with 586 variables to build prognostic models and identify novel prognostic factors without prior expert input. We observed that data-driven models used on an extended dataset can outperform conventional models for prognosis, without data preprocessing or imputing missing values. An elastic net Cox regression based with 586 unimputed variables with continuous values discretised achieved a C-index of 0.801 (bootstrapped 95% CI 0.799 to 0.802), compared to 0.793 (0.791 to 0.794) for a traditional Cox model comprising 27 expert-selected variables with imputation for missing values. We also found that data-driven models allow identification of novel prognostic variables; that the absence of values for particular variables carries meaning, and can have significant implications for prognosis; and that variables often have a nonlinear association with mortality, which discretised Cox models and random forests can elucidate. This demonstrates that machine-learning approaches applied to raw EHR data can be used to build models for use in research and clinical practice, and identify novel predictive variables and their effects to inform future research.


Conflict of interest statement

The authors have declared that no competing interests exist.

Figures

Fig 1
Fig 1. Overall discrimination and calibration performance for the different models and datasets used.
(A) shows discrimination (C-index) and (B) shows calibration (1 − a, where a is the area between the observed calibration curve and an idealised one for patient risk at five years). Bar height indicates median performance across bootstrap replicates, with error bars representing 95% confidence intervals. Columns 1–4 represent variations on the Cox proportional hazards models using the 27 expert-selected variables used in Ref. [13]. Column 1 shows a model with missing values included with dummy variables; column 2 shows a model where continuous values have been discretised and missing values included as an additional category; column 3 shows a model where missing values have been imputed; and column 4 shows a model where missing values have been imputed and then all values discretised with the same scheme as column 2. Columns 5–7 show the performance of random survival forests. Column 5 uses the 27 expert-selected variables with missing values included with missingness indicators, and column 6 uses the imputed dataset. Columns 7 and 8 show models based on a subset of the 600 least missing variables across a number of different EHR data sources, selected by cross-validation. 7 is a random forest model with missing values left as-is, while 8 is a Cox proportional hazards model with continuous values discretised. Column 9 is an elastic net regression based on all 600 variables.
Fig 2
Fig 2. Example calibration curves for mortality at five years.
Curves show calibration of (A) model 5 (poorly-calibrated) and (B) model 9 (well-calibrated) from Fig 1. Each semi-transparent dot represents a patient in a random sample of 2000 from the test set, the x-axis shows their risk of death at five years as predicted by the relevant model, and the y-axis shows whether each patient was in fact dead or alive at that time. The curves are smoothed calibration curves derived from these points, and the area between the calibration curve and the black line of perfect calibration is a in the calibration score, 1 − a.
Fig 3
Fig 3. Comparison of coefficients for present and missing data in continuous and discrete Cox models.
(A) Fitted coefficients for different Cox models compared. Values of risks from both the continuous model with missingness indicators, and the discretised model are plotted against the continuous imputed Cox model. There are fewer points for the discretised model as coefficients for continuous values are not directly comparable. The very large error bars on four of the points correspond to the risk for diagnoses of STEMI and NSTEMI. This is due to the majority (73%) of heart attack diagnoses being ‘MI (not otherwise specified)’ from which the more specific diagnoses were imputed, introducing significant uncertainty. (B) For the continuous Cox model with missingness indicators, risk ranges for the ranges of values for variables present in the dataset (violin plots) with risk associated with that value being missing (points with error bars). CRN = creatinine, HGB = haemoglobin, HDL = high-density lipoprotein, WBC = white blood cell count, TC = total cholesterol; for smoking status, miss = missing, ex = ex-smoker and curr = current smoker, with non-smokers as the baseline. (C) Survival curves for selected variables, comparing patients with a value recorded for that variable versus patients with a missing value. These can be compared with risks associated with a missing value, seen in (B): HDL and TC show increased risk where values are missing, whilst CRN shows the opposite, which is reflected in the survival curves.
Fig 4
Fig 4. Variable effect plots from Cox models and partial dependence plots for random survival forests.
(A) Comparisons between relative log-risks derived from the continuous Cox models (straight blue lines, light blue 95% CI region) against those derived from the discretised models (green steps, light green 95% CI region), together with log-risks associated with those values being missing (points with error bars on the right of plots). Confidence intervals on the continuous models represent Δβixi for each variable xi, and hence increase from the value taken as the baseline where xi = 0. The lowest-valued bin of the discrete Cox model is taken to be the baseline and has no associated uncertainty. Discrete model lines are shifted on the y-axis to align their baseline values with the corresponding value in the continuous model to aid comparison; since these are relative risks, vertical alignment is arbitrary. (B) Partial dependence plots [46] inferred from random forests. Semitransparent black lines show the change in log-risk of death after five years from sweeping across possible values of the variable of interest whilst holding other variables constant. Results are normalised to average mortality across all values of this variable. Thick orange lines show the median of the 1000 replicates, indicating the average response in log-risk to changing this variable.
Fig 5
Fig 5. Top 20 variables by permutation importance for the three data-driven models, using random survival forests, discrete Cox modelling and elastic net regression.
Variables which are either identical or very similar to those found in the expert-selected dataset are highlighted with a blue dot; variables appearing in two of the models are joined by a pink line (with reduced opacity for those which pass behind the middle graph); whilst variables appearing in all three are joined by green lines. Some variable names have been abbreviated for space: ACE inhibitors = angiotensin-converting enzyme inhibitors; ALP = alkaline phosphatase; analgesics = non-opioid and compound analgesics; ALT = alanine aminotransferase; Beta2 agonists = selective beta2 agonists; blood pressure = diastolic blood pressure; BMI = body mass index; CKD = chronic kidney disease; Insulin = intermediate- and long-acting insulins; LV failure = left ventricular failure; Hb = haemoglobin; MCV = mean corpuscular volume; Na = sodium; PVD = peripheral vascular disease; Records held date = date records held from; WCC = total white blood cell count.

References

    1. Goldstein BA, Navar AM, Pencina MJ, Ioannidis JPA. Opportunities and challenges in developing risk prediction models with electronic health records data: a systematic review. J Am Med Inform Assoc. 2017;24(1):198–208. 10.1093/jamia/ocw042 - DOI - PMC - PubMed
    1. Riley RD, Ensor J, Snell KIE, Debray TPA, Altman DG, Moons KGM, et al. External validation of clinical prediction models using big datasets from e-health records or IPD meta-analysis: opportunities and challenges. BMJ. 2016;353:i3140 10.1136/bmj.i3140 - DOI - PMC - PubMed
    1. Denaxas S, Kunz H, Smeeth L, Gonzalez-Izquierdo A, Boutselakis H, Pikoula M, et al. Methods for enhancing the reproducibility of clinical epidemiology research in linked electronic health records: results and lessons learned from the CALIBER platform. IJPDS. 2017;1(1). doi: 10.23889/ijpds.v1i1.84 - DOI
    1. Casey JA, Schwartz BS, Stewart WF, Adler NE. Using Electronic Health Records for Population Health Research: A Review of Methods and Applications. Annu Rev Public Health. 2016;37:61–81. 10.1146/annurev-publhealth-032315-021353 - DOI - PMC - PubMed
    1. Denaxas SC, Morley KI. Big biomedical data and cardiovascular disease research: opportunities and challenges. Eur Heart J Qual Care Clin Outcomes. 2015;1(1):9–16. 10.1093/ehjqcco/qcv005 - DOI - PubMed

Publication types