. 2018 Nov 1;35(11):2669-2684.
doi: 10.1093/molbev/msy163.

Nonoptimal Gene Expression Creates Latent Potential for Antibiotic Resistance

Affiliations

Nonoptimal Gene Expression Creates Latent Potential for Antibiotic Resistance

Adam C Palmer et al. Mol Biol Evol. .

Abstract

Bacteria regulate genes to survive antibiotic stress, but regulation can be far from perfect. When regulation is not optimal, mutations that change gene expression can contribute to antibiotic resistance. It is not systematically understood to what extent natural gene regulation is or is not optimal for distinct antibiotics, and how changes in expression of specific genes quantitatively affect antibiotic resistance. Here we discover a simple quantitative relation between fitness, gene expression, and antibiotic potency, which rationalizes our observation that a multitude of genes and even innate antibiotic defense mechanisms have expression that is critically nonoptimal under antibiotic treatment. First, we developed a pooled-strain drug-diffusion assay and screened Escherichia coli overexpression and knockout libraries, finding that resistance to a range of 31 antibiotics could result from changing expression of a large and functionally diverse set of genes, in a primarily but not exclusively drug-specific manner. Second, by synthetically controlling the expression of single-drug and multidrug resistance genes, we observed that their fitness-expression functions changed dramatically under antibiotic treatment in accordance with a log-sensitivity relation. Thus, because many genes are nonoptimally expressed under antibiotic treatment, many regulatory mutations can contribute to resistance by altering expression and by activating latent defenses.


Figures
<sc>Fig</sc>. 1.
Fig. 1.
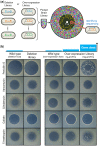
A genome-wide screen identifies changes in gene expression that confer antibiotic resistance. (a) A library of Escherichia coli strains with genes deleted or overexpressed is pooled and plated as a lawn on agar. A drug spot is applied which creates a zone of growth inhibition. Members of the strain library with increased drug resistance grow inside the zone of inhibition (yellow colonies), and are picked and identified by DNA sequencing. (b) Photographs of assay plates for five example antibiotics (out of 31) illustrate that both gene deletion and overexpression can confer drug resistance, and the possible levels of resistance range from none at all (e.g., colistin), to modest (e.g., clindamycin, vancomycin), to very strong (e.g., penicillin, trimethoprim). Plate images for all antibiotics are shown in supplementary figure S1, Supplementary Material online.
<sc>Fig</sc>. 2.
Fig. 2.
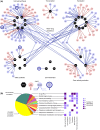
Drug-specific and drug-general resistance through a multitude of gene expression changes. (a) Antibiotics (black hexagons) are grouped by mechanism of action (see table 1 for abbreviations). Escherichia coli genes are marked by red circles when deletion confers antibiotic resistance and blue circles when overexpression confers antibiotic resistance; known antibiotic targets whose overexpression confers resistance are outlined in dark blue. Changes in gene expression that resist only one mechanism of drug action are grouped around the antibiotics of that mechanism, while those that resist multiple classes of drug are shown in the center. Pale-colored links denote changes in gene expression that were identified only once as resisting a particular drug, that are included because they were repeatedly observed to resist another drug of the same mechanism of action (supplementary note, Supplementary Material online). Supplementary table S1, Supplementary Material online, lists all gene–drug interactions. (b) Changes in gene expression can confer drug resistance through a wide variety of mechanisms. Some of the identified genes have functional annotations that clearly suggest a mechanism of resistance (supplementary table S3, Supplementary Material online), while most currently lack functional annotation (25% of genes) or do not have a functional annotation related to antibiotic action (38% of genes).
<sc>Fig</sc>. 3.
Fig. 3.
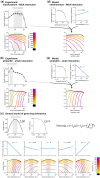
Antibiotic treatment alters optimal levels of gene expression. (a, b) Escherichia coli strains were constructed with experimentally controlled expression of nfsA or ampC, by deleting the respective gene from the chromosome and resupplying by plasmid an IPTG-inducible copy; zero expression was achieved with an empty plasmid (MU = Miller Units, quantified by LacZ assay; supplementary fig. S5, Supplementary Material online). Growth rates were measured as a function of gene expression using a sensitive bioluminescence assay (error bars are 95% confidence limits; n = 5 for nfsA, n = 10 for ampC). For each gene, growth is optimized in a particular expression range (gray shading). Fitness–expression functions were measured again at different doses of antibiotics that interact with these genes (nitrofurantoin–nfsA; ampicillin–ampC), revealing that antibiotic treatment shifts these functions so dramatically that expression levels which are optimal in the absence of antibiotic become lethally nonoptimal at high antibiotic concentrations. (c) A general model of how gene–drug interactions affect fitness is built from three parts: 1) fG is the fitness effect of gene expression level g, 2) fA is the fitness effect of antibiotic concentration a, and 3) gene–drug interaction is described by log-sensitivity η, where each 1% increase in gene expression affects a η% change in apparent antibiotic potency. Fitness as a function of gene expression and antibiotic dose is fG× fA. In general, fG and fA can be empirically determined; here for illustration, we use functions that resemble experimental observations: fG is quadratic, fA = 1 – a/K (K is a constant). For any log-sensitivity that substantially differs from zero (η ≤ –0.25 or η ≥ +0.25), a positive or negative change in gene expression can confer growth under antibiotic doses that are fully inhibitory when expression is at the antibiotic-free optimum (gray-shaded region). a.u., arbitrary units. (d, e) The observed antibiotic-induced changes in optimum gene expression levels for nfsA and ampC are quantitatively described by this model when using the measured relationships for fG and fA, with η = +0.25 for nfsA–nitrofurantoin, and η = –1 for ampC–ampicillin.
<sc>Fig</sc>. 4.
Fig. 4.
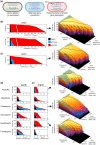
Intrinsic antibiotic resistance systems are often poorly utilized and hold unrealized potential for stronger resistance. (a) The optimality of a gene’s response to antibiotic treatment was investigated by comparing the drug susceptibility of three Escherichia coli strains: One lacking the gene (black), one with wild-type gene regulation (blue), and one where susceptibility can be measured over a range of experimentally controlled gene expression levels (red). (b) ampC encodes a potent beta-lactamase: Overexpression can confer a 100-fold increase in resistance to penicillins or cephalosporins. However, with wild-type regulation of ampC (blue) almost none of this potential for resistance (red) is used. Right: An empirical fitness landscape shows the growth inhibitory effect of an antibiotic at different levels of gene expression. Inhibition of the wild-type strain is illustrated by a transparent blue surface across the landscape; regions where the landscape is above the blue surface are levels of gene expression conferring antibiotic tolerance that is superior to wild type. A red line traces the gene expression response that maximizes growth at each drug dose. (c) sbmC encodes a DNA gyrase inhibitor whose overexpression confers resistance to the DNA-damaging drug phleomycin. However, a wild-type strain (blue) treated with phleomycin uses very little of the potential resistance offered by sbmC (red). (d, e) The use of soxS and marA was examined under treatment by nine different antibiotics (cefsulodin, nitrofurantoin, and phleomycin are not shown because marA and soxS had no effect on susceptibility; supplementary fig. S7, Supplementary Material online). For those drugs where experimental control of gene expression (red) increased resistance relative to gene deletion (black), the wild-type strain (blue) most often used only a fraction of the potential for drug resistance. Right: Selected examples of fitness landscapes of drug resistance versus marA expression. marA use is suboptimal in ampicillin and ciprofloxacin, and in clindamycin marA is only used effectively when growth is inhibited by more than 50%.
<sc>Fig</sc>. 5.
Fig. 5.
Drug resistance genes can be latent and/or intrinsic, depending on the optimality of wild-type gene expression under drug treatment. (a) The relationship between drug resistance and gene expression can take several different shapes, which illustrates a distinction between genes that contribute to resistance at wild-type expression—the intrinsic resistome—and genes with the potential to contribute to resistance if their expression is changed from wild type—the latent resistome. (b) The current screen for latent resistance genes (number of genes per antibiotic in yellow) has little overlap (number in green) with a published screen of “intrinsic resistance genes” (number in blue) (Tamae et al. 2008). (c) For 86 gene–drug interactions where overexpression conferred antibiotic resistance, a deletion mutant of the same gene has previously been grown in a subinhibitory dose of the same antibiotic and its colony size measured as a Z-score relative to the set of all viable gene deletion mutants in Escherichia coli (Nichols et al. 2011). In this comparison, five genes were observed to confer both resistance when overexpressed and strong hypersensitivity when deleted (green gene names). marA and soxS are not among these five, but show modest sensitivity to several antibiotics when deleted (Z-scores ≈ −1 to −2).

References

    1. Alekshun MN, Levy SB.. 1999. The mar regulon: multiple resistance to antibiotics and other toxic chemicals. Trends Microbiol. 7(10): 410–413. - PubMed
    1. Altschul SF, Gish W, Miller W, Myers EW, Lipman DJ.. 1990. Basic local alignment search tool. J Mol Biol. 215(3): 403–410. - PubMed
    1. Andersson DI, Hughes D.. 2009. Gene amplification and adaptive evolution in bacteria. Annu Rev Genet. 43:167–195. - PubMed
    1. Ariza RR, Cohen SP, Bachhawat N, Levy SB, Demple B.. 1994. Repressor mutations in the marRAB operon that activate oxidative stress genes and multiple antibiotic resistance in Escherichia coli. J Bacteriol. 176(1): 143–148. - PMC - PubMed
    1. Baba T, Ara T, Hasegawa M, Takai Y, Okumura Y, Baba M, Datsenko KA, Tomita M, Wanner BL, Mori H, et al. 2006. Construction of Escherichia coli K-12 in-frame, single-gene knockout mutants: the Keio collection. Mol Syst Biol. 2: 2006 0008. - PMC - PubMed

Publication types

Substances