

Cultural Innovations Influence Patterns of Genetic Diversity in Northwestern Amazonia
- PMID: 30169717
- PMCID: PMC6231495
- DOI: 10.1093/molbev/msy169
Cultural Innovations Influence Patterns of Genetic Diversity in Northwestern Amazonia
Abstract
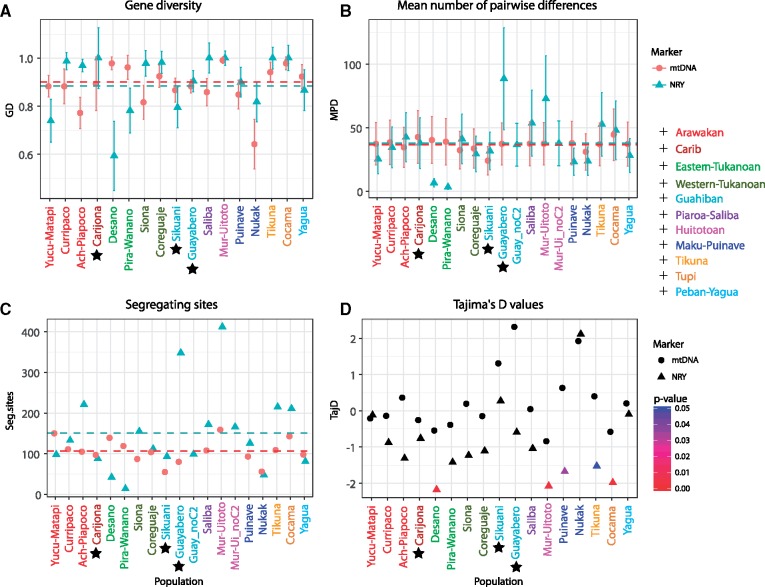
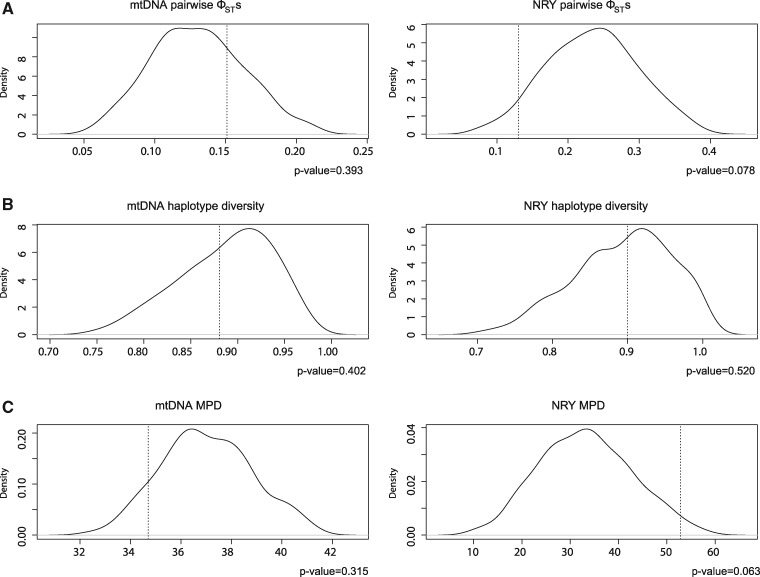
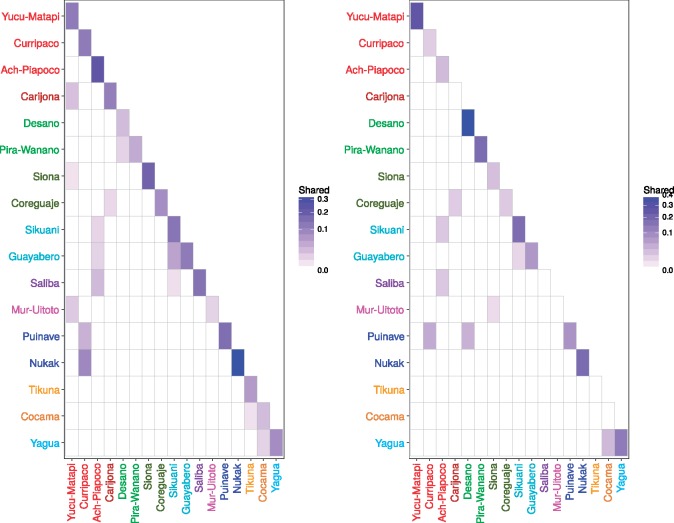
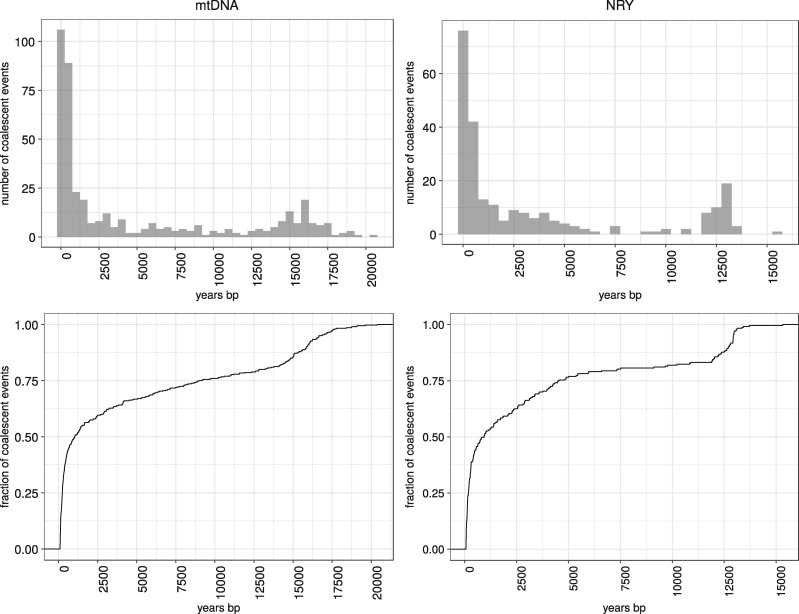
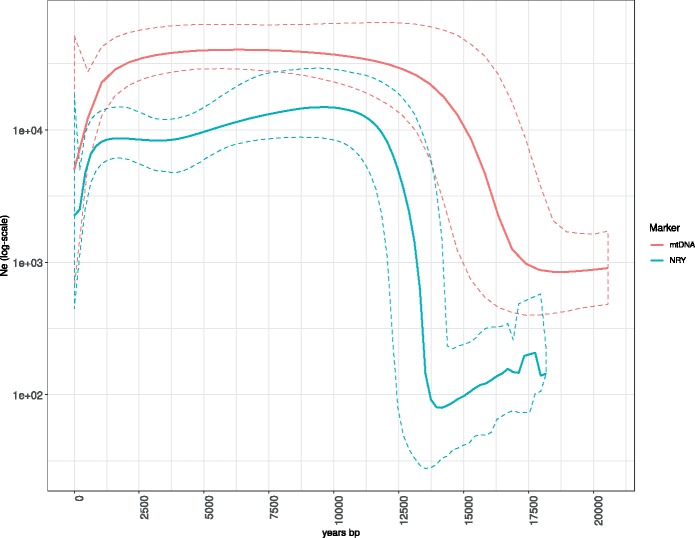
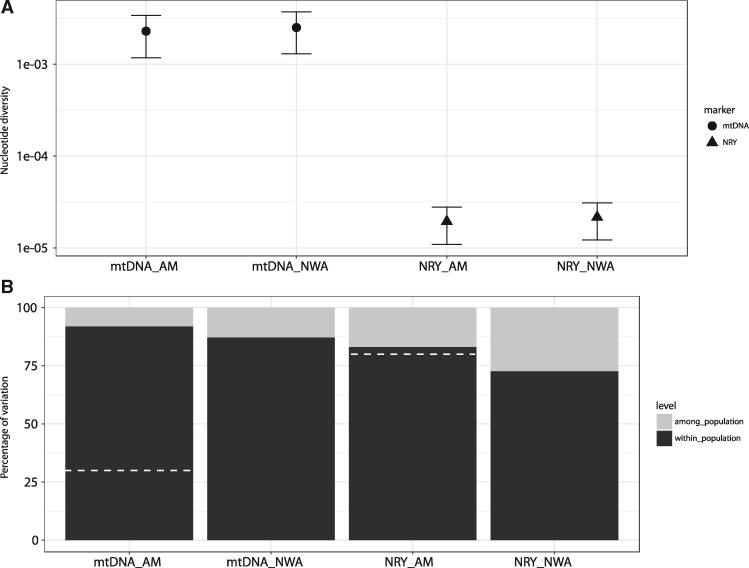
Human populations often exhibit contrasting patterns of genetic diversity in the mtDNA and the nonrecombining portion of the Y-chromosome (NRY), which reflect sex-specific cultural behaviors and population histories. Here, we sequenced 2.3 Mb of the NRY from 284 individuals representing more than 30 Native American groups from Northwestern Amazonia (NWA) and compared these data to previously generated mtDNA genomes from the same groups, to investigate the impact of cultural practices on genetic diversity and gain new insights about NWA population history. Relevant cultural practices in NWA include postmarital residential rules and linguistic exogamy, a marital practice in which men are required to marry women speaking a different language. We identified 2,969 SNPs in the NRY sequences, only 925 of which were previously described. The NRY and mtDNA data showed different sex-specific demographic histories: female effective population size has been larger than that of males through time, which might reflect larger variance in male reproductive success. Both markers show an increase in lineage diversification beginning ∼5,000 years ago, which may reflect the intensification of agriculture, technological innovations, and the expansion of regional trade networks documented in the archaeological evidence. Furthermore, we find similar excesses of NRY versus mtDNA between-population divergence at both the local and continental scale, suggesting long-term stability of female versus male migration. We also find evidence of the impact of sociocultural practices on diversity patterns. Finally, our study highlights the importance of analyzing high-resolution mtDNA and NRY sequences to reconstruct demographic history, since this can differ considerably between sexes.
Figures
References
-
- Aceituno FJ, Loaiza N, Delgado-Burbano ME, Barrientos G.. 2013. The initial human settlement of Northwest South America during the Pleistocene/Holocene transition: synthesis and perspectives. Quatern Int. 301:23–33.
-
- Achilli A, Perego UA, Lancioni H, Olivieri A, Gandini F, Hooshiar Kashani B, Battaglia V, Grugni V, Angerhofer N, Rogers MP, et al. 2013. Reconciling migration models to the Americas with the variation of North American native mitogenomes. Proc Natl Acad Sci U S A. 110(35):14308–14313. - PMC - PubMed
-
- Arias L, Barbieri C, Barreto G, Stoneking M, Pakendorf B.. 2018. High-resolution mitochondrial DNA analysis sheds light on human diversity, cultural interactions, and population mobility in Northwestern Amazonia. Am J Phys Anthropol. 165(2):238–255. - PubMed
-
- Arroyo-Kalin M. 2010. The Amazonian formative: crop domestication and anthropogenic soils. Diversity 2(4): 473–504.
-
- Arroyo-Kalin M. 2012. Slash-burn-and-churn: landscape history and crop cultivation in pre-Columbian Amazonia. Quatern Int. 249:4–18.
Publication types
MeSH terms
Substances
LinkOut - more resources
Full Text Sources
Other Literature Sources
Miscellaneous
