. 2019 Apr 1;35(7):1188-1196.
doi: 10.1093/bioinformatics/bty766.

PhysiBoSS: a multi-scale agent-based modelling framework integrating physical dimension and cell signalling

Affiliations

PhysiBoSS: a multi-scale agent-based modelling framework integrating physical dimension and cell signalling

Gaelle Letort et al. Bioinformatics. .

Abstract

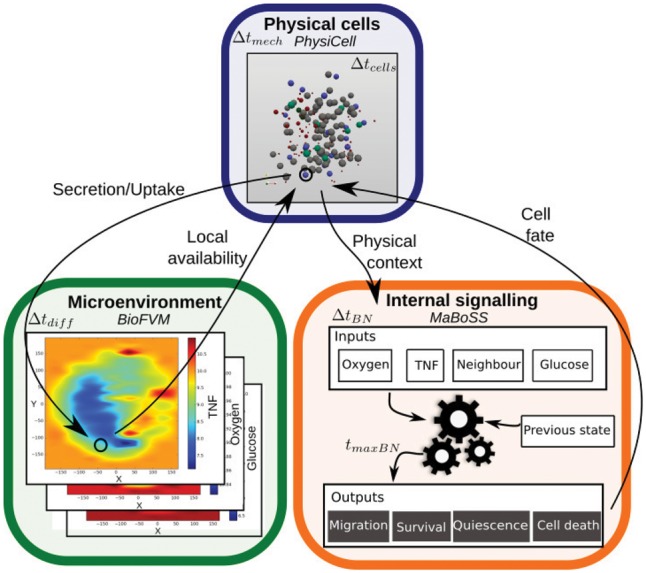
Motivation: Due to the complexity and heterogeneity of multicellular biological systems, mathematical models that take into account cell signalling, cell population behaviour and the extracellular environment are particularly helpful. We present PhysiBoSS, an open source software which combines intracellular signalling using Boolean modelling (MaBoSS) and multicellular behaviour using agent-based modelling (PhysiCell).

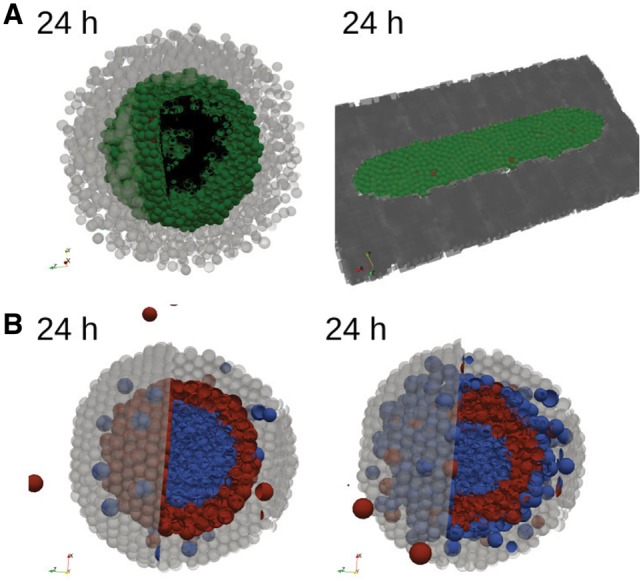
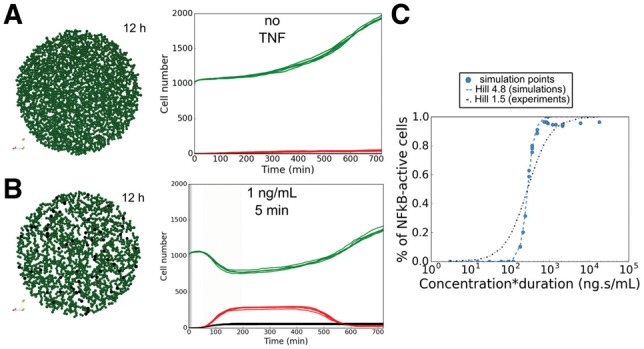
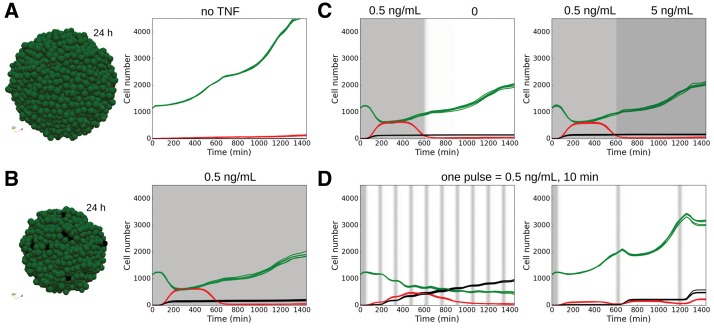
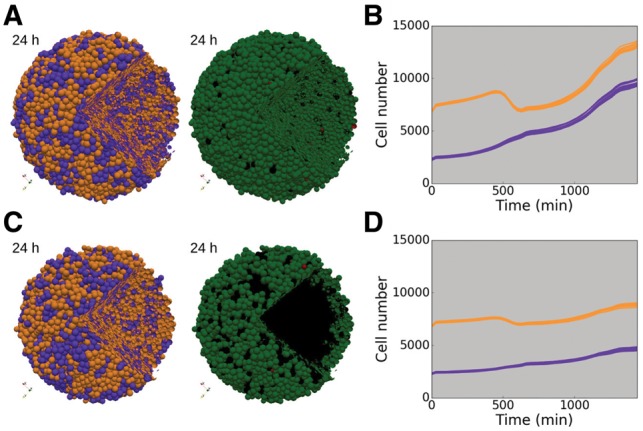
Results: PhysiBoSS provides a flexible and computationally efficient framework to explore the effect of environmental and genetic alterations of individual cells at the population level, bridging the critical gap from single-cell genotype to single-cell phenotype and emergent multicellular behaviour. PhysiBoSS thus becomes very useful when studying heterogeneous population response to treatment, mutation effects, different modes of invasion or isomorphic morphogenesis events. To concretely illustrate a potential use of PhysiBoSS, we studied heterogeneous cell fate decisions in response to TNF treatment. We explored the effect of different treatments and the behaviour of several resistant mutants. We highlighted the importance of spatial information on the population dynamics by considering the effect of competition for resources like oxygen.

Availability and implementation: PhysiBoSS is freely available on GitHub (https://github.com/sysbio-curie/PhysiBoSS), with a Docker image (https://hub.docker.com/r/gletort/physiboss/). It is distributed as open source under the BSD 3-clause license.

Supplementary information: Supplementary data are available at Bioinformatics online.


Figures

Fig. 1.
Fig. 1.
Schematic representation of PhysiBoSS. Three main parts are interconnected: the microenvironment representation in BioFVM (green, bottom left), allowing simulation of diffusing entities; the physical representation of cells as dynamic spheres in PhysiCell (blue, top); and the signalling modelling of each cell in MaBoSS (orange, bottom right) (Color version of this figure is available at Bioinformatics online.)
Fig. 2.
Fig. 2.
Examples of PhysiBoSS features. (A) Final state (24 h) of a simulation of active cells (green, Survival; black, Necrosis; red, Apoptosis) spheroid inside a core of passive ECM agents (light grey) (left panel). Final state (24 h) for active cells inside a fixed ECM dark grey field (right panel). (B) Final images (24 h) of mechanical cell sorting surrounded by ECM (passive spheres, light grey): the blue cell line (inside) forms strong junctions, while the red cell line (extern) is weakly adhesive. Cells do not adhere to ECM (left panel), or only the blue cell line can attach to the matrix (right panel). (A–B) Initial states of the simulations are shown in Supplementary Figure S1 (Color version of this figure is available at Bioinformatics online.)
Fig. 3.
Fig. 3.
Population response to TNF injection. (A) Simulation without TNF. Snapshot of a simulation after 12 h (left). Time evolution of the number of cells in each cell fate (right) for five simulations. (B) Same as A for a low-dose injection of TNF (1 ng/mL during 5 min). (C) Fraction of ‘activated’ cells (transient NFκB activation) compared to the initial number of viable cells according to TNF stimulus area (concentration time duration). The blue dotted line represents the Hill-function fit to the simulation data (coefficient 4.8), and the black dashed line represents a Hill-function of coefficient 1.5 as in experiments from (Kellogg et al., 2015). (A–C) Green, Proliferative cells; red, cells committed to Apoptosis; black, cells committed to NonACD. Initial disk radius: 400 µm (Color version of this figure is available at Bioinformatics online.)
Fig. 4.
Fig. 4.
Spheroid response to TNF injection. (A) Simulation in the spheroid model without TNF. Snapshot of a simulation (left) after 24 h. Time evolution of the number of cells in each cell fate (right) for five simulations. (B) Same as A for a continuous low-dose injection of TNF (0.5 ng/mL, continuously). (C) Simulation when TNF injection (0.5 ng/mL) is stopped (left) or drastically increased (5 ng/mL, right) after 600 min. Time evolution of the number of cells in each cell fate for five simulations under each condition. (D) Effect of pulse injection frequencies in the model simulations. Time evolution of the number of cells in each cell fate for five simulations when pulsed injections (0.5 ng/mL during 10 min) are repeated every 150 (left) and 600 (right) min. (A–D) Green, Proliferative cells; red, Apoptosis; black, NonACD. Grey shading represents TNF injection. Initial spheroid radius is 100 µm (Color version of this figure is available at Bioinformatics online.)
Fig. 5.
Fig. 5.
Genetically heterogeneous population under TNF treatment. Simulations of heterogeneous population composed of 75% of WT cells (orange) and 25% of IKK+ and cFLIP+ mutated cells (purple). (A) Snapshots of a genetically heterogeneous population simulation at initial and final time (24 h), with cells coloured by cell type (left and middle) or by cell fate (right). (B) Time evolution of the number of cells in each strain (WT and mutated) for 10 simulations. Grey shading indicates presence of TNF in continuous injection at 0.5 ng/mL. (C) Same as A with oxygen dynamics taken into account. (D) Same as B for simulations with oxygen diffusion. (A–D) Cell fate colours: green, Proliferative cells; red, Apoptotic; black, NonACD. Initial spheroid radius: 200 µm, + stands for over-expression (Color version of this figure is available at Bioinformatics online.)

References

    1. Ahmadzadeh H. et al. (2017) Modeling the two-way feedback between contractility and matrix realignment reveals a nonlinear mode of cancer cell invasion. Proc. Natl. Acad. Sci., 114, E1617–E1626. - PMC - PubMed
    1. Altinok A. et al. (2011) An automaton model for the cell cycle. Interface Focus, 1, 36–47. - PMC - PubMed
    1. An G. et al. (2009) Agent-based models in translational systems biology. Wiley Interdisciplinary Reviews: Systems Biology and Medicine, 1, 159–171. - PMC - PubMed
    1. Anderson A.R.A., Quaranta V. (2008) Integrative mathematical oncology. Nat. Rev. Cancer, 8, 227–234. - PubMed
    1. Anderson A.R.A. et al. (2006) Tumor morphology and phenotypic evolution driven by selective pressure from the microenvironment. Cell, 127, 905–915. - PubMed

Publication types