Functional and Mechanistic Neurotoxicity Profiling Using Human iPSC-Derived Neural 3D Cultures
- PMID: 30169818
- PMCID: PMC6317428
- DOI: 10.1093/toxsci/kfy218
Functional and Mechanistic Neurotoxicity Profiling Using Human iPSC-Derived Neural 3D Cultures
Abstract
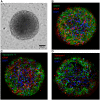
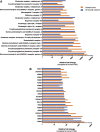
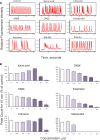
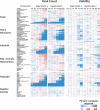
Neurological disorders affect millions of people worldwide and appear to be on the rise. Whereas the reason for this increase remains unknown, environmental factors are a suspected contributor. Hence, there is an urgent need to develop more complex, biologically relevant, and predictive in vitro assays to screen larger sets of compounds with the potential for neurotoxicity. Here, we employed a human induced pluripotent stem cell (iPSC)-based 3D neural platform composed of mature cortical neurons and astrocytes as a model for this purpose. The iPSC-derived human 3D cortical neuron/astrocyte co-cultures (3D neural cultures) present spontaneous synchronized, readily detectable calcium oscillations. This advanced neural platform was optimized for high-throughput screening in 384-well plates and displays highly consistent, functional performance across different wells and plates. Characterization of oscillation profiles in 3D neural cultures was performed through multi-parametric analysis that included the calcium oscillation rate and peak width, amplitude, and waveform irregularities. Cellular and mitochondrial toxicity were assessed by high-content imaging. For assay characterization, we used a set of neuromodulators with known mechanisms of action. We then explored the neurotoxic profile of a library of 87 compounds that included pharmaceutical drugs, pesticides, flame retardants, and other chemicals. Our results demonstrated that 57% of the tested compounds exhibited effects in the assay. The compounds were then ranked according to their effective concentrations based on in vitro activity. Our results show that a human iPSC-derived 3D neural culture assay platform is a promising biologically relevant tool to assess the neurotoxic potential of drugs and environmental toxicants.
Figures




Similar articles
-
Neurite outgrowth in human induced pluripotent stem cell-derived neurons as a high-throughput screen for developmental neurotoxicity or neurotoxicity.Neurotoxicology. 2016 Mar;53:271-281. doi: 10.1016/j.neuro.2016.02.003. Epub 2016 Feb 4. Neurotoxicology. 2016. PMID: 26854185
-
Comparative neurotoxicity screening in human iPSC-derived neural stem cells, neurons and astrocytes.Brain Res. 2016 May 1;1638(Pt A):57-73. doi: 10.1016/j.brainres.2015.07.048. Epub 2015 Aug 5. Brain Res. 2016. PMID: 26254731 Free PMC article.
-
From the Cover: AstrocytesAre Protective Against Chlorpyrifos Developmental Neurotoxicity in Human Pluripotent Stem Cell-Derived Astrocyte-Neuron Cocultures.Toxicol Sci. 2017 Jun 1;157(2):410-420. doi: 10.1093/toxsci/kfx056. Toxicol Sci. 2017. PMID: 28369648
-
Approach to Neurotoxicity using Human iPSC Neurons: Consortium for Safety Assessment using Human iPS Cells.Curr Pharm Biotechnol. 2020;21(9):780-786. doi: 10.2174/1389201020666191129103730. Curr Pharm Biotechnol. 2020. PMID: 31782362 Review.
-
Translating neurobehavioural endpoints of developmental neurotoxicity tests into in vitro assays and readouts.Neurotoxicology. 2012 Aug;33(4):911-24. doi: 10.1016/j.neuro.2011.10.002. Epub 2011 Oct 12. Neurotoxicology. 2012. PMID: 22008243 Free PMC article. Review.
Cited by
-
Decoupling Behavioral Domains via Kynurenic Acid Analog Optimization: Implications for Schizophrenia and Parkinson's Disease Therapeutics.Cells. 2025 Jun 25;14(13):973. doi: 10.3390/cells14130973. Cells. 2025. PMID: 40643494 Free PMC article.
-
Cell-Type-Specific High Throughput Toxicity Testing in Human Midbrain Organoids.Front Mol Neurosci. 2021 Jul 15;14:715054. doi: 10.3389/fnmol.2021.715054. eCollection 2021. Front Mol Neurosci. 2021. PMID: 34335182 Free PMC article.
-
Human Embryos, Induced Pluripotent Stem Cells, and Organoids: Models to Assess the Effects of Environmental Plastic Pollution.Front Cell Dev Biol. 2021 Sep 3;9:709183. doi: 10.3389/fcell.2021.709183. eCollection 2021. Front Cell Dev Biol. 2021. PMID: 34540831 Free PMC article. Review.
-
In vivo neurophysiological assessment of in silico predictions of neurotoxicity: Citronellal, 3,4-dichloro-1-butene, and benzyl bromoacetate.Neurotoxicology. 2022 May;90:48-61. doi: 10.1016/j.neuro.2022.02.008. Epub 2022 Feb 25. Neurotoxicology. 2022. PMID: 35227730 Free PMC article.
-
Identification of neural-relevant toxcast high-throughput assay intended gene targets: Applicability to neurotoxicity and neurotoxicant putative molecular initiating events.Neurotoxicology. 2024 Jul;103:256-265. doi: 10.1016/j.neuro.2024.07.001. Epub 2024 Jul 6. Neurotoxicology. 2024. PMID: 38977203 Free PMC article. Review.
References
-
- Abou-Donia M. B. (2003). Organophosphorus ester-induced chronic neurotoxicity. Arche. Environ. Health 58, 484–497. - PubMed
-
- Arvanov V. L., Liang X., Schwartz J., Grossman S., Wang R. Y. (1997). Clozapine and haloperidol modulate N-methyl-d-aspartate- and non-N-methyl-d-aspartate receptor-mediated neurotransmission in rat prefrontal cortical neurons in vitro. J. Pharmacol. Exp. Ther. 283, 226–234. - PubMed
-
- Beattie E. C., Carroll R. C., Yu X., Morishita W., Yasuda H., von Zastrow M., Malenka R. C. (2000). Regulation of AMPA receptor endocytosis by a signaling mechanism shared with LTD. Nat. Neurosci. 3, 1291–1300. - PubMed
Publication types
MeSH terms
Substances
LinkOut - more resources
Full Text Sources
Other Literature Sources

