

Geographical differences in preterm delivery rates in Sweden: A population-based cohort study
- PMID: 30169899
- PMCID: PMC6492021
- DOI: 10.1111/aogs.13455
Geographical differences in preterm delivery rates in Sweden: A population-based cohort study
Abstract
Introduction: Preterm delivery is a major global public health challenge. The objective of this study was to determine how preterm delivery rates differ in a country with a very high human development index and to explore rural vs urban environmental and socioeconomic factors that may be responsible for this variation.
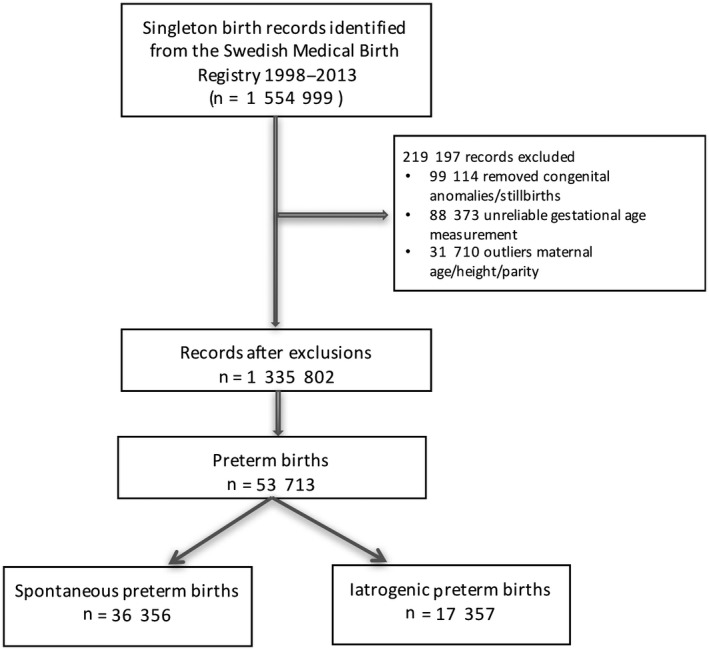
Material and methods: A population-based study was performed using data from the Swedish Medical Birth Register from 1998 to 2013. Sweden was chosen as a model because of its validated, routinely collected data and availability of individual social data. The total population comprised 1 335 802 singleton births. A multiple linear regression was used to adjust gestational age for known risk factors (maternal smoking, ethnicity, maternal education, maternal age, height, fetal sex, maternal diabetes, maternal hypertension, and parity). A second and a third model were subsequently fitted allowing separate intercepts for each municipality (as fixed or random effects). Adjusted gestational ages were converted to preterm delivery rates and mapped onto maternal residential municipalities. Additionally, the effects of six rural vs urban environmental and socioeconomic factors on gestational age were tested using a simple weighted linear regression.
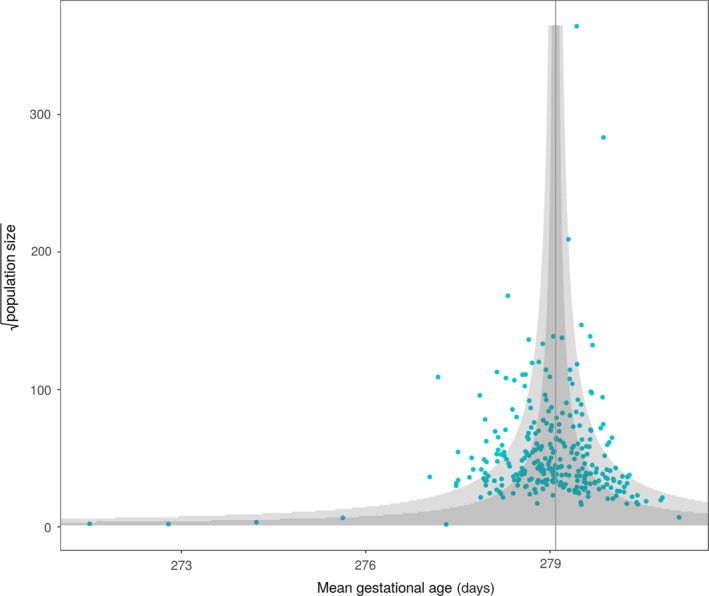
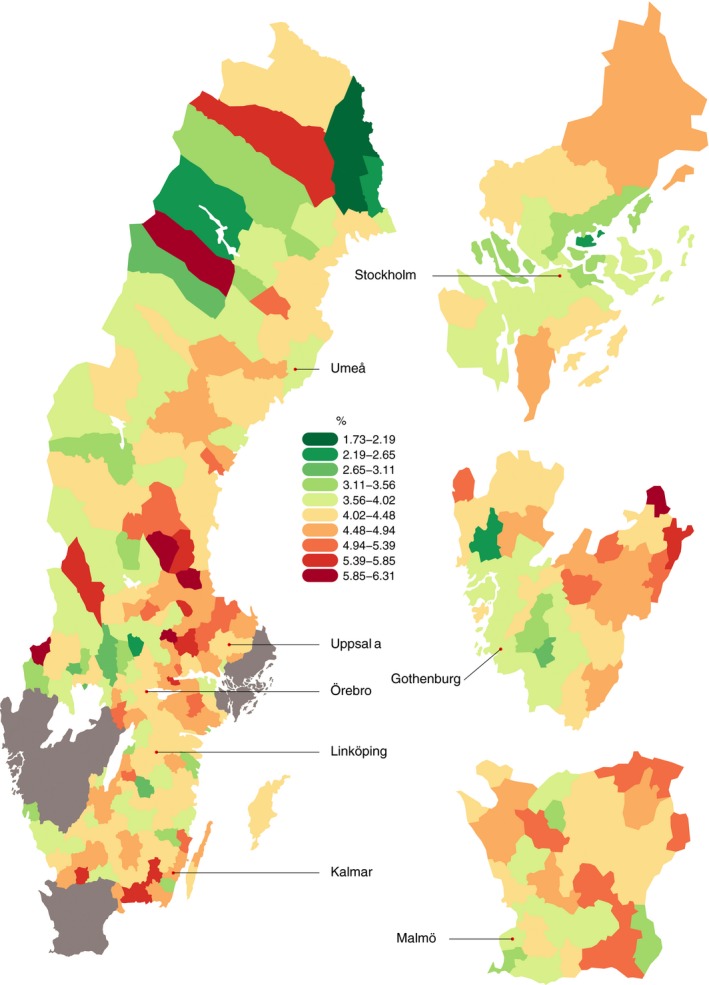
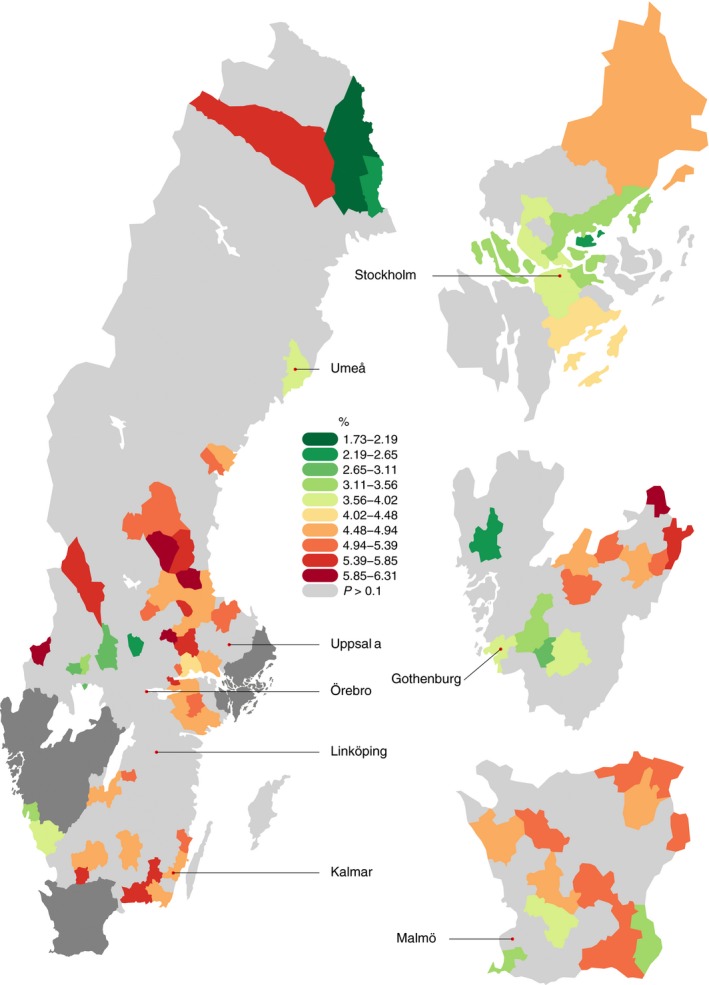
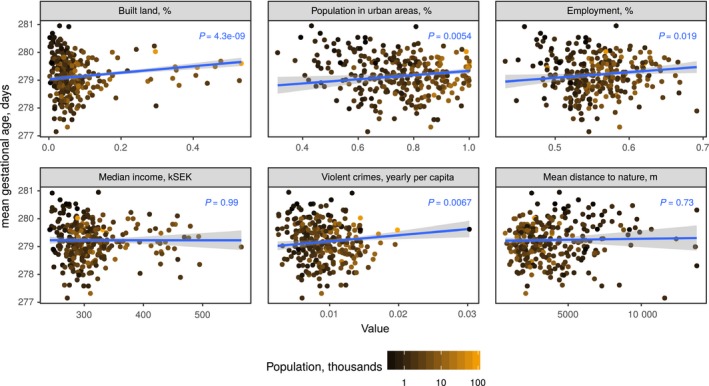
Results: The study population preterm delivery rate was 4.12%. Marked differences from the overall preterm delivery rate were observed (rate estimates ranged from 1.73% to 6.31%). The statistical significance of this heterogeneity across municipalities was confirmed by a chi-squared test (P < 0.001). Around 20% of the gestational age variance explained by the full model (after adjustment for known variables described above) could be attributed to municipality-level effects. In addition, gestational age was found to be longer in areas with a higher fraction of built-upon land and other urban features.
Conclusions: After adjusting for known risk factors, large geographical differences in rates of preterm delivery remain. Additional analyses to look at the effect of environmental and socioeconomic factors on gestational age found an increased gestational age in urban areas. Future research strategies could focus on investigating the urbanity effect to try to explain preterm delivery variation across countries with a very high human development index.
Keywords: epidemiology; premature; premature obstetric labor; preterm birth; preterm infant.
© 2018 The Authors. Acta Obstetricia et Gynecologica Scandinavica published by John Wiley & Sons Ltd on behalf of Nordic Federation of Societies of Obstetrics and Gynecology (NFOG).
Conflict of interest statement
The authors have stated explicitly that there are no conflicts of interest in connection with this article.
Figures
References
-
- Blencowe H, Cousens S, Oestergaard MZ, et al. National, regional, and worldwide estimates of preterm birth rates in the year 2010 with time trends since 1990 for selected countries: a systematic analysis and implications. Lancet. 2012;379:2162‐2172. - PubMed
-
- Behrman RE, Butler AS, Committee on Understanding Premature Birth and Assuring Healthy Outcomes . Preterm birth: causes, consequences, and prevention. Washington, DC: National Academies Press; 2007. - PubMed
-
- World Health Organization . Born too soon: the global action report on preterm birth. Geneva: World Health Organization; 2012.
Publication types
MeSH terms
Grants and funding
LinkOut - more resources
Full Text Sources
Other Literature Sources
Medical
