. 2018 Aug 31;19(1):648.
doi: 10.1186/s12864-018-5036-8.

Insights into the correlation between Physiological changes in and seed development of tartary buckwheat (Fagopyrum tataricum Gaertn.)

Affiliations

Insights into the correlation between Physiological changes in and seed development of tartary buckwheat (Fagopyrum tataricum Gaertn.)

Moyang Liu et al. BMC Genomics. .

Abstract

Background: Tartary buckwheat (Fagopyrum tataricum Gaertn.) is a widely cultivated medicinal and edible crop with excellent economic and nutritional value. The development of tartary buckwheat seeds is a very complex process involving many expression-dependent physiological changes and regulation of a large number of genes and phytohormones. In recent years, the gene regulatory network governing the physiological changes occurring during seed development have received little attention.

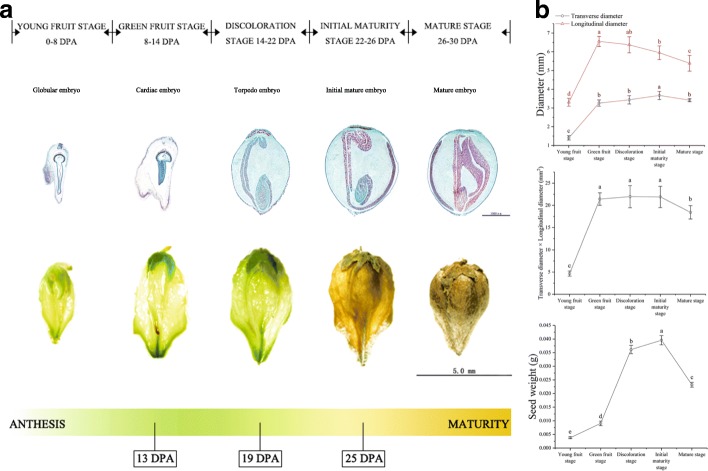
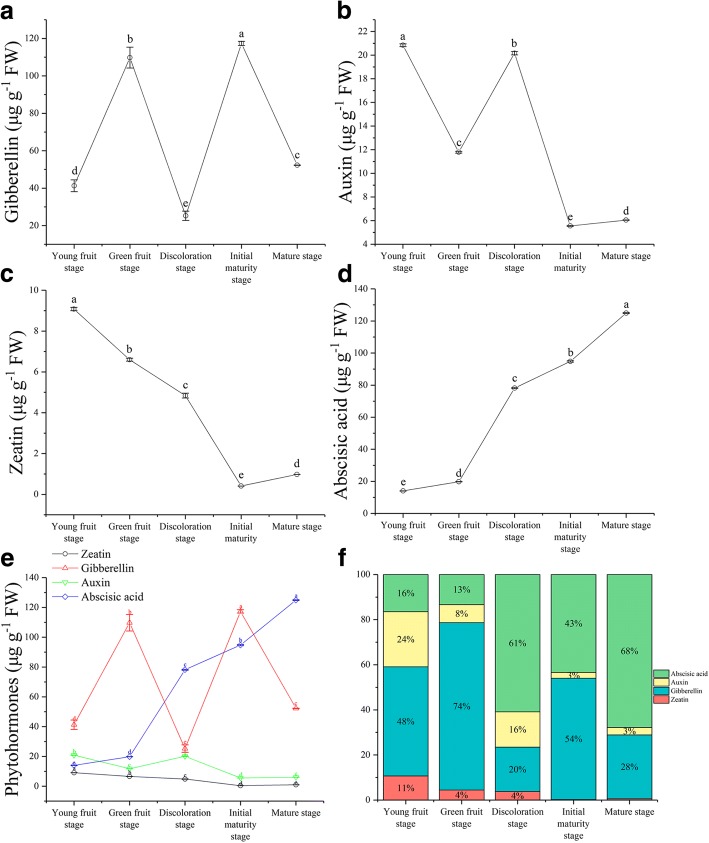
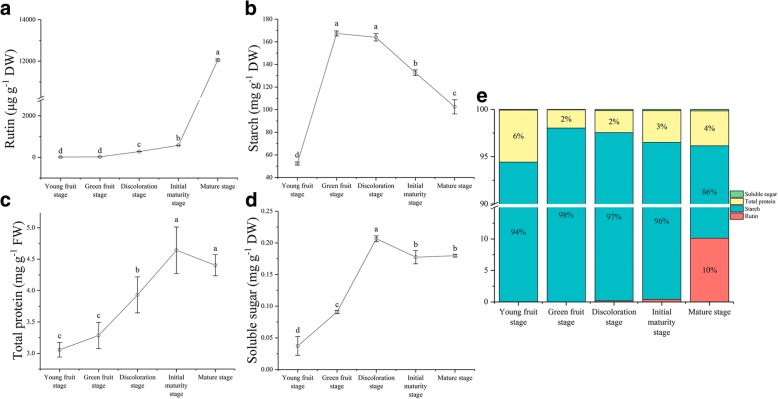
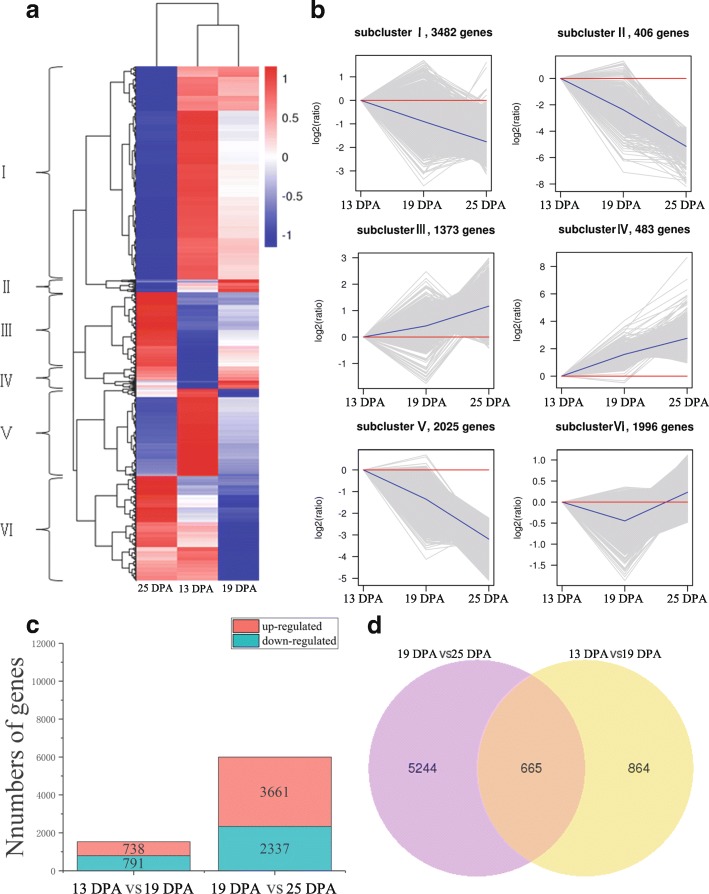
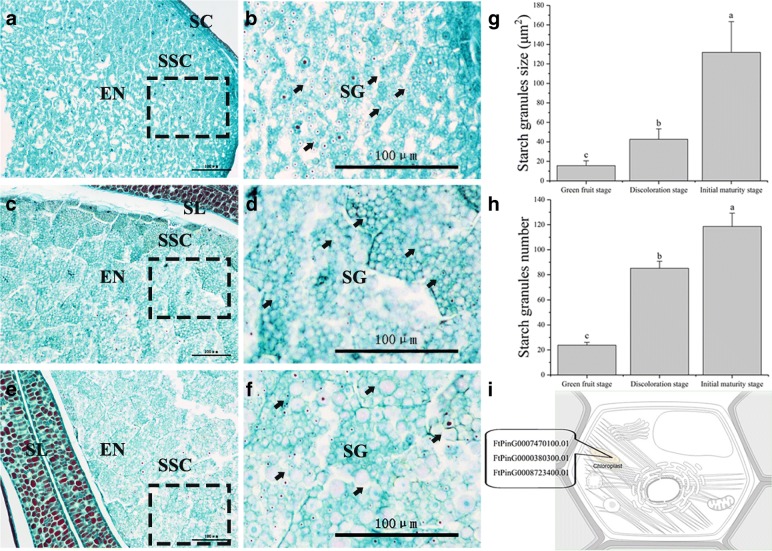
Results: Here, we characterized the seed development of tartary buckwheat using light and electron microscopy and measured phytohormone and nutrient accumulation by using high performance liquid chromatography (HPLC) and by profiling the expression of key genes using RNA sequencing with the support of the tartary buckwheat genome. We first divided the development of tartary buckwheat seed into five stages that include complex changes in development, morphology, physiology and phytohormone levels. At the same time, the contents of phytohormones (gibberellin, indole-3-acetic acid, abscisic acid, and zeatin) and nutrients (rutin, starch, total proteins and soluble sugars) at five stages were determined, and their accumulation patterns in the development of tartary buckwheat seeds were analyzed. Second, gene expression patterns of tartary buckwheat samples were compared during three seed developmental stages (13, 19, and 25 days postanthesis, DPA), and 9 765 differentially expressed genes (DEGs) were identified. We analyzed the overlapping DEGs in different sample combinations and measured 665 DEGs in the three samples. Furthermore, expression patterns of DEGs related to phytohormones, flavonoids, starch, and storage proteins were analyzed. Third, we noted the correlation between the trait (physiological changes, nutrient changes) and metabolites during seed development, and discussed the key genes that might be involved in the synthesis and degradation of each of them.

Conclusion: We provided abundant genomic resources for tartary buckwheat and Polygonaceae communities and revealed novel molecular insights into the correlations between the physiological changes and seed development of tartary buckwheat.

Keywords: RNA sequencing (RNA-seq); nutrition; phytohormones; seed development; tartary buckwheat; transcriptome.


Conflict of interest statement

Ethics approval and consent to participate

This study did not directly involve humans or animals.

Seeds of tartary buckwheat (Xiqiao No. 2) were collected in 2016 from the experimental field of the College of Life Science, Sichuan Agricultural University (Lat. 29°97’ N, 102°97’ E, Alt. 580 m), China. Collection of plant materials complied with the institutional, national and international guidelines. The research conducted complied with all institutional and national guidelines.

Consent for publication

Not applicable.

Competing interests

The authors declare that they have no competing interests.

Publisher’s Note

Springer Nature remains neutral with regard to jurisdictional claims in published maps and institutional affiliations.

Figures

Fig. 1
Fig. 1
Observation and measurement of the development of tartary buckwheat seeds. a Five stages of tartary buckwheat seeds development. Top row shows each longitudinal sections of tartary buckwheat seeds at different developmental stages. Second row shows individual seeds at different developmental stages. Third row shows schematic representation of developmental stages studied during tartary buckwheat seed ontogeny. 13 DPA: Tartary buckwheat seed at green fruit stage for transcriptome experiment; 19 DPA: Tartary buckwheat seed at discoloration stage for transcriptome experiment; 25 DPA: Tartary buckwheat seed at initial maturity stage for transcriptome experiment. DPA, days-post-anthesis. b The seed size and weight at different developmental stages. Error bars were obtained from five measurements. Small letter(s) above the bars indicate significant differences (α = 0.05, LSD) among treatments
Fig. 2
Fig. 2
Changes in the levels of GA3, IAA, ZT, and ABA during seed development in tartary buckwheat. a-d Changes of GA3, IAA, ZT, and ABA content during seed development in tartary buckwheat, respectively. e GA3 (red line), IAA (green line), ZT (black line), and ABA (blue line) content at different developmental stages. f Phytohormone ratio during seed development in tartary buckwheat. Error bars were obtained from three measurements for (a), (b), (c), (d) and (e). Small letter(s) above the bars indicate significant differences (α = 0.05, LSD) among treatments
Fig. 3
Fig. 3
Changes in the levels of nutrients at different development stages of tartary buckwheat seed. a-d Changes of rutin, starch, total protein, and soluble sugar content during seed development in tartary buckwheat, respectively. e Nutrients ratio during seed development in Tartary buckwheat. The error bars were obtained from five measurements. Small letter(s) above the bars indicate significant differences (α = 0.05, LSD) among treatments
Fig. 4
Fig. 4
The correlation between physiological changes and seed maturity during seed development (7 DPA to 30 DPA). Digit: Pearson’s correlation coefficient; Red: positively correlated; Blue: negatively correlated. * and ** indicate significant correlation at 0.05 and 0.01 levels, respectively
Fig. 5
Fig. 5
Distribution and quality of reads in different samples. a Distribution of overall mapped reads for all samples in the different regions. b Overall results of paired-end reads (PEs) for all samples mapped to the reference genome. c Correlation between samples. d Principal component analysis (PCA) among biological replicates. e Gene expression distribution (FPKM) in three samples
Fig. 6
Fig. 6
DEGs in three samples. a Heat map of scaled FPKM values in three samples 13 DPA, 19 DPA, and 25 DPA. Red: high expression; Blue: low expression. b Expression profile of six clusters correspondance to the Hierarchical cluster result. c Number of up- and down-regulated DEGs in two sample pairs 13 DPA vs 19 DPA, and 19 DPA vs 25 DPA. d Venn diagram of the numbers of expressed genes in sample pairs 13 DPA vs 19 DPA, and 19 DPA) vs 25 DPA
Fig. 7
Fig. 7
DEGs related to phytohormones in three samples. a Hierarchical cluster of the DEGs related to phytohormones in X2 (13 DPA), X3 (19 DPA), and X4 (25 DPA). Red: high expression; Blue: low expression. b Scatterplot of KEGG pathway enrichment in X2 (13 DPA) vs X3 (19 DPA) (FDR< 0.05). c Scatterplot of KEGG pathway enrichment in X3 (19 DPA) vs X4 (25 DPA) (FDR< 0.05). Rich factor is the ratio of the number of DEGs to the number of background genes in a KEGG pathway. d GO classification of DEGs in X2 (13 DPA) vs X3 (19 DPA) (FDR< 0.05). e GO classification of DEGs in X3 (19 DPA) vs X4 (25 DPA) (FDR< 0.05). The top 30 enriched GO classifications are listed. Stars above bars indicate the amounts of differentially expressed genes are significantly higher or lower than the amounts of genes in random samples from the GO classification of all genes. f DEGs related to phytohormones enriched biological processes in X3 (19 DPA) vs X4 (25 DPA). g DEGs related to phytohormones enriched cellular component in X3 (19 DPA) vs X4 (25 DPA). h DEGs related to phytohormones enriched molecular function in X3 (19 DPA) vs X4 (25 DPA). The different color frames indicate the extent of significance. Yellow: significant; Red: extremely significant. i Number of up- and down-regulated DEGs in two sample pairs X2 (13 DPA) vs X3 (19 DPA), and X3 (19 DPA) vs X4 (25 DPA)
Fig. 8
Fig. 8
Enlargement of embryo cell during tartary buckwheat seed development. a, c, e, g and i Microscopic longitudinal sections of Tartary buckwheat seeds at 7, 13, 19, 25 and 30 DPA, respectively. b, d, f, h and j are the enlarged view of the boxes in (a), (c), (e), (g) and (i), respectively. SC (Seed cover). EM (Embryo). SL (Seminal leaf). The arrow represents the cell being measured. Bars = 100μm. (k) Embryo cell size at 7, 13, 19, 25 and 30 DPA. Error bars were obtained from five measurements. Small letter(s) above the bars indicate significant differences (α = 0.05, LSD) among treatments. (l) Subcellular location of DEGs related to embryo cell enlargement. This section provides information on the location in the cell (Graphics by Christian Stolte). m A simplified representation of the plant hormone signal transduction pathway of cell enlargement (adopted from the KEGG PATHWAY Database: http://www.genome.jp/kegg/pathway.html) shows the following: auxin influx carrier (AUX1), transport inhibitor response 1 (TIR1), auxin-responsive protein IAA (AUX/IAA), auxin response factor (ARF), auxin responsive GH3 gene family (CH3), and SAUR family protein (SAUR). The expression value of each gene is colored in log10(FPKM) in three samples X2 (13 DPA), X3 (19 DPA), and X4 (25 DPA)
Fig. 9
Fig. 9
DEGs involved in the plant hormone signal transduction pathway of seed dormancy. a Corresponding ratios of ABA to GA3 at different development stages of Tartary buckwheat seed. b Subcellular location of DEGs related to seed dormancy. This section provides information on the location in the cell (Graphics by Christian Stolte). c A simplified representation of the plant hormone signal transduction pathway of seed dormancy (adopted from the KEGG PATHWAY Database: http://www.genome.jp/kegg/pathway.html) shows the following: abscisic acid receptor PYR/PYL family (PYR/PYL), protein phosphatase 2C (PP2C), serine/threonine-protein kinase SRK2 (SnRK2), and ABA responsive element binding factor (ABF). The expression value of each gene is colored in log10(FPKM) in three samples X2 (13 DPA), X3 (19 DPA), and X4 (25 DPA)
Fig. 10
Fig. 10
Comparison of starch granules morphology during different development stages of tartary buckwheat seed. a, c, and e Microscopic longitudinal sections of Tartary buckwheat seeds at 13, 19, and 25 DPA, respectively. b, d, and f are the enlarged view of the boxes in (a), (c), and (e), respectively. SC (Seed cover). EN (Endosperm). SL (Seminal leaf). SSC (Starch storage cells). SG (Starch granules). The arrow represents the cell being measured. Bars = 100μm. g Starch granules size at 13 DPA, 19 DPA, and 25 DPA. h Starch granules number (Average of total starch granules in each starch storage cell) at 13 DPA, 19 DPA, and 25 DPA. Error bars were obtained from five measurements for (g) and (h). Small letter(s) above the bars indicate significant differences (α = 0.05, LSD) among treatments. i Subcellular location of DEGs related to starch biosynthesis. This section provides information on the location in the cell (Graphics by Christian Stolte)
Fig. 11
Fig. 11
DEGs involved in rutin biosynthesis pathway. a RT- qPCR confirmation of 9 rutin biosynthesis related genes. b A simplified representation of the flavonoid biosynthetic pathway (adopted from the KEGG PATHWAY Database: http://www.genome.jp/kegg/pathway.html) shows the following enzymes: phenylalanine ammonia-lyase (PAL), cinnamate-4-hydroxylase (C4H), 4-coumarate Co A ligase (4CL), chalcone synthase (CHS), chalcone isomerase (CHI), flavanone-3’-hydroxylase (F3’H), flavanone-3-hydroxylase (F3H), flavonol synthase (FLS), glucosyl/rhamnosyl transferase, and flavanone-3’-5’-hydroxylase (F3’5’H). The expression value of each gene is colored in log10(FPKM) in three samples X2 (13 DPA), X3 (19 DPA), and X4 (25 DPA). * indicate the gene was differentially expressed during 13 DPA to 25DPA

References

    1. Ohsako T, Yamane K, Ohnishi O. Two new Fagopyrum (Polygonaceae) species, F. gracilipedoides and F. jinshaense from Yunnan, China. Japanese J Genet. 2002;77(6):399–408. - PubMed
    1. Bankevich A, Nurk S, Antipov D, Gurevich AA, Dvorkin M, Kulikov AS, Lesin VM, Nikolenko SI, Pham S, Prjibelski AD. SPAdes: a new genome assembly algorithm and its applications to single-cell sequencing. J Comput Biol. 2012;19(5):455–477. doi: 10.1089/cmb.2012.0021. - DOI - PMC - PubMed
    1. Li A, S-p H. Flora of China. Volume 4: Fagopyrum tataricum. Flora China. 2004;5(1):322.
    1. Lee CC, Shen SR, Lai YJ, Wu SC. Rutin and quercetin, bioactive compounds from tartary buckwheat, prevent liver inflammatory injury. Food Funct. 2013;4(5):794–802. doi: 10.1039/c3fo30389f. - DOI - PubMed
    1. Matilla AJ, MatillaváZquez MA. Involvement of ethylene in seed physiology. Plant Sci. 2008;175(1–2):87–97. doi: 10.1016/j.plantsci.2008.01.014. - DOI

MeSH terms