. 2018 Sep 18;49(3):449-463.e6.
doi: 10.1016/j.immuni.2018.07.012. Epub 2018 Aug 28.

The Chemokine Receptor CCR8 Promotes the Migration of Dendritic Cells into the Lymph Node Parenchyma to Initiate the Allergic Immune Response

Affiliations

The Chemokine Receptor CCR8 Promotes the Migration of Dendritic Cells into the Lymph Node Parenchyma to Initiate the Allergic Immune Response

Caroline L Sokol et al. Immunity. .

Abstract

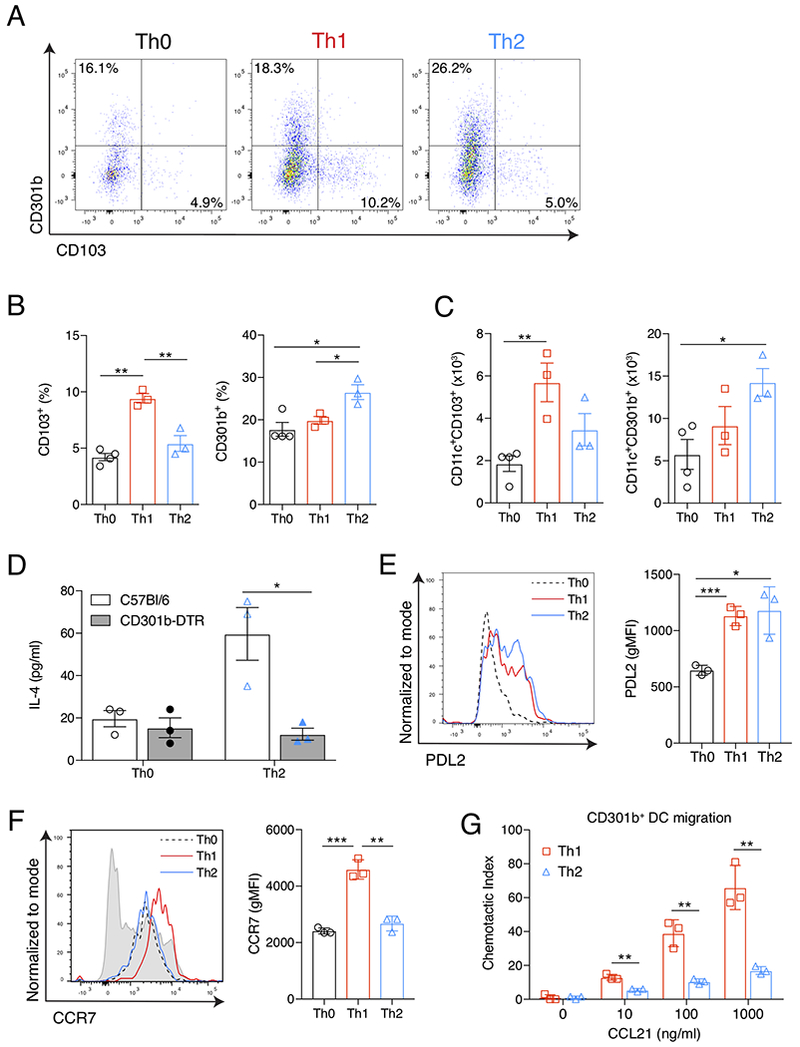
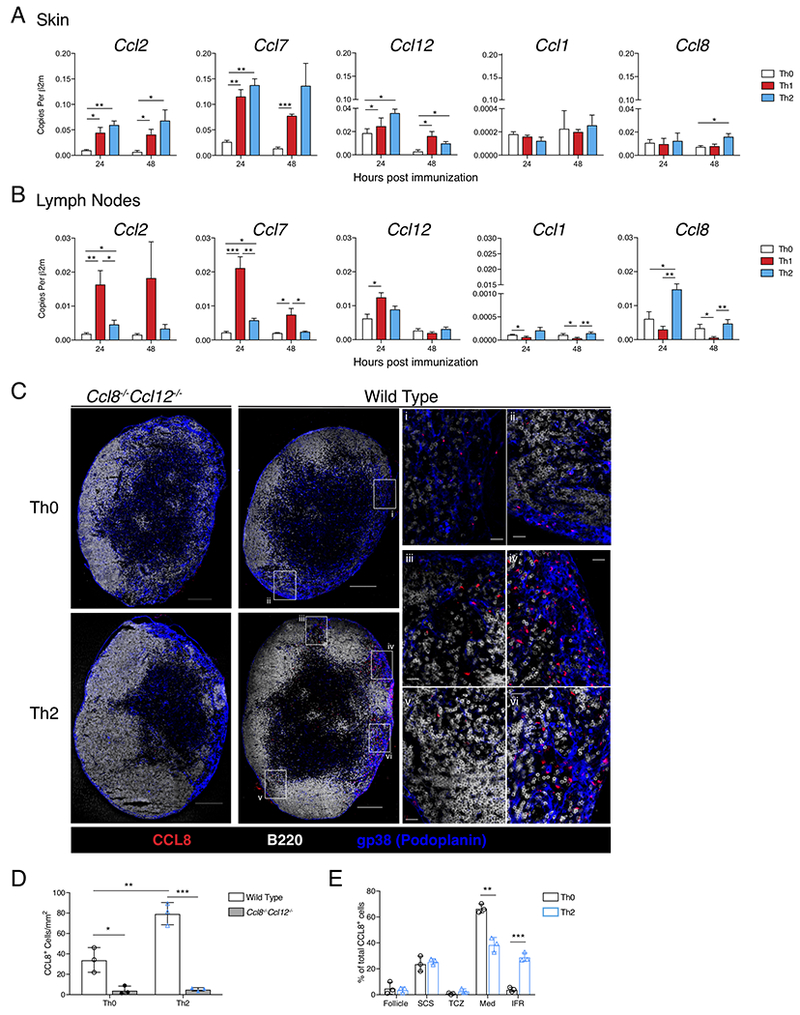
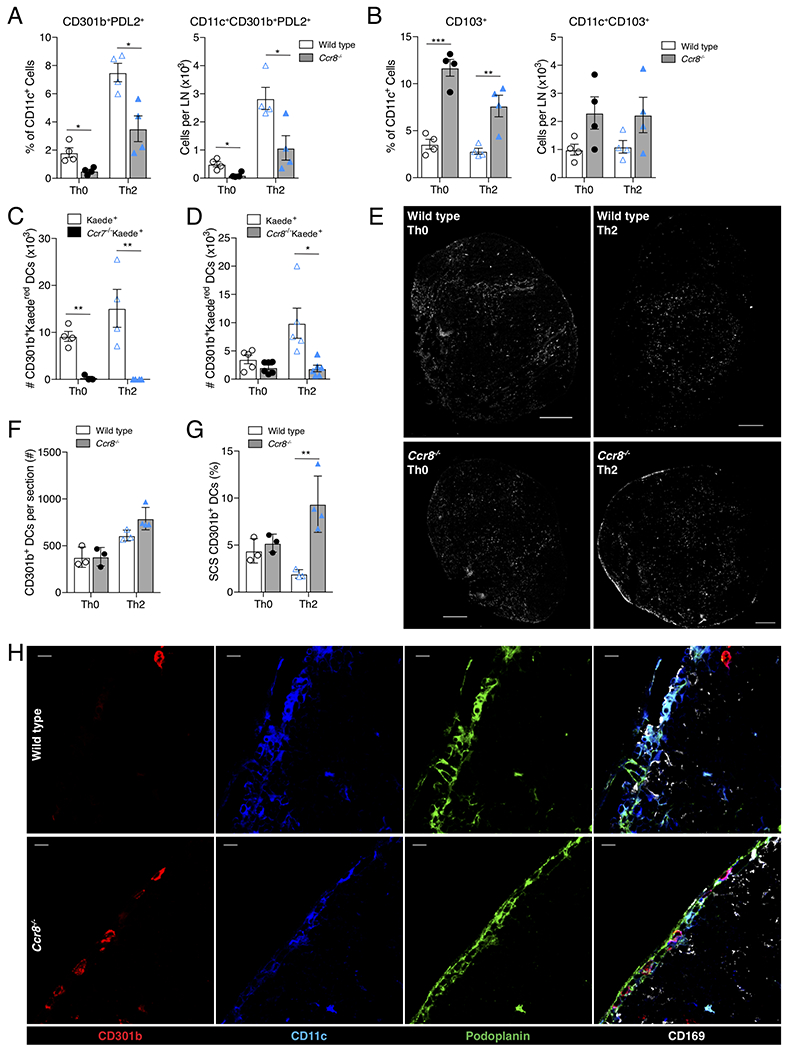
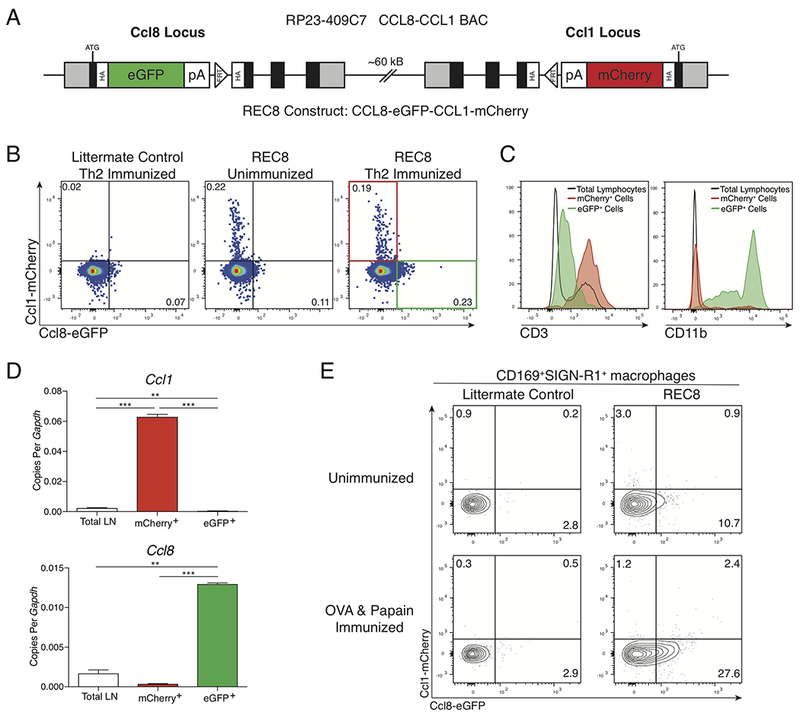
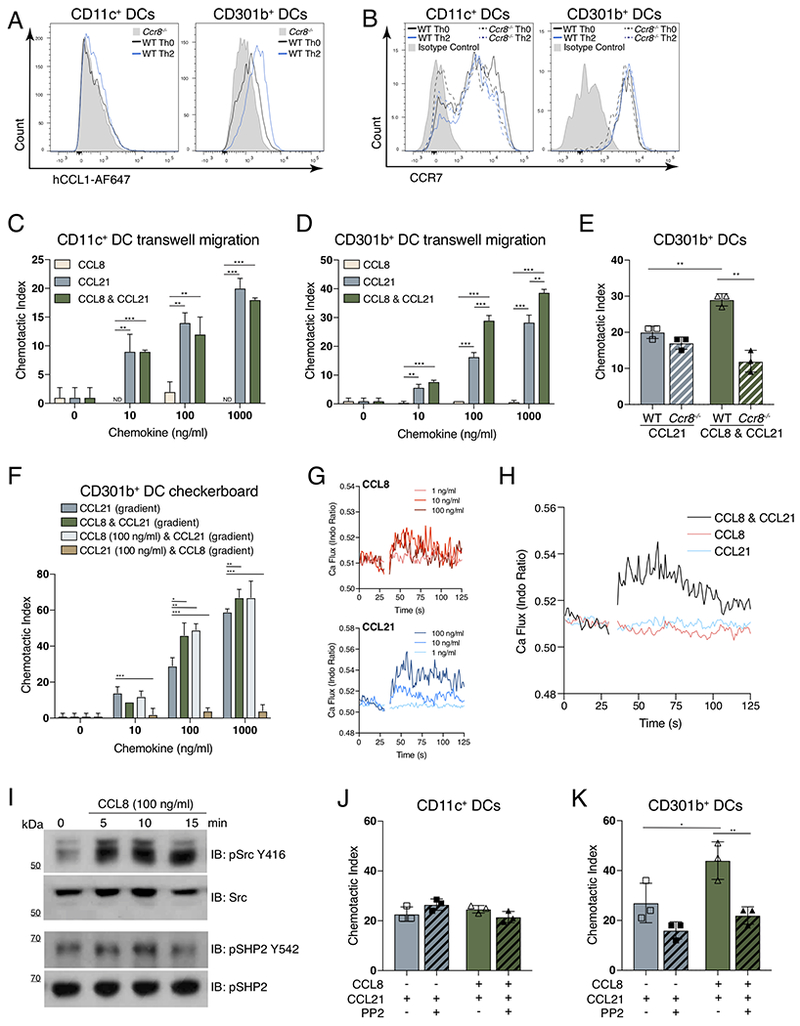
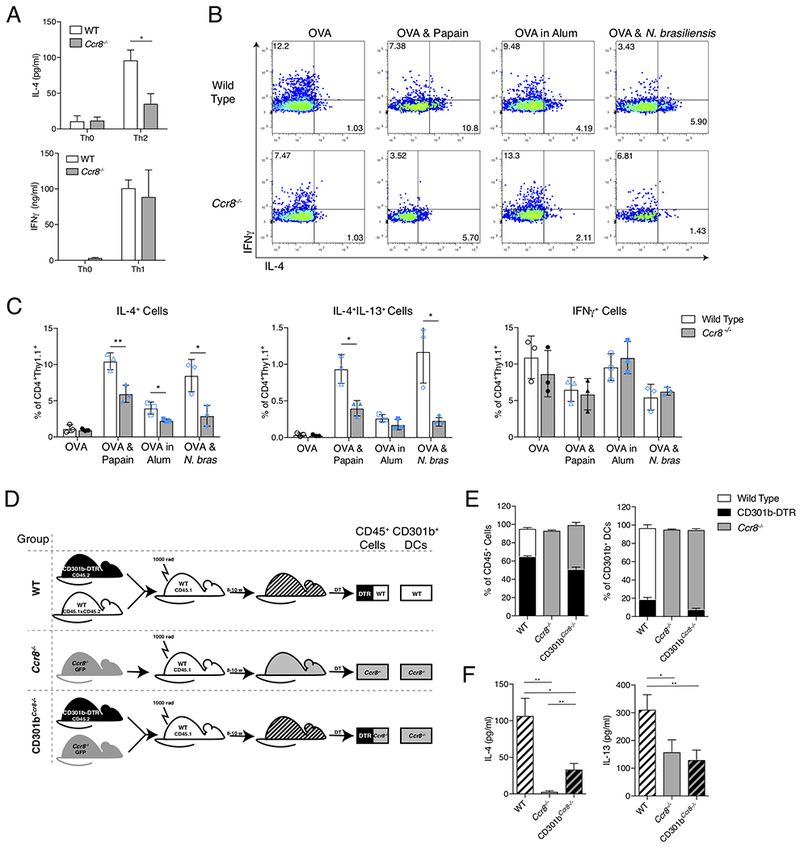
The migration of mature dendritic cells (DCs) into the draining lymph node (dLN) is thought to depend solely on the chemokine receptor CCR7. CD301b+ DCs migrate into the dLN after cutaneous allergen exposure and are required for T helper 2 (Th2) differentiation. We found that CD301b+ DCs poorly upregulated CCR7 expression after allergen exposure and required a second chemokine signal, mediated by CCR8 on CD301b+ DCs and its ligand CCL8, to exit the subcapsular sinus (SCS) and enter the lymph node (LN) parenchyma. After allergen exposure, CD169+SIGN-R1+ macrophages in interfollicular regions produced CCL8, which synergized with CCL21 in a Src-kinase-dependent manner to promote CD301b+ DC migration. In CCR8-deficient mice, CD301b+ DCs remained in the SCS and were unable to enter the LN parenchyma, resulting in defective Th2 differentiation. We have defined a CCR8-dependent stepwise mechanism of DC-subset-specific migration through which LN CD169+SIGN-R1+ macrophages control the polarization of the adaptive immune response.

Keywords: CCL8; CCR8; Th2 differentiation; allergy; chemokines; dendritic cells; lymph node; macrophages; migration; papain.


Conflict of interest statement

DECLARATION OF INTEREST

The authors declare no competing interests.

Figures

Figure 1:
Figure 1:. CD301b+ DCs specifically migrate in response to Th2-skewing immunization.
(A) Flow cytometric analysis of viable CD11c+ cells from the popliteal LNs of mice 24 hrs after footpad immunization with Th0- (OVA), Th1- (OVA, LPS & PolyI:C), or Th2-skewing (OVA & papain) immunizations. Numbers indicate percentage of CD11c+ cells in the indicated quadrant. (B) Quantification of percent CD103+ or CD301b+ cells out of total viable CD11c+ cells and (C) total number CD11c+CD103+ or CD11c+CD301b+ cells from the dLN as gated for in (A), 24 hrs after the indicated immunization. (D) ELISA of IL-4 in supernatant of LN cultures from WT (white bars) or CD301b-DTR mice (gray bars) after in vitro restimulation with OVA. All mice received DT and 2.5×10⁶ CD4+ OTII cells prior to indicated immunization. (E) Surface expression of PDL2 and (F) CCR7 from viable CD11c+CD301b+ cells taken from the dLN 24 hrs after the indicated immunization and displayed compared to total CD11c+ cells from Th0-immunized mouse (gray shaded histogram). (G) Transwell chemotaxis to CCL21 of CD11c+CD301b+ cells sorted from the dLN 24 hrs after Th2-skewing immunization. Chemotactic index reflects the number of cells migrating through the Transwell at the indicated concentration over that of media alone. In all experiments, bars indicate mean values of individual data points presented. Error bars indicate SEM. Data are representative experiments from 3 independent experiments with 3-4 mice (A-F) or 3 replicates (G) each. * p<0.05, ** p<0.01, *** p<0.001, Student’s T test. See also Figure S1.
Figure 2:
Figure 2:. Allergen immunization promotes a specific chemokine signature in the dLN.
(A) QPCR analysis of footpad skin immunization site and (B) popliteal LN, 24 and 48 hrs after immunization with Th0-, Th1-, or Th2-skewing immunizations. Data is expressed as cDNA copies of indicated gene per copies of β2m. Each bar represents the mean of 3-6 mice from a representative of 4 independent experiments. Error bars indicate SEM. (C) CCL8 protein staining in whole LNs. Popliteal LNs of WT or Ccl8−/−Ccl12−/− mice were harvested 24 hrs after immunization. Confocal immunofluorescence of whole LNs shows CCL8 (red), B220 (white), and gp38 (blue), scale bar indicates 200μm. Insets show medullary (i) and medullary/follicular border (ii) in Th0-immunized WT mouse. In Th2-immunized WT mouse, insets show interfollicular regions (IFR) (iii, iv, and v) and medullary region (vi). Scale bar in insets indicates 20 μm. (D) Total CCL8+ cells per mm2 of LN section from WT and Ccl8−/−Ccl12−/− mice 24 hours after Th0 or Th2-immunization. (E) Percent of CCL8+ cells in each indicated region out of total CCL8+ cells per LN section in wild type Th0 or Th2-immunized mice: Follicle (B cell follicle), SCS (subcapsular sinus), TCZ (T cell zone), Med (medullary region), IFR. Data shown is a representative section from 3 mice used in each of 3 independent experiments. * p<0.05, ** p<0.01, *** p<0.001, Student’s T test. See also Figure S2.
Figure 3:
Figure 3:. CCR8 is required for CD301b+ DC entry into the dLN.
(A) Quantification of CD301b+PDL2+ DCs and (B) CD103+ DCs in the dLN of Th0 or Th2 immunized WT (clear bars) or Ccr8−/− (gray bars) mice as determined by flow cytometry. Percentages reflect percent of CD301b+PDL2+ or CD103+ out of total CD11c+ cells, numbers reflect total cells per popliteal LN. (C & D) Flow cytometry of inguinal LNs was performed 24 hrs after immunization of photoconverted flank skin of Kaede+ transgenic mice. (C) Total CD11c+CD301b+Kaedered (i.e., photoconverted) cells per inguinal LN are shown in comparison to Ccr7−/−Kaede+ and (D) Ccr8−/−Kaede+ groups. (E) CD301b staining (white) of whole popliteal LNs of WT or Ccr8−/− mice 24 hrs after Th0 or Th2 immunization. Scale bar indicates 200μm. (F) Quantification of total number CD11c+CD301b+ cells per entire LN section or (G) percent of total CD11c+CD301b+ within the SCS (identified by podoplanin and CD169 immunohistochemical staining) 24 hrs after immunization. (H) CD301b+ DCs within the SCS space of Ccr8−/− mice, but not WT mice, 24 hrs after Th2 immunization. Panels show single stains of CD301b (red), CD11c (blue), podoplanin (green), and overlay of those stains and CD169 (white). Scale bars indicate 10μm. Images (E & H) are one representative of 2-3 mice per condition and 4 independent experiments. Bar graphs represent mean value of individual mouse data points (3-6 mice per condition per experiment) taken from a representative of 3 independent experiments (A, B, D, F, G, H), or 2 independent experiments (C). Error bars represent SEM. * p<0.05, ** p<0.01, *** p<0.001, Student’s T test. See also Figure S3.
Figure 4:
Figure 4:. CCL8 is produced in the dLN by CD169+SIGN-R1+ LN macrophages that interact with CD301b+ DCs.
(A) Confocal immunofluorescence of whole popliteal LN (top) and area of interest (bottom) 24 hrs after Th2-skewing immunization in WT or Ccl8−/−Ccl12−/− mice as indicated. Panels show single stains of CCL8 (white), CD169 (blue), CD301b (red) and overlay. Scale bars in top panels represent 200μm, scale bars in bottom panels represent 10μm. Images are representative of 3 mice in each of 3 independent experiments. (B) Confocal immunofluorescence of whole popliteal LN with insets showing CD169+SIGN-R1+ macrophage populations in medullary regions (med) and IFR (IFR), as well as CD169+SIGN-R1 SCS macrophages in the SCS (SCS). CD169 (red), SIGN-R1 (white), gp38 (green), and B220 (blue). Scale bar in whole LN represents 200 μm, those in insets represent 10 μm. (C) QPCR analysis of total cells (Pre) or MACS positively selected SIGN-R1+ or SIGN-R1 cells from popliteal LNs. (D) Gating scheme to identify macrophage populations from total viable lymphocytes obtained 24 hours after Th2-immunization from dLN, and QPCR analysis of the indicated populations showing Ccl8 expression. Colored histograms correspond to colored gates. (E) QPCR from total LNs of control liposome- or clodronate-treated mice 24 hrs after Th2-mediated immunization. Data points are from individual mice (4-6) in one representative experiment out of three independent trials. (F) Decreased percentage and number of CD301b+ DCs in Ccl8−/−Ccl12−/− mice after Th2-skewing immunization, based on flow cytometry of viable CD11c+CD301b+ cells. Data points are from dLNs of individual mice (3-4) from one of three independent trials. Cells in (C) and (D) were obtained using enhanced enzymatic digestion, while those in (F) were obtained using routine enzymatic digestion. QPCR data presented as copies of indicated transcript over Gapdh. Bar graphs represent mean value of indicated data points, error bars represent SEM. * p<0.05, ** p<0.01, *** p<0.001, Student’s T test. See also Figure S4 and S5.
Figure 5:
Figure 5:. CCR8 ligands are differentially expressed in the dLN.
(A) Schematic of REC8 transgene construct indicating insertion of eGFP into the Ccl8 locus and mCherry into the Ccl1 locus of the RP23-409C7 BAC. Gray box, non-coding exons; black box, endogenous coding exons; green box, eGFP ORF; red box, mCherry ORF; clear box, HA tags or SV40 poly(A); clear triangle, Flippase Recognition Target (FRT) site. (B) Expression of mCherry and eGFP in total live dLN cells in unimmunized REC8 mice or in Th2-immunized REC8 mice or littermate control WT mice. Numbers are percent of total cells in indicated gates. (C) Expression of CD3 and CD11b in total live dLN cells (black), mCherry+ cells (red), or eGFP+ cells (green) gated as in (B), isolated from REC8 mice 24 hours after Th2-skewing immunization. (D) QPCR analysis of Ccl1 or Ccl8 expression in total LN (clear), or FACS sorted mCherry+ cells (red bar) and eGFP+ cells (green bar), gated as in (B) from dLNs harvested from REC8 mice 24 hours after Th2-skewing immunization. (E) Expression of mCherry and eGFP on live, CD11b+CD169+SIGN-R1+ cells harvested from dLN of unimmunized WT and REC8 mice and 24 hours after Th2-skewing immunization. Bar graphs represent mean value of replicates (2 data points per bar). Data shown are representative of three independent experiments, except (D) which is representative of two independent experiments. Error bars represent SEM. ** p<0.01, *** p<0.001, Student’s T test. See also Figure S5.
Figure 6:
Figure 6:. CCL8 synergizes with CCL21 to specifically promote CD301b+ DC migration.
(A) Flow cytometric expression hCCL1-AF647 binding to CD11c+CD11b+CD301b (CD11c+ DCs) or CD11c+CD11b+CD301b+ (CD301b+ DCs) cells obtained from dLNs of WT mice after the Th0 (black histogram) or Th2-skewing (blue histogram) immunization or from Ccr8−/− mice after Th0 immunization (gray shaded histogram). (B) Flow cytometric cell surface expression of CCR7 on CD11c+ DCs or CD301b+ DCs from the dLN after Th0-immunization in WT (black solid) or Ccr8−/− (black dotted) mice, or after Th2-immunization in WT (blue solid) or Ccr8−/− (blue dotted) mice. Isotype control from WT Th0-immunized mice is shown (gray shaded histogram). (C) Transwell chemotaxis of CD11c+ DCs or (D) CD301b+ DCs to indicated concentrations of CCL8, CCL21 or CCL8 & CCL21. (E) Transwell chemotaxis of CD301b+ DCs isolated from WT or Ccr8−/− mice to 100 ng/ml of indicated chemokines. (F) Checkerboard Transwell migration assay of CD301b+ DCs in response to CCL21 gradient alone (blue), CCL8 & CCL21 combined gradient (green), fixed CCL8 concentration and CCL21 gradient (light blue), and fixed CCL21 concentration and CCL8 gradient (brown). (G) Analysis of calcium flux in CD301b+ DCs, gap indicates addition of CCL8 or CCL21 at the indicated concentration. (H) Calcium flux in CD301b+ DCs, gap indicates addition of 1 ng/ml of CCL8 & CCL21 (black), CCL8 (pink), and CCL21 (blue). (I) Western blot of Src and SHP2 phosphorylation in serum-starved 4DE4 cells stably transfected with human CCR8. (J) Transwell chemotaxis of CD11c+ DCs or (K) CD301b+ DCs in response to 100 ng/ml of the indicated chemokines with or without 10μM PP2 (Src inhibitor). In all panels, cells were harvested from dLNs 24 hrs after the indicated immunization. (A, B, G & H) are representative graphs from four independent experiments, 3 mice per group. Cells were obtained by pooling dLNs from 30-50 mice (C-F, J, & K) or 12 mice (G-H) 24 hrs after Th2-immunization and using fluorescence activated cell sorting to obtain CD11c+ DCs or CD301b+ DCs. Bar graphs represent mean value of replicates (2-3 data points per bar), and are one representative trial of four independent experiments. Error bars represent SEM. * p<0.05, ** p<0.01, *** p<0.001, Student’s T test. See also Figure S6.
Figure 7:
Figure 7:. CCR8 on CD301b+ DCs is required for allergen-induced Th2 differentiation.
(A) IL-4 and IFNγ concentrations in supernatants following in vitro restimulation of total dLN cells from WT or Ccr8−/− mice after Th0 or Th2-skewing immunizations (IL-4) or Th0 or Th1-skewing immunizations (IFNγ). Mice received 2.5×10⁵ CD4+ OTII cells prior to immunization, dLNs were harvested 5 days after immunization for in vitro restimulation with OVA, and supernatants were obtained 4 days later. (B) Intracellular IL-4 and IFNγ staining of CD4+Thy1.1+ viable cells 4 days after OVA, OVA & Papain, or OVA in Alum immunization or 5 days after OVA & N. brasiliensis infection. Mice received 2.5-5×10⁵ naïve CD4+Thy1.1+ OTII cells prior to immunization Representative plots are shown with percentage of cells in quadrants indicated. (C) Quantification of IL-4+, IL4+IL-13+ or IFNγ+ staining of CD4+Thy1.1+ cells after immunization or infection as in (B). (D) Generation of BM chimeras. (E) Chimerism by flow cytometric analysis of total viable CD45+ cells and CD11c+CD301b+ DCs from popliteal LNs 3 days after last DT injection. (F) IL-4 and IL-13 concentrations in supernatants from in vitro restimulation of total LN cells from indicated BM chimeras. Chimeric mice received 2.5×10⁵ CD4+ OTII cells and DT prior to Th2-skewing immunization. dLNs were harvested 5 days after immunization and cultured with OVA for 4 days prior to supernatant harvest. Data shown is representative of 3 independent experiments (A-C) or 5 independent experiments (D & E), with 3-5 mice per condition in each experiment. Bar graphs represent mean value, error bars represent SEM. * p<0.05, ** p<0.01, *** p<0.001, Student’s T test. See also Figure S7.

Comment in

Similar articles

Cited by

References

    1. Asano K, Takahashi N, Ushiki M, Monya M, Aihara F, Kuboki E, Moriyama S, Iida M, Kitamura H, Qiu CH, et al. (2015). Intestinal CD169(+) macrophages initiate mucosal inflammation by secreting CCL8 that recruits inflammatory monocytes. Nat Commun 6, 7802. - PMC - PubMed
    1. Braun A, Worbs T, Moschovakis GL, Halle S, Hoffmann K, Bolter J, Munk A, and Forster R (2011). Afferent lymph-derived T cells and DCs use different chemokine receptor CCR7-dependent routes for entry into the lymph node and intranodal migration. Nat Immunol 12, 879–887. - PubMed
    1. Bromley SK, Yan S, Tomura M, Kanagawa O, and Luster AD (2013). Recirculating memory T cells are a unique subset of CD4+ T cells with a distinct phenotype and migratory pattern. J Immunol 190, 970–976. - PMC - PubMed
    1. Chensue SW, Lukacs NW, Yang TY, Shang X, Frait KA, Kunkel SL, Kung T, Wiekowski MT, Hedrick JA, Cook DN, et al. (2001). Aberrant in vivo T helper type 2 cell response and impaired eosinophil recruitment in CC chemokine receptor 8 knockout mice. J Exp Med 193, 573–584. - PMC - PubMed
    1. Chung CD, Kuo F, Kumer J, Motani AS, Lawrence CE, Henderson WR Jr., and Venkataraman C (2003). CCR8 is not essential for the development of inflammation in a mouse model of allergic airway disease. J Immunol 170, 581–587. - PubMed

Publication types