. 2018 Sep 18;49(3):413-426.e5.
doi: 10.1016/j.immuni.2018.07.006. Epub 2018 Aug 28.

Gasdermin D Restrains Type I Interferon Response to Cytosolic DNA by Disrupting Ionic Homeostasis

Affiliations

Gasdermin D Restrains Type I Interferon Response to Cytosolic DNA by Disrupting Ionic Homeostasis

Ishita Banerjee et al. Immunity. .

Abstract

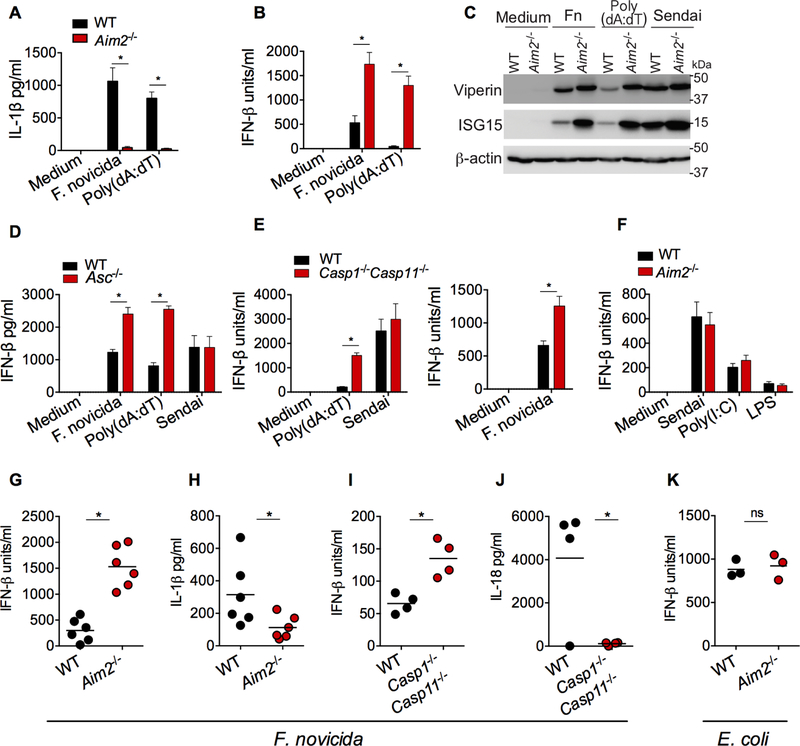
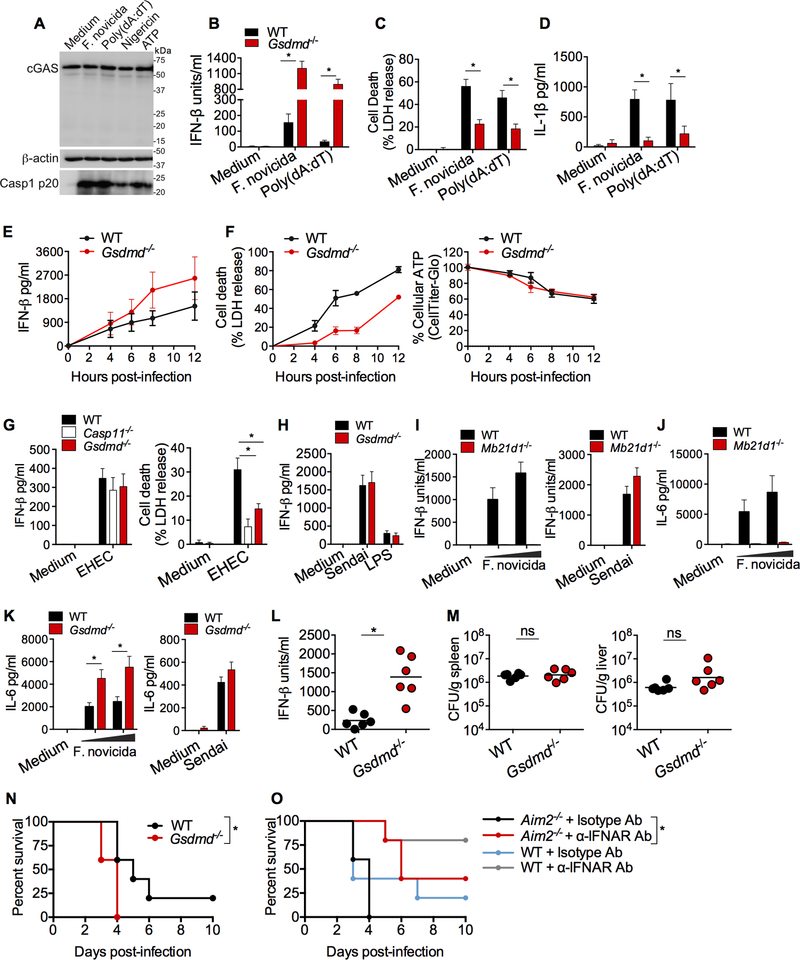
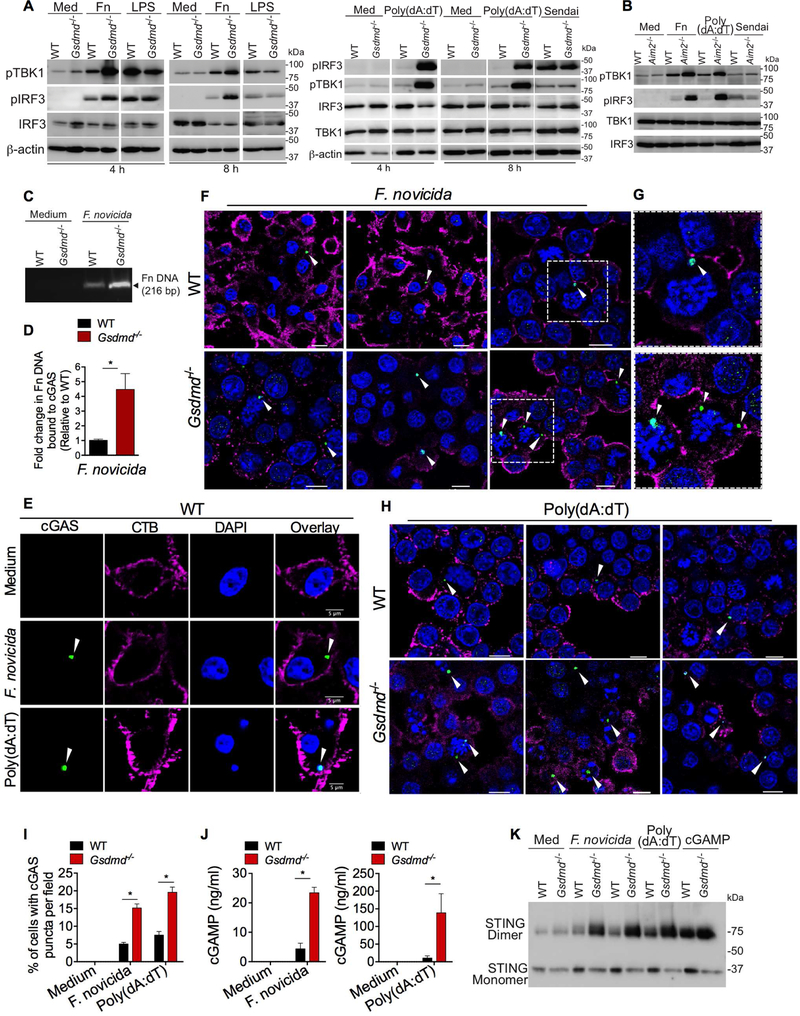
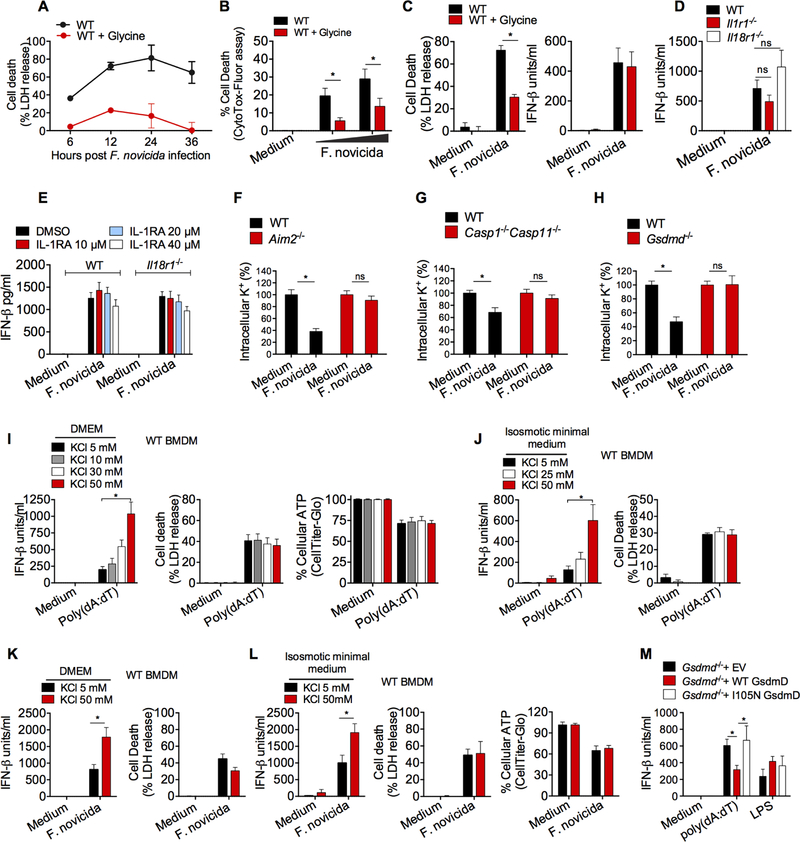
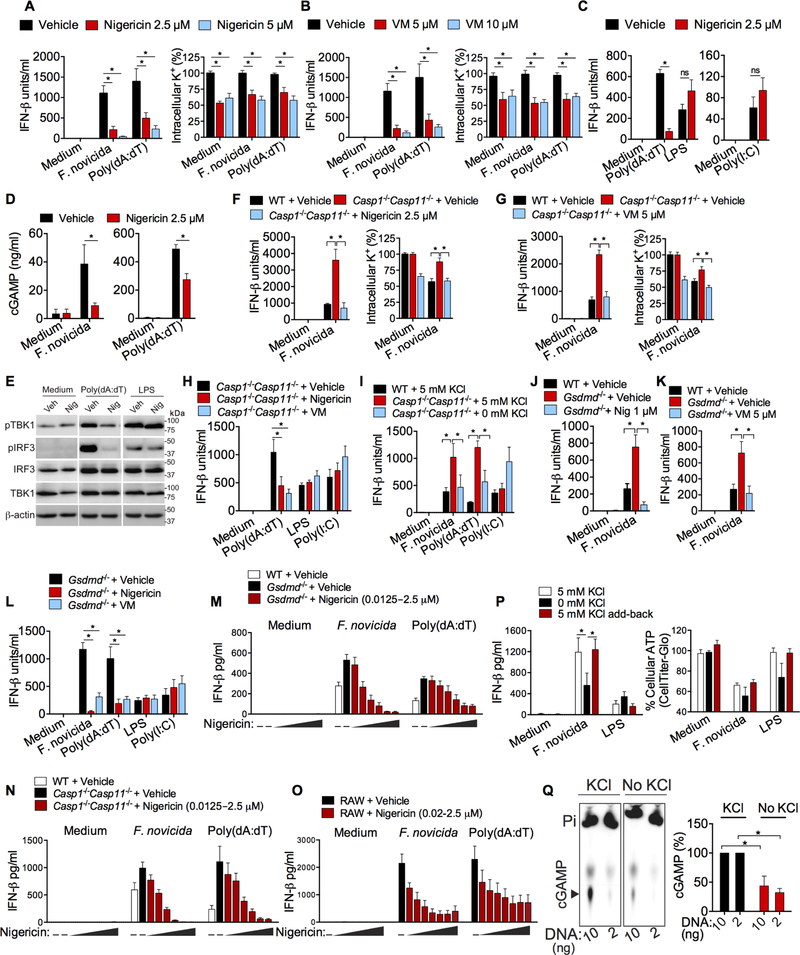
Inflammasome-activated caspase-1 cleaves gasdermin D to unmask its pore-forming activity, the predominant consequence of which is pyroptosis. Here, we report an additional biological role for gasdermin D in limiting cytosolic DNA surveillance. Cytosolic DNA is sensed by Aim2 and cyclic GMP-AMP synthase (cGAS) leading to inflammasome and type I interferon responses, respectively. We found that gasdermin D activated by the Aim2 inflammasome suppressed cGAS-driven type I interferon response to cytosolic DNA and Francisella novicida in macrophages. Similarly, interferon-β (IFN-β) response to F. novicida infection was elevated in gasdermin D-deficient mice. Gasdermin D-mediated negative regulation of IFN-β occurred in a pyroptosis-, interleukin-1 (IL-1)-, and IL-18-independent manner. Mechanistically, gasdermin D depleted intracellular potassium (K+) via membrane pores, and this K+ efflux was necessary and sufficient to inhibit cGAS-dependent IFN-β response. Thus, our findings have uncovered an additional interferon regulatory module involving gasdermin D and K+ efflux.

Keywords: Francisella; IFN-β; K(+); STING; cGAS; caspase-1; cytosolic DNA; gasdermin D; inflammasome; poly(dA:dT); potassium.


Conflict of interest statement

Declaration of interests: The authors declare no competing financial interests.

Figures

Figure 1.
Figure 1.. Aim2 inflammasome activation suppresses cytosolic DNA-induced type I interferon production.
(A and B) IL-1β (A) and IFN-β (B) in the supernatants of Pam3CSK4-primed wild-type (WT) and Aim2−/− BMDMs stimulated with F. novicida (MOI=50) or poly(dA:dT) for 6 h. (C) Immunoblots of viperin, ISG15 and β-actin in the lysates of WT and Aim2−/− iBMDMs stimulated with F. novicida (MOI=100), poly(dA:dT), or Sendai virus for 8 h. (D to F) IFN-β in the supernatants of BMDMs from WT, Asc−/− (D), Casp1−/−Casp11−/− (E), and Aim2−/− (F) mice stimulated with indicated treatments. (G-J) Cytokine quantities assessed 24 h post-infection (p.i) in the plasma of WT or indicated mutant mice infected s.c. with 5 × 10⁵ CFU of F. novicida. (K) Plasma IFN-β in WT and Aim2−/− mice 6 h after intraperitoneal infection with 1 × 10⁹ CFU of E. coli BL21. Combined data from three independent experiments are shown as mean ± SEM (A, B, D, E, and F). *, P <0.05; ns, not significant; two-way ANOVA followed by the Sidak’s post-test (A, B, D, and E) or unpaired two-tailed t test (G-K). In G-K, each circle represents a mouse and the horizontal lines represent mean and data are from one experiment representative of three. IFN-β data are presented as units/ml or pg/ml depending upon the recombinant IFN-β standard used in the ELISA.
Figure 2.
Figure 2.. Gasdermin D is required for inflammasome-mediated suppression of type I interferon production.
(A) Immunoblotting for cGAS and β-actin in the lysates and the cleaved caspase-1 (p20) in the methanol chloroform-precipitated supernatants of Pam3CSK4-primed WT BMDMs stimulated with F. novicida, poly(dA:dT), nigericin, or ATP. (B-D) IFN-β secretion (B), LDH release (C), and IL-1β secretion (D) by Pam3CSK4-primed WT and Gsdmd−/− iBMDMs stimulated with F. novicida or poly(dA:dT) for 6 h. (E-F) IFN-β secretion (E), LDH release, and cellular ATP (F) in WT and Gsdmd−/− primary BMDMs infected with F. novicida (MOI=100) at 4, 6, 8 and 12 h p.i. (G) IFN-β secretion and LDH release by WT, casp11−/− and Gsdmd−/− primary BMDMs infected with EHEC (MOI=50) at 16 h p.i. (H) IFN-β in the supernatants of WT and Gsdmd−/− BMDMs stimulated with Sendai virus or LPS for 6 h. (I-K) IFN-β (I) or IL-6 (J and K) in the supernatants of BMDMs of indicated genotypes infected with F. novicida (MOI of 25 and 50) or Sendai virus for 6 h. (L and M) IFN-β in the plasma (L) and the bacterial load in the spleen and liver (M) of WT and Gsdmd−/− mice infected s.c. with 1.5 × 10⁵ CFU of F. novicida at 24 h p.i. (N) Survival of WT and Gsdmd−/− mice (n=5) infected s.c. with 2.5 × 10² CFU of F. novicida. (O)Survival of WT and Aim2−/− mice (n=5) infected s.c. with 2.5 × 10² CFU of F. novicida and injected i.p. with 250 μg of an isotype control or anti-IFNAR antibody 12 h p.i. Combined data from three independent experiments are shown as mean ± SEM (B-K). *, P <0.05; ns, not significant; two-way ANOVA followed by the Sidak’s post-test (B, C, D, G, and K), unpaired two-tailed t test (L and M), or Mantel-Cox test (N and O). In L and M, each circle represents a mouse and the horizontal lines represent mean. Data in L-O are from one experiment representative of three (L and M) or two (N and O). IFN-β data are presented as units/ml or pg/ml depending upon the recombinant IFN-β standard used in the ELISA. See also Figure S1.
Figure 3.
Figure 3.. Gasdermin D suppresses cytosolic DNA-induced IFN-β by targeting cGAS.
(A) Immunoblots of pIRF3, pTBK1, IRF3, TBK1, and β-actin in the lysates of WT and Gsdmd−/− BMDMs stimulated with indicated treatments for indicated times. Med, medium; Fn, F. novicida. (B) Immunoblots of pIRF3, pTBK1, IRF3, and TBK1 in the lysates of WT and Aim2−/− BMDMs stimulated with indicated treatments for 8 h. (C-D) PCR analysis of F. novicida DNA recovered from cGAS immunoprecipitates from WT and Gsdmd−/− BMDMs stimulated with F. novicida for 6 h. Agarose gel image of PCR products (C). Fold increase in cGAS-associated F. novicida DNA in Gsdmd−/− BMDMs over that of wild-type BMDMs as revealed by quantitative PCR (D). Fn, F. novicida. (E-I) Confocal images of WT and Gsdmd−/− BMDMs stimulated with F. novicida or poly(dA:dT) for 5 h. Cells were stained with an antibody for cGAS (green), cholera toxin B for plasma membrane (magenta), and DAPI for nucleus and DNA (blue) (E-H). Arrowheads indicate cGAS puncta. Three different fields per genotype for F. novicida and poly(dA:dT) stimulations are shown in F and H, respectively (merged images). Enlarged images of the boxed areas in F are shown in G. Quantification was done by counting the cells containing cytosolic cGAS puncta in 30 fields with approximately 20 cells each (I). Scale bar, 5 μM (E) or 10 μM (F and H). (J) cGAMP amounts in WT and Gsdmd−/− BMDMs stimulated with F. novicida or poly(dA:dT) for 5 h as measured by LC-MS. (K) STING monomers and dimers in the lysates of WT and Gsdmd−/− BMDMs stimulated with F. novicida (MOIs of 50 and 100), poly(dA:dT), or cGAMP for 6 h as assessed by nonreducing PAGE and immunoblotting. Med, medium. Combined data from three independent experiments are shown as mean ± SEM. *, P <0.05; unpaired two-tailed t test (D) or two-way ANOVA followed by the Sidak’s post-test (I and J). Scale represents 5 μM (E) or 10 μM (F and H). See also Figure S2.
Figure 4.
Figure 4.. Gasdermin D suppresses type I interferon production by inducing K+ efflux.
(A) Cell death in WT BMDMs infected with F. novicida for 6, 12, 24 and 36 h in the presence or absence of glycine as assessed by LDH release. (B) Cell death in WT BMDMs infected with F. novicida for 6 h in the presence or absence of glycine as assessed by CytoTox-Fluor assay. (C)LDH release and secretion of IFN-β by WT BMDMs infected with F. novicida for 6 h in the presence or absence of glycine. (D)IFN-β in the supernatants of WT, Il1r1−/− or Il18r1−/− BMDMs following infection with F. novicida for 6 h. (E)IFN-β in the supernatants of F. novicida-infected WT and Il18r1−/− BMDMs treated with DMSO or IL-1R antagonist at the indicated concentrations. (F-H) Intracellular K+ as assessed by APG4 staining in WT, Aim2−/− (F), Casp1−/−Casp11−/− (G), and Gsdmd−/− (H) in uninfected and F. novicida-infected BMDMs at 6 h p.i. (in the presence of glycine). (I to L) IFN-β secretion, cell death (assessed by LDH release assay), and cell viability (assessed by CellTiter-Glo assay) in WT BMDMs stimulated with poly(dA:dT) or F. novicida as indicated for 6 h in DMEM (I and K) or isosmotic minimal medium (J and L) supplemented with indicated amounts of KCl. (M) IFN-β in the supernatants of Gsdmd−/− iBMDMs reconstituted with the empty vector (EV), WT gasdermin D, or I105N mutant gasdermin D in response to poly(dA:dT) transfection and LPS stimulation. Combined data from three (B-M) or two (A) independent experiments are shown as mean ± SEM. *, P <0.05; ns, not significant; two-way ANOVA followed by the Sidak’s post-test. IFN-β data are presented as units/ml or pg/ml depending upon the recombinant IFN-β standard used in the ELISA. See also Figure S3.
Figure 5.
Figure 5.. Induction of K+ efflux in inflammasome-deficient macrophages is sufficient to reduce cytosolic DNA-induced type I interferon response.
(A and B) IFN-β in the supernatants of and intracellular K+ (at 6 h post-stimulation) in RAW macrophages stimulated with F. novicida (MOI of 50) or poly(dA:dT) and treated at 1.5–2 h after stimulations with vehicle (ethanol), 2.5 or 5 μM nigericin (A) or 5 or 10 μM valinomycin (VM; B). (C) IFN-β in the supernatants of RAW macrophages stimulated with poly(dA:dT), LPS (1 μg/ml) or poly(I:C) (40 μg/ml) and treated at 1.5–2 h after stimulations with 2.5 μM nigericin. (D) cGAMP amounts in RAW macrophages 5 h after stimulated with F. novicida or poly(dA:dT) and treated at 1.5–2 h after stimulations with 2.5 μM nigericin as measured by LC-MS. (E) Immunoblots of pIRF3, pTBK1, IRF3, TBK1, and β-actin in lysates of RAW macrophages stimulated with poly(dA:dT) or LPS and treated with vehicle (Veh) or 2.5 μM nigericin (Nig). (F and G) IFN-β in the supernatants of and intracellular K+ in WT and Casp1−/−Casp11−/− BMDMs (measured at 6 h post-infection) infected with F. novicida and treated with vehicle (ethanol), 2.5 μM nigericin (F), or 5 μM valinomycin (VM; G) 1.5–2 h post-infection. (H) IFN-β amounts in the supernatants of Casp1−/−Casp11−/− BMDMs (measured at 6 h post- stimulation) stimulated with poly(dA:dT), LPS, or poly(I:C) and treated with vehicle, 2.5 μM nigericin or 5 μM valinomycin (VM). (I)IFN-β in the supernatants of F. novicida-, poly(dA:dT)-, or poly(I:C)-stimulated WT BMDMs incubated in isosmotic minimal medium containing 5 mM KCl and Casp1−/−Casp11−/− BMDMs incubated in isosmotic minimal medium containing 5 or 0 mM KCl. (J and K) IFN-β in the supernatants of WT and Gsdmd−/− BMDMs (measured at 6 h post- infection) infected with F. novicida and treated with vehicle, nigericin (J), or valinomycin (VM; K) at the indicated concentrations 1.5–2 h post-infection. (L) IFN-β in the supernatants of Gsdmd−/− BMDMs (measured at 6 h post-stimulation) stimulated with F. novicida, poly(dA:dT), LPS, or poly(I:C) and treated with vehicle, 2.5 μM nigericin, or 5 μM valinomycin (VM). (M-O) IFN-β in the supernatants of indicated macrophages (at 6 h post-stimulation) stimulated with F. novicida (MOI of 50) or poly(dA:dT) and treated at 1.5–2 h after stimulations with vehicle (ethanol) or increasing concentrations of nigericin (0.0125–2.5 μM). (P) IFN-β in the supernatants of and intracellular ATP in Gsdmd−/− BMDMs (at 6 h post- stimulation) stimulated with F. novicida or LPS. After 1 h of stimulation cells were incubated in isosmotic minimal medium containing 5 mM or 0 mM KCl and 1 h later, KCl was added back to cells incubated in isosmotic minimal medium without KCl to restore K+ concentration in the medium to 5 mM. (Q) cGAMP synthesis by recombinant cGAS incubated with DNA (10 and 2 ng), radioactive ATP, and GTP with or without 10 mM KCl as analyzed by thin-layer chromatography (TLC) and autoradiography. Arrowhead indicates cGAMP. cGAMP in TLC were quantified and expressed, within each DNA concentration, as percent relative to ‘with KCl’ condition, which is considered as 100%. Combined data from three (A-D and F-P) or two (Q) independent experiments are shown as mean ± SEM. *, P <0.05; two-way ANOVA followed by the Sidak’s post-test. IFN-β data are presented as units/ml or pg/ml depending upon the recombinant IFN-β standard used in the ELISA. See also Figures S4 and S5.

Comment in

Similar articles

Cited by

References

    1. Aglietti RA, Estevez A, Gupta A, Ramirez MG, Liu PS, Kayagaki N, Ciferri C, Dixit VM, and Dueber EC (2016). GsdmD p30 elicited by caspase-11 during pyroptosis forms pores in membranes. Proceedings of the National Academy of Sciences 113, 7858–7863. - PMC - PubMed
    1. Auerbuch V, Brockstedt DG, Meyer-Morse N, O’Riordan M, and Portnoy DA (2004). Mice lacking the type I interferon receptor are resistant to Listeria monocytogenes. J Exp Med 200, 527–533. - PMC - PubMed
    1. Bergsbaken T, Fink SL, and Cookson BT (2009). Pyroptosis: host cell death and inflammation. Nat. Rev. Microbiol 7, 99–109. - PMC - PubMed
    1. Burdette DL, Monroe KM, Sotelo-Troha K, Iwig JS, Eckert B, Hyodo M, Hayakawa Y, and Vance RE (2011). STING is a direct innate immune sensor of cyclic di-GMP. Nature 478, 515–518. - PMC - PubMed
    1. Chen Q, Sun L, and Chen ZJ (2016). Regulation and function of the cGAS–STING pathway of cytosolic DNA sensing. Nature Immunology 17, 1142–1149. - PubMed

Publication types

MeSH terms