. 2018 Dec 15;24(24):6471-6482.
doi: 10.1158/1078-0432.CCR-18-1052. Epub 2018 Aug 31.

Rare but Recurrent ROS1 Fusions Resulting From Chromosome 6q22 Microdeletions are Targetable Oncogenes in Glioma

Affiliations

Rare but Recurrent ROS1 Fusions Resulting From Chromosome 6q22 Microdeletions are Targetable Oncogenes in Glioma

Monika A Davare et al. Clin Cancer Res. .

Abstract

Purpose: Gliomas, a genetically heterogeneous group of primary central nervous system tumors, continue to pose a significant clinical challenge. Discovery of chromosomal rearrangements involving kinase genes has enabled precision therapy, and improved outcomes in several malignancies.

Experimental design: Positing that similar benefit could be accomplished for patients with brain cancer, we evaluated The Cancer Genome Atlas (TCGA) glioblastoma dataset. Functional validation of the oncogenic potential and inhibitory sensitivity of discovered ROS1 fusions was performed using three independent cell-based model systems, and an in vivo murine xenograft study.

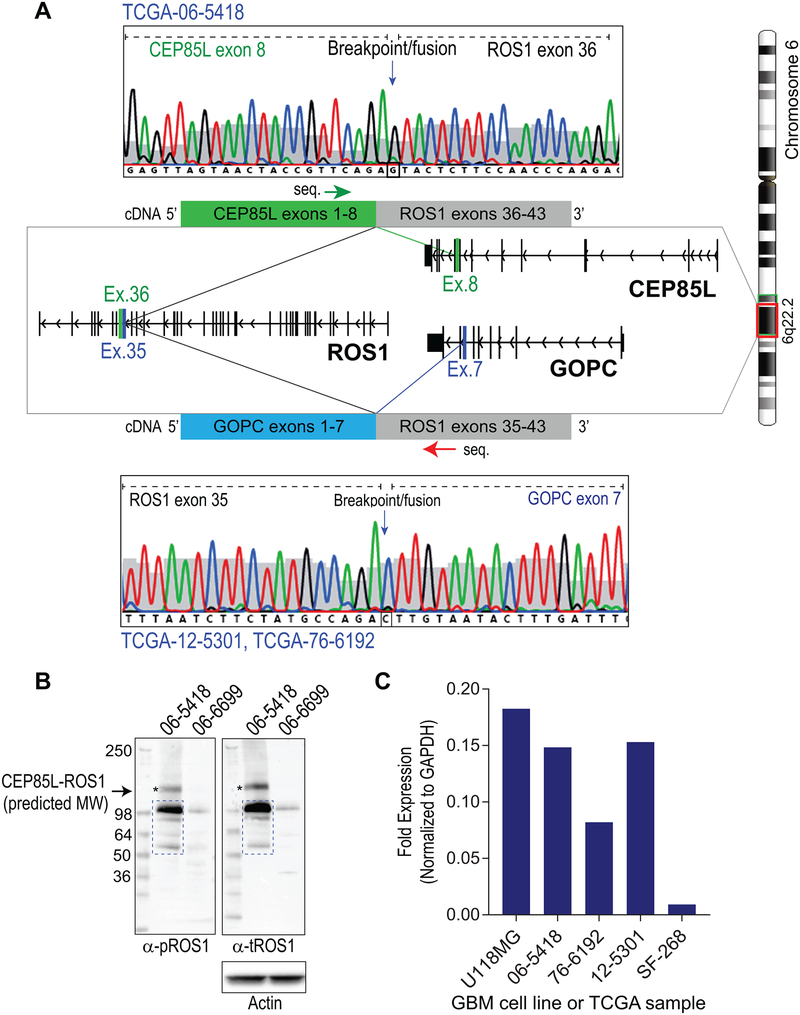
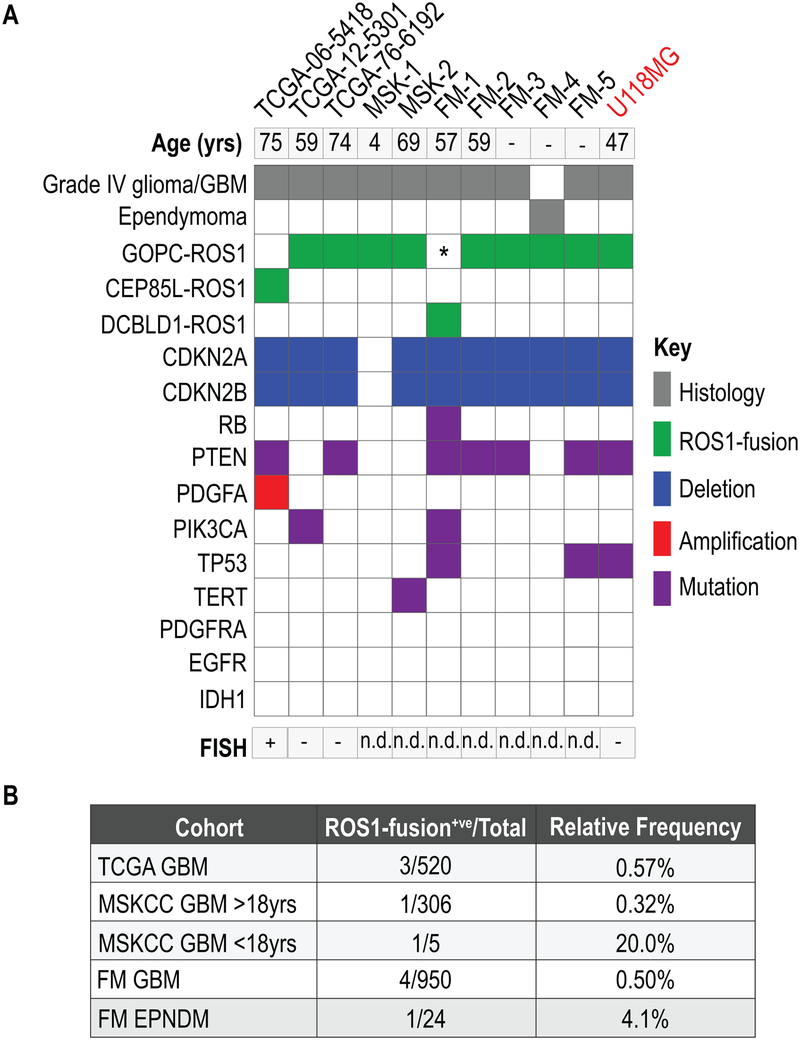
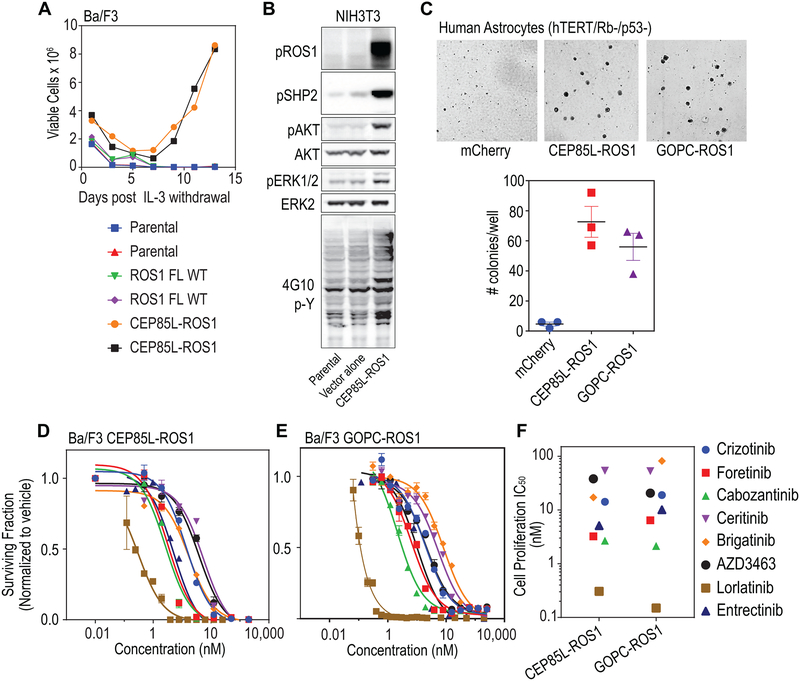
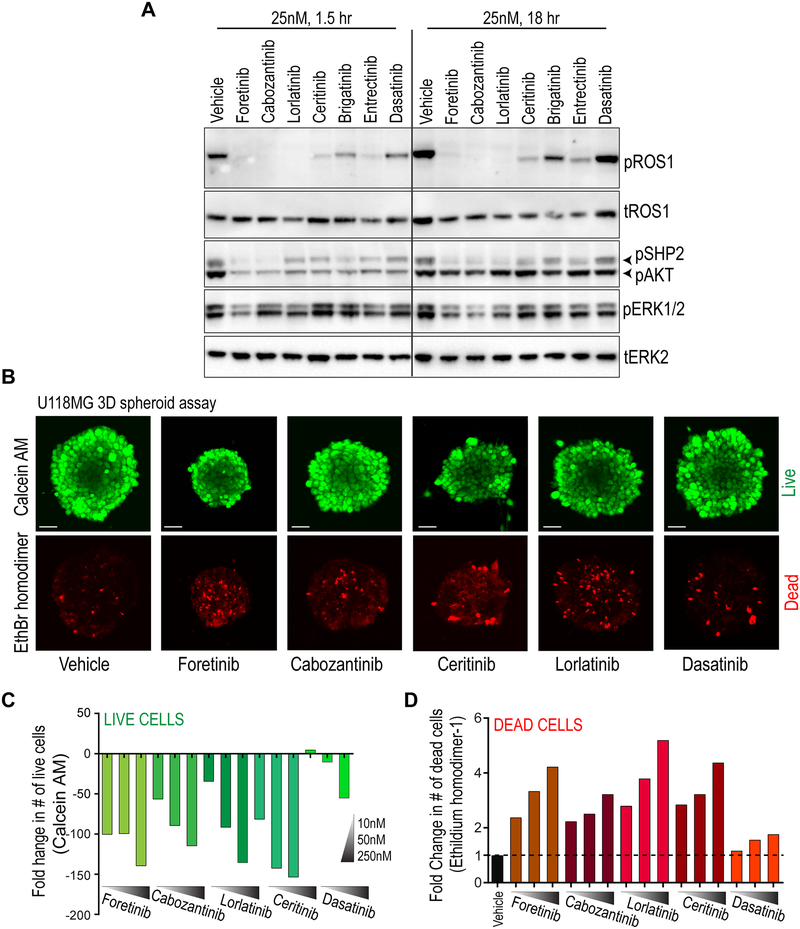
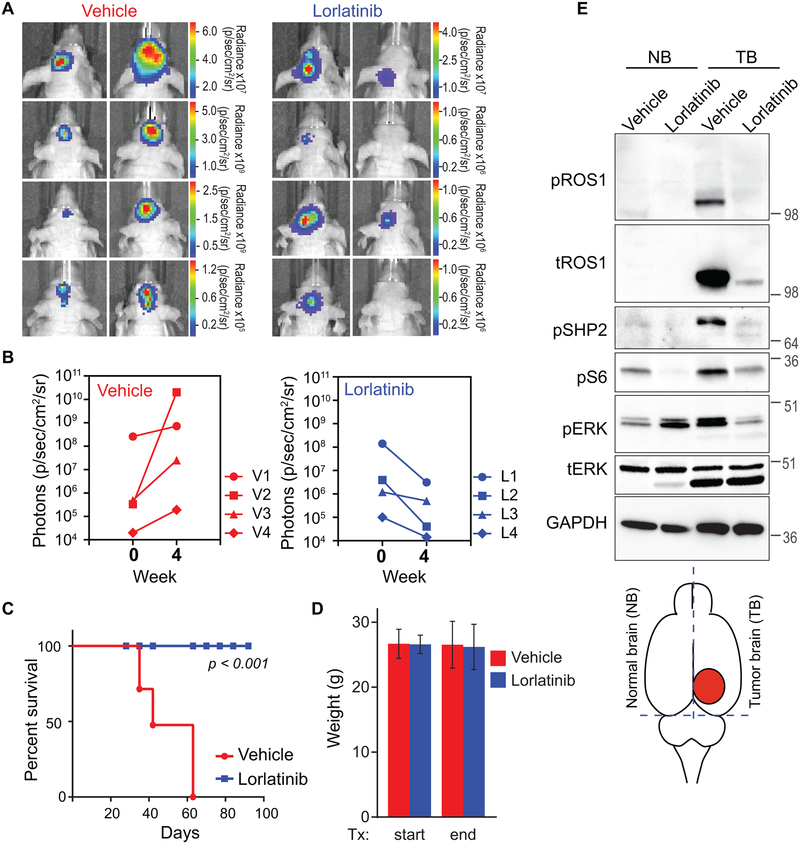
Results: In silico analysis revealed previously unreported intrachromosomal 6q22 microdeletions that generate ROS1-fusions from TCGA glioblastoma dataset. ROS1 fusions in primary glioma and ependymoma were independently corroborated from MSK-IMPACT and Foundation Medicine clinical datasets. GOPC-ROS1 is a recurrent ROS1 fusion in primary central nervous system (CNS) tumors. CEP85L-ROS1 and GOPC-ROS1 are transforming oncogenes in cells of astrocytic lineage, and amenable to pharmacologic inhibition with several ROS1 inhibitors even when occurring concurrently with other cancer hotspot aberrations frequently associated with glioblastoma. Oral monotherapy with a brain-permeable ROS1 inhibitor, lorlatinib, significantly prolonged survival in an intracranially xenografted tumor model generated from a ROS1 fusion-positive glioblastoma cell line.

Conclusions: Our findings highlight that CNS tumors should be specifically interrogated for these rare intrachromosomal 6q22 microdeletion events that generate actionable ROS1 fusions. ROS1 fusions in primary brain cancer may be amenable for clinical intervention with kinase inhibitors, and this holds the potential of novel treatment paradigms in these treatment-refractory cancer types, particularly in glioblastoma.


Conflict of interest statement

Conflict(s) of interest: None

Figures

Figure 1.
Figure 1.. Validation of GOPC-ROS1 and CEP85L-ROS1 mRNA and protein expression in GBM samples.
A. Sanger sequencing (chromatographs) of the CEP85L-ROS1 and GOPC-ROS1 cDNAs in glioblastoma tumor samples from the TCGA cohort. Green and red arrows indicated above fusion cDNA diagram indicate primer binding location and direction used for sequencing CEP85L-ROS1 and GOPC-ROS1, respectively. Both fusions are generated from intrachromosomal deletion resulting in fusion of exons as depicted in the illustration. B. Immunoblotting lysates generated from frozen TCGA-06–5418 and TCGA-06–6699 tumors shows expression of phosphorylated ROS1 protein. C. qRT-PCR analysis of TCGA samples as compared to established glioblastoma cell lines. Fold expression data for ROS1 are normalized to GAPDH.
Figure 2.
Figure 2.. Validation of ROS1 fusion prevalence in GBM cases from independent genomic datasets.
A. Oncoprint plot illustrates ROS1 fusion in primary GBM and ependymoma samples from TCGA, MSK-IMPACT (MSK) and Foundation Medicine (FM) genomic sequencing datasets. Aberrations in cancer associated gene concurrent with ROS1-fusions are shown in various colors as indicated. Sample FM1 is indicated as having both DBCLD1-ROS1 and GOPC-ROS1 as we believe that this rearrangement generates a GOPC-ROS1 transcript due to genomic structure (see Results). The last lane shows the genomic profile of the established human GBM cell line, U118MG (indicated in red). B. Table shows relative frequency of ROS1 fusions in the indicated datasets. Clinical information pertaining to age is absent from most FM data. For the MSKCC MSK-IMPACT data, the adult and pediatric patients are shown as separate rows in the table.
Figure 3.
Figure 3.. CEP95L-ROS1 and GOPC-ROS1 transform human astrocytes and respond to ROS1 kinase inhibitors.
A. Graph depicts data from an interleukin-3 (IL-3) withdrawal assay showing that ectopic expression of CEP85L-ROS1 & GOPC-ROS1 but not native full length ROS1 permits sustained outgrowth of Ba/F3 cells in the absence of IL-3. Parental indicates untransduced Ba/F3 cells (negative control). B. Immunoblot analysis shows ectopic expression of CEP85L-ROS1 upregulates phospho-tyrosine signaling (4G10, generic p-Tyr antibody), as well as canonical ROS1- effector pathway signaling (phosphorylation of SHP2 (pSHP2), AKT (pAKT), ERK1/2 (pERK1/2) in NIH3T3 murine fibroblasts. C. Soft-agar colony forming assay data shows that expression of CEP85L-ROS1 and GOPC-ROS1 confers neoplastic properties to human astrocytes with deficiency in TP53 and RB. Upper panel: representative images; lower panel: quantification of number of colonies. D. Dose response proliferation assay of Ba/F3 CEP85L-ROS1 and, (E) GOPC-ROS1 cells after 72 hour exposure to crizotinib, foretinib, cabozantinib, ceritinib, brigatinib, AZD3463, lorlatinib and entrectinib. Data are normalized to vehicle-treated control, and values shown are the mean ± SEM. (F) Scatter plot of cell proliferation IC50 values for each TKI against Ba/F3 cells. Colored symbols represent different inhibitors as shown on the right.
Figure 4.
Figure 4.. ROS1 kinase inhibitors suppress catalytic activity, effector phosphorylation, and cell viability in GOPC-ROS1 harboring human glioblastoma cells.
A. Immunoblot analysis of phospho-ROS1 (pROS1), total ROS1 (tROS1), phospho-SHP2 (pSHP2), phospho-AKT (pAKT), phospho-ERK1/2 (pERK1/2) and total ERK2 (tERK2) from U118MG cell lysates generated after treatment with inhibitors (indicated, 25 nM) for 1.5 or 18 hours. B. Suppression of U118MG spheroid growth and increase in cell death after treatment with foretinib, cabozantinib, ceritinib, lorlatinib and dasatinib for 48 hours, as indicated. Top: Calcein-AM staining shows viable cells within hanging drop spheroids (pseudocolored green), and ethidium bromide (EthBr homodimer) staining shows dead cells (pseudocolored red). C. Quantification of live cell numbers (green bars) from spheroids after Z-stack confocal microscopy after treatment with 10, 50 and 250 nM for indicated kinase inhibitor for 48 hours. Data are depicted as fold-change relative to vehicle (DMSO) treated cells. D. Quantification of dead cell numbers (red bars) from spheroids after Z-stack confocal microscopy after treatment with 10, 50 and 250 nM for indicated kinase inhibitor for 48 hours. Data are depicted as fold-change relative to vehicle (DMSO) treated cells.
Figure 5.
Figure 5.. Oral monotherapy with lorlatinib decreases tumor burden and prolongs survival in an intracranial U118MG GBM xenograft model.
A. Bioluminescence imaging of the U118MG-xenografted tumors pre- and post-four weeks of Vehicle or lorlatinib treatment (30 mg/kg by oral gavage, once daily). Firefly luciferase-labeled U118MG GBM cells had been implanted into forebrain of NOD-scid mice four weeks prior to starting treatment. B. Photon emission as surrogate readout for tumor volume at start of treatment (week 0) and end of treatment (week 4) in Vehicle treated (left graph) and lorlatinib-treated (right graph) mice. C. Vehicle or lorlatinib-treated mouse weights at start and end of treatment period. D. Kaplan Meier survival curve shows statistically significant difference in survivability of vehicle versus lorlatinib-treated U118MG tumor bearing mice. p<0.001 by Anova. E. Immunoblots from lysate prepared from mice treated as indicated. The illustration at the bottom indicates rough dissection lines used to harvest tissue to create normal brain (NB), and tumor brain (TB) as denoted in image. Lysates were interrogated with antibodies are shown in western blot panels, and dilutions described in Methods.

References

    1. Ostrom QT, Gittleman H, Xu J, Kromer C, Wolinsky Y, Kruchko C, et al. CBTRUS Statistical Report: Primary Brain and Other Central Nervous System Tumors Diagnosed in the United States in 2009–2013. Neuro-Oncology 2016;18:v1–v75 - PMC - PubMed
    1. Hoang-Xuan K, Idbaih A. [Advances in molecular genetics and treatment of gliomas]. Bull Acad Natl Med 2011;195:11–20; discussion −1 - PubMed
    1. Drilon A, Siena S, Ou SI, Patel M, Ahn MJ, Lee J, et al. Safety and Antitumor Activity of the Multitargeted Pan-TRK, ROS1, and ALK Inhibitor Entrectinib: Combined Results from Two Phase I Trials (ALKA-372–001 and STARTRK-1). Cancer Discov 2017;7:400–9 - PMC - PubMed
    1. Pagliarini R, Shao W, Sellers WR. Oncogene addiction: pathways of therapeutic response, resistance, and road maps toward a cure. EMBO Rep 2015;16:280–96 - PMC - PubMed
    1. Cancer Genome Atlas Research N. Comprehensive genomic characterization defines human glioblastoma genes and core pathways. Nature 2008;455:1061–8 - PMC - PubMed

Publication types

MeSH terms