. 2018 Aug 31;3(26):eaat7668.
doi: 10.1126/sciimmunol.aat7668.

Human antimicrobial cytotoxic T lymphocytes, defined by NK receptors and antimicrobial proteins, kill intracellular bacteria

Affiliations

Human antimicrobial cytotoxic T lymphocytes, defined by NK receptors and antimicrobial proteins, kill intracellular bacteria

Samuel J Balin et al. Sci Immunol. .

Abstract

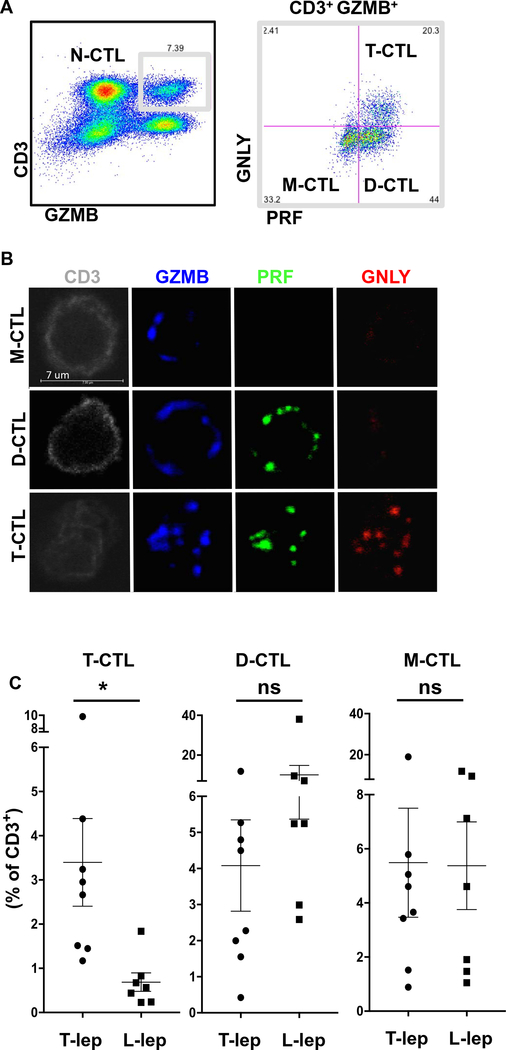
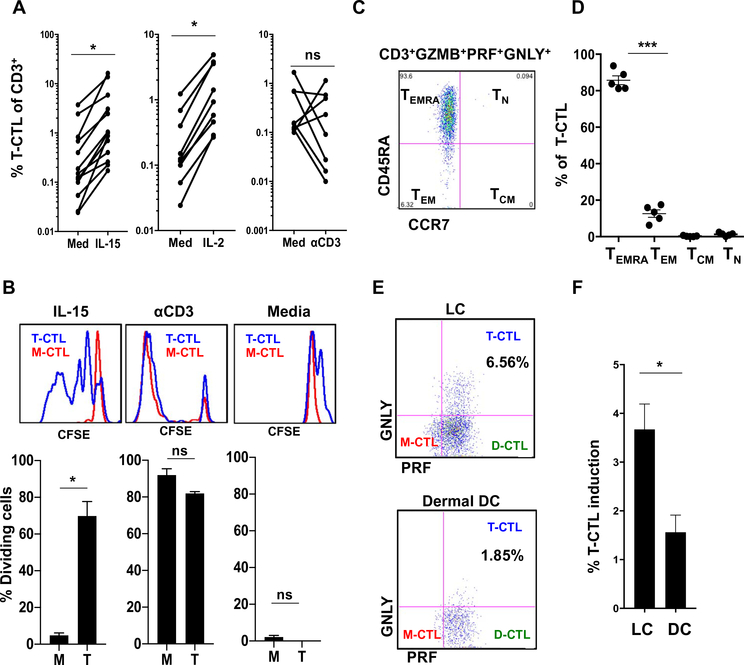
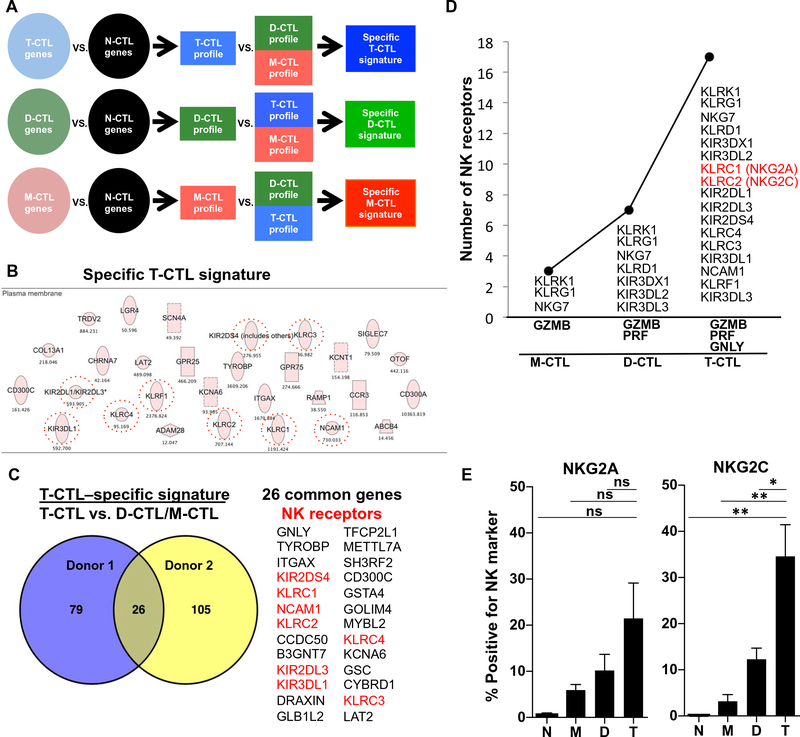
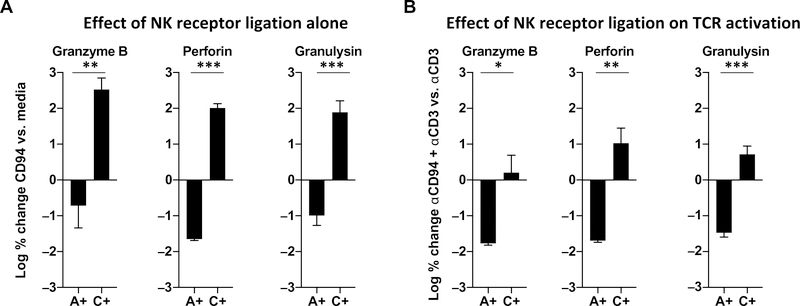
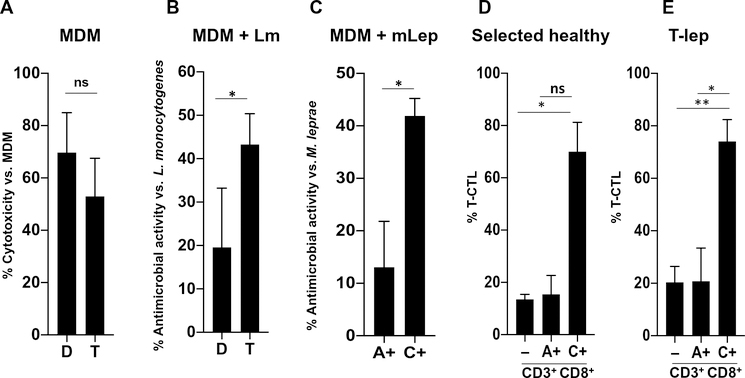
Human CD8+ cytotoxic T lymphocytes (CTLs) contribute to antimicrobial defense against intracellular pathogens through secretion of cytotoxic granule proteins granzyme B, perforin, and granulysin. However, CTLs are heterogeneous in the expression of these proteins, and the subset(s) responsible for antimicrobial activity is unclear. Studying human leprosy, we found that the subset of CTLs coexpressing all three cytotoxic molecules is increased in the resistant form of the disease, can be expanded by interleukin-15 (IL-15), and is differentiated from naïve CD8+ T cells by Langerhans cells. RNA sequencing analysis identified that these CTLs express a gene signature that includes an array of surface receptors typically expressed by natural killer (NK) cells. We determined that CD8+ CTLs expressing granzyme B, perforin, and granulysin, as well as the activating NK receptor NKG2C, represent a population of "antimicrobial CTLs" (amCTLs) capable of T cell receptor (TCR)-dependent and TCR-independent release of cytotoxic granule proteins that mediate antimicrobial activity.


Conflict of interest statement

Competing interests: S.J.B., R.L.M., and M.P. are authors on a pending patent application PCT/US17/25842 pertaining to the use of T-CTLs in health and disease. The other authors declare that they have no competing interests.

Figures

Fig. 1.
Fig. 1.. T-CTLs are defined by expression of GZMB, PRF, and GNLY and enriched in T-lep versus L-lep.
(A) PBMCs were stained with antibodies to CD3, GZMB, PRF, and GNLY. T-CTL, D-CTL, M-CTL, and N-CTL cells were delineated by flow cytometry. (B) T cells from a healthy donor were sorted from PBMCs and stained for GNLY, PRF, and GZMB. Cells were examined by confocal microscopy, and representative images of the types of cells seen are shown. (C) PBMCs from T-lep (n = 8) or L-lep (n = 7) donors were examined and compared for the percentage of CD3+ T cells that coexpress GZMB, PRF, and GNLY (T-CTLs). *P < 0.05. ns, not significant.
Fig. 2.
Fig. 2.. T-CTLs are CD8+ TEMRA cells that can be expanded by IL-15 and IL-2 through selective proliferation and can be induced by LCs.
(A) PBMCs from healthy donors were treated with IL-15 (n = 13), IL-2 (n = 9), or anti-CD3 plus anti-CD28 (n = 8) for 5 days and compared with medium treatment. (B) PBMCs were labeled with CFSE and treated with medium, IL-15, or aCD3 stimulation for 5 days. Proliferation of T-CTL and M-CTL populations was compared by CFSE dilution; one representative experiment is shown above, and average proliferation is shown below (n = 3). (C) One example shows that the T-CTL compartment was examined and found to consist primarily of CCR7, CD45RA+ (TEMRA) cells. (D) The T-CTL subset was examined for memory markers (n = 5). (E) Naïve CD8+ T cells were cocultured with allogeneic dermal CD14+ DCs or LCs isolated from human skin. CTL subset formation was interrogated after 7 days of culture. One representative experiment is shown. (F) Composite bar graph demonstrating the significantly greater ability of LCs versus DCs to induce T-CTLs (LCs, n = 9; DCs, n = 6). *P < 0.05, ***P < 0.001.
Fig. 3.
Fig. 3.. RNA-seq of cytotoxic cell populations identifies a specific T-CTL gene signature composed of NK receptors that correlate with the number of cytotoxic molecules expressed and that are enriched on T-CTLs.
(A) RNA-seq was performed on sorted populations of T-CTL, D-CTL, M-CTL, and N-CTL cells. Gene profiles of T-CTL, D-CTL, and M-CTL cells were created by selecting genes increased twofold or more in each population over the N-CTL population. Specific gene signatures were then created by selecting genes more highly expressed in one profile when compared with the others. (B) Genes comprising the T-CTL specific signature were analyzed by Ingenuity (Qiagen) and sorted for surface expression. NK receptors are circled. (C) The “specific T-CTL signatures” between two donors were overlapped using VENNY (69), and common genes are listed, with NK receptors highlighted in red. (D) The number of surface NK receptors expressed in a population (y axis) is graphed as a function of the number of cytotoxic molecules expressed by that population (x axis). NK receptor expression by a population is defined by greater than twofold expression over each preceding population (or 1.5-fold for T-CTLs versus D-CTLs). (E) CTL subsets from 10 donors were analyzed for the denoted NK marker expression by flow cytometry. The average percentage of T-CTL, D-CTL, M-CTL, and N-CTL cells expressing these markers in each respective donor is shown. *P < 0.05, **P < 0.01.
Fig. 4.
Fig. 4.. NK receptors on T-CTLs are functional and may modulate TCR-induced release of cytotoxic granules.
T-CTLs were enriched from other subsets by cell sorting for either NKG2A (A+) or NKG2C (C+). (A) Each population was stimulated with anti-CD94 or left in medium for 20 hours. GZMB, PRF, and GNLY release was measured in the culture supernatants by ELISA. The log % change of the anti-CD94 stimulation relative to medium is shown. (B) Each population was stimulated with anti-CD3 or anti-CD3 and anti-CD94 for 20 hours, and cytotoxic granule proteins were measured by ELISA. The log % change of the anti-CD94 plus anti-CD3 relative to anti-CD3 alone is shown. *P < 0.05, **P < 0.01, ***P < 0.001.
Fig. 5.
Fig. 5.. T-CTLs can be purified using NK receptors and display greater antimicrobial activity as compared with other CD8+ T cells.
(A) MDMs coated with anti-CD3 were admixed with the T-CTL and D-CTL clones in an E:T ratio of 2:1, as indicated. LDH was measured in culture supernatants after 4.5 hours. The percent cytotoxicity was calculated by comparing the amount of LDH released in each condition to the amount of LDH released by MDMs alone (n = 4). (B) L. monocytogenes (Lm)–infected MDMs coated with anti-CD3 were admixed with the T-CTL and D-CTL clones at an E:T ratio of 2:1, as indicated. After 20 hours, MDMs were lysed and the amount of L. monocytogenes present was assessed by CFU. Percent antimicrobial activity was determined by normalizing the amount of bacterial growth in each condition to the amount of bacterial growth found in infected MDMs without admixed T cells (n = 4). (C) M. leprae (mLep)–infected MDMs coated with anti-CD3 were admixed with sorted populations of CD8+ T cells based on NKG2A and NKG2C expression in an E:T ratio of 2:1, as indicated. The T-CTL, D-CTL, M-CTL, and N-CTL composition of each sorted population was delineated at the time of sorting. After 24 hours, RNA and DNA were isolated and the ratio of bacterial RNA to DNA was calculated. Antimicrobial activity was determined by normalization of each condition to M. leprae–infected MDMs admixed with NKG2A and NKG2C cells (n = 4). (D) The percent of T-CTLs in total CD3+CD8+ (−), CD3+CD8+NKG2A+ (A+), and CD3+CD8+NKG2C+ (C+) cells was determined in four healthy donors by flow cytometry and is compared. (E) The percent of T-CTLs in total CD3+CD8+ (−), CD3+CD8+NKG2A+, and CD3+CD8+NKG2C+ cells was determined in T-lep donors by flow cytometry and is compared (n = 4). *P < 0.05, **P < 0.01.

References

    1. Lin PL, Flynn JL, CD8 T cells and Mycobacterium tuberculosis infection. Semin. Immunopathol 37, 239–249 (2015). - PMC - PubMed
    1. Tan JS, Canaday DH, Boom WH, Balaji KN, Schwander SK, Rich EA, Human alveolar T lymphocyte responses to Mycobacterium tuberculosis antigens: Role for CD4+ and CD8+ cytotoxic T cells and relative resistance of alveolar macrophages to lysis. J. Immunol 159, 290–297 (1997). - PubMed
    1. Stenger S, Mazzaccaro RJ, Uyemura K, Cho S, Barnes PF, Rosat J-P, Sette A, Brenner MB, Porcelli SA, Bloom BR, Modlin RL, Differential effects of cytolytic T cell subsets on intracellular infection. Science 276, 1684–1687 (1997). - PubMed
    1. Stenger S, Hanson DA, Teitelbaum R, Dewan P, Niazi KR, Froelich CJ, Ganz T, Thoma-Uszynski S, Melián A, Bogdan C, Porcelli SA, Bloom BR, Krensky AM, Modlin RL, An antimicrobial activity of cytolytic T cells mediated by granulysin. Science 282, 121–125 (1998). - PubMed
    1. Ochoa M-T, Stenger S, Sieling PA, Thoma-Uszynski S, Sabet S, Cho S, Krensky AM, Rollinghoff M, Sarno EN, Burdick AE, Rea TH, Modlin RL, T-cell release of granulysin contributes to host defense in leprosy. Nat. Med 7, 174–179 (2001). - PubMed

Publication types

MeSH terms