. 2018 Sep 18;115(38):E9015-E9024.
doi: 10.1073/pnas.1719616115. Epub 2018 Aug 31.

Mid-level visual features underlie the high-level categorical organization of the ventral stream

Affiliations

Mid-level visual features underlie the high-level categorical organization of the ventral stream

Bria Long et al. Proc Natl Acad Sci U S A. .

Abstract

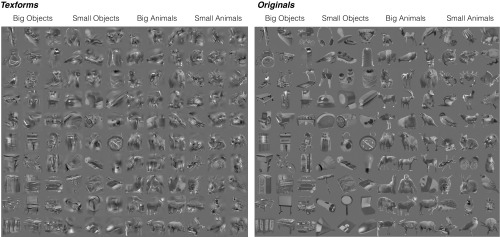
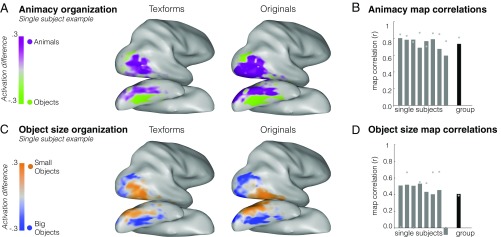
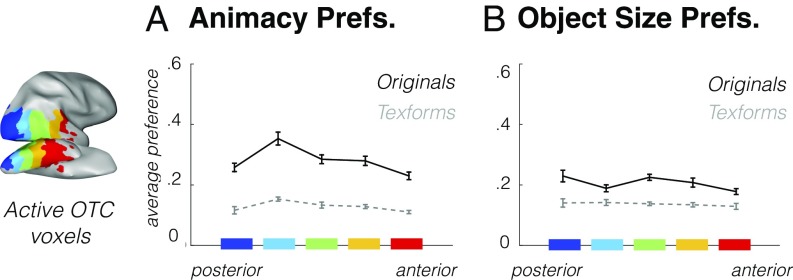
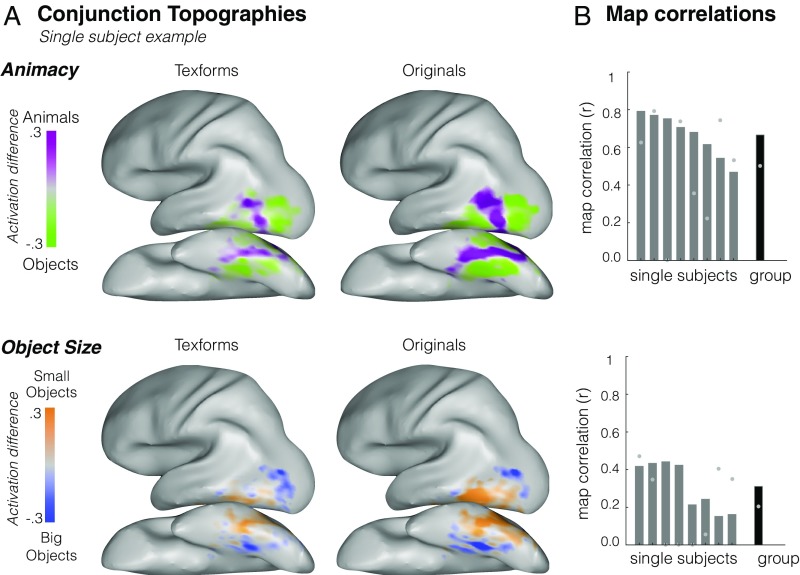
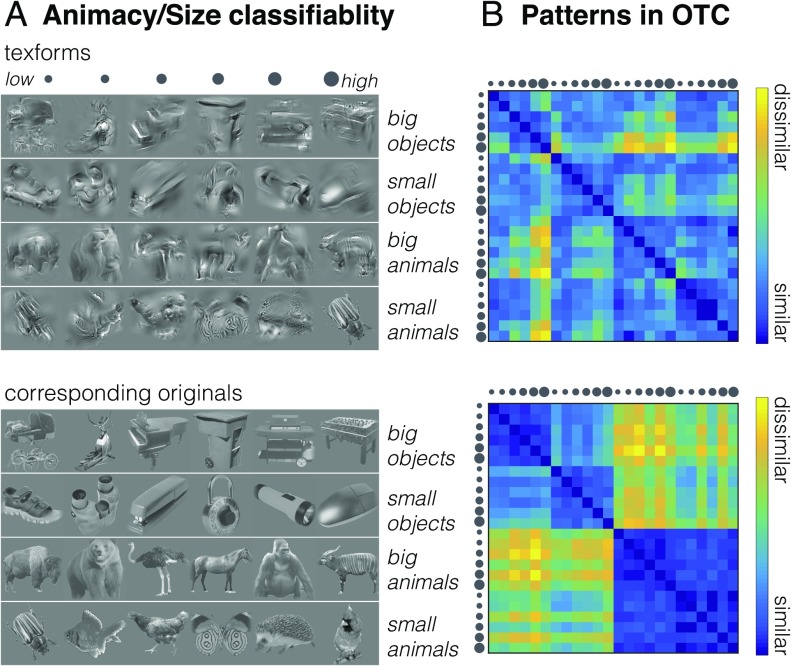
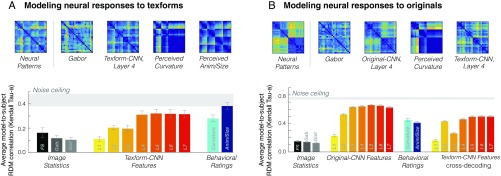
Human object-selective cortex shows a large-scale organization characterized by the high-level properties of both animacy and object size. To what extent are these neural responses explained by primitive perceptual features that distinguish animals from objects and big objects from small objects? To address this question, we used a texture synthesis algorithm to create a class of stimuli-texforms-which preserve some mid-level texture and form information from objects while rendering them unrecognizable. We found that unrecognizable texforms were sufficient to elicit the large-scale organizations of object-selective cortex along the entire ventral pathway. Further, the structure in the neural patterns elicited by texforms was well predicted by curvature features and by intermediate layers of a deep convolutional neural network, supporting the mid-level nature of the representations. These results provide clear evidence that a substantial portion of ventral stream organization can be accounted for by coarse texture and form information without requiring explicit recognition of intact objects.

Keywords: deep neural networks; fMRI; mid-level features; object recognition; ventral stream organization.


Conflict of interest statement

The authors declare no conflict of interest.

Figures

Fig. 1.
Fig. 1.
Texforms (Left) were generated using a texture-synthesis model (45) from recognizable pictures (Right) of 30 big objects, 30 small objects, 30 big animals, and 30 small animals. Stimuli are shown at slightly higher contrast for visualization purposes. Stimuli were selected so that all texforms were unrecognizable at the basic level using online recognition experiments.
Fig. 2.
Fig. 2.
Preference map analyses. (A and C) Response preferences within active occipitotemporal voxels are plotted for animals vs. objects (A) and for big vs. small objects (C) in an example participant, considering texform images (Left) and original images (Right). The color bar reaches full saturation at activation differences between 0.3 and −0.3 (reflecting the beta difference calculated from this individual’s GLM). (B and D) The correlation between the original and texform response maps in active occipitotemporal voxels is plotted for the animacy (B) and object size (D) distinctions. Correlations between original image and texform image maps are shown for all individual participants and for the group, averaged across all subjects. Gray dots indicate the estimated noise ceiling for each participant and at the group level.
Fig. 3.
Fig. 3.
Anatomical sections (shown here at the group level) from posterior to anterior in blue to red. (A) The strength of the average animal/object response preference is shown for each anatomical section, averaged across voxels and participants, plotted for both original images (black solid line) and texform images (gray dashed line). Error bars reflect between-subjects SEM. (B) The strength of the average big/small object response preference is shown, as in A.
Fig. 4.
Fig. 4.
(A). Group conjunction topographies. Average category responses when texforms (Left) and original images (Right) are presented in the upper and lower visual field. Topographies are restricted to voxels that show the same category preference regardless of the stimuli’s location in the visual field and are shown separately for animacy (Upper) and size (Lower). (B) Conjunction map correlation values (y axis) are plotted for each individual subject (x axis) and at the group level separately for animacy (Upper) and object size (Lower) contrasts; gray dots indicate the noise ceiling for each participant and at the group level.
Fig. 5.
Fig. 5.
(A, Upper) Examples of texforms from the six classifiability groups, from lowest to highest, are shown for the four main conditions. (Lower) The corresponding original images. (B) Representational dissimilarity matrices obtained from neural patterns in the active occipitotemporal cortex for texforms (Upper) and original images (Lower). Data are scaled so that in both cases the most dissimilar values are yellow and the least dissimilar values are blue.
Fig. 6.
Fig. 6.
(A, Upper) Neural patterns in response to texforms (shown in Fig. 5B) and predicted neural dissimilarities for selected models obtained through the cross-validation procedure. (Lower) The bar plot shows the predicted model correlation (Kendall τA). Error bars reflect the SE of the model fit across individual subject’s neural patterns in occipitotemporal cortex. The bars show different models, from left to right: Freeman and Simoncelli texture model (black), Gabor model (dark gray), Gist model (light gray), AlexNet features layers 1–7 (yellow to red), curvature behavioral ratings (light blue), and animacy/size behavioral ratings (dark blue). Data are plotted with respect to the noise ceiling of neural responses to texform images across participants, shown in light gray. (B, Upper) Neural patterns in response to original images (shown in Fig. 5B) and predicted neural dissimilarities for four models obtained through the same leave-one-condition-out cross-validation procedure. (Lower) The average predicted model correlation (Kendall τA) is plotted for different models, as in A, with AlexNet features extracted from both original images and texforms. Data are plotted with respect to the noise ceiling of neural responses to original images across participants, shown in light gray.

References

    1. DiCarlo JJ, Cox DD. Untangling invariant object recognition. Trends Cogn Sci. 2007;11:333–341. - PubMed
    1. Mishkin M, Ungerleider LG, Macko KA. Object vision and spatial vision: Two cortical pathways. Trends Neurosci. 1983;6:414–417.
    1. Cohen L, et al. The visual word form area: Spatial and temporal characterization of an initial stage of reading in normal subjects and posterior split-brain patients. Brain. 2000;123:291–307. - PubMed
    1. Downing PE, Jiang Y, Shuman M, Kanwisher N. A cortical area selective for visual processing of the human body. Science. 2001;293:2470–2473. - PubMed
    1. Epstein R, Kanwisher N. A cortical representation of the local visual environment. Nature. 1998;392:598–601. - PubMed