. 2019 Jan;13(1):12-23.
doi: 10.1038/s41396-018-0241-7. Epub 2018 Aug 31.

Stressor interaction networks suggest antibiotic resistance co-opted from stress responses to temperature

Affiliations

Stressor interaction networks suggest antibiotic resistance co-opted from stress responses to temperature

Mauricio Cruz-Loya et al. ISME J. 2019 Jan.

Abstract

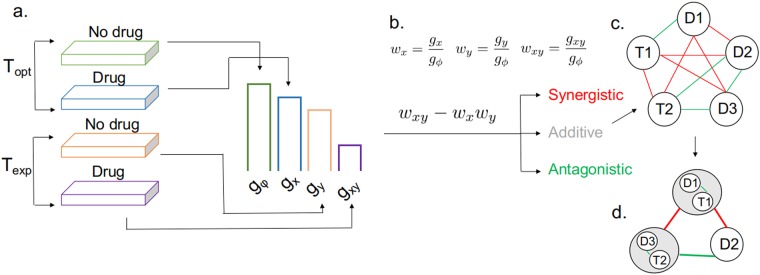
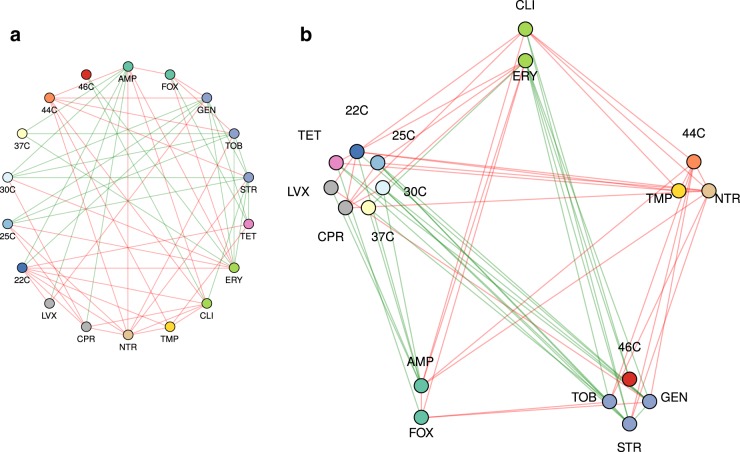
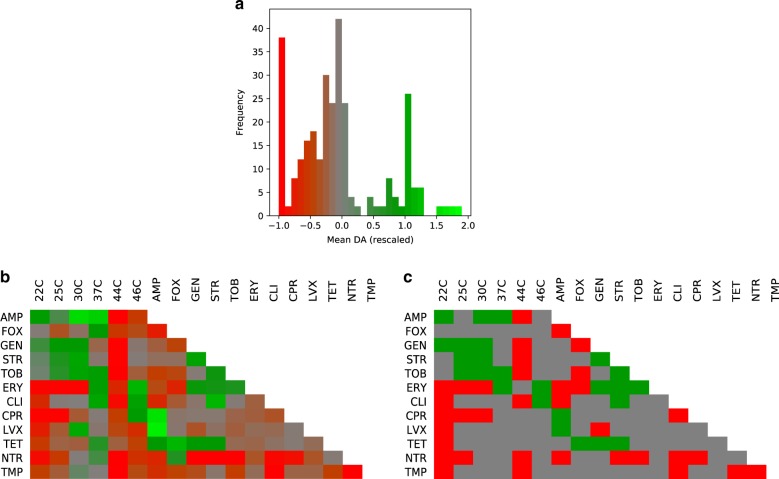
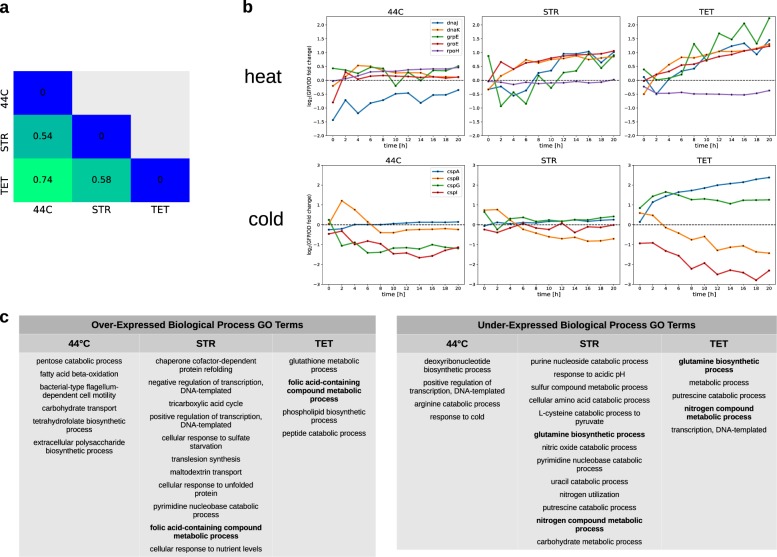
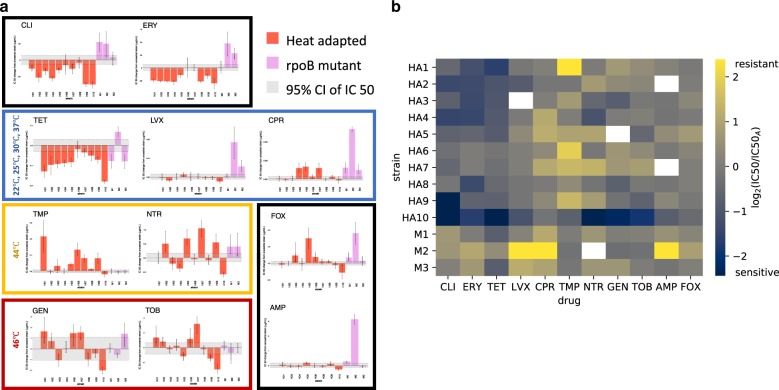
Environmental factors like temperature, pressure, and pH partly shaped the evolution of life. As life progressed, new stressors (e.g., poisons and antibiotics) arose as part of an arms race among organisms. Here we ask if cells co-opted existing mechanisms to respond to new stressors, or whether new responses evolved de novo. We use a network-clustering approach based purely on phenotypic growth measurements and interactions among the effects of stressors on population growth. We apply this method to two types of stressors-temperature and antibiotics-to discover the extent to which their cellular responses overlap in Escherichia coli. Our clustering reveals that responses to low and high temperatures are clearly separated, and each is grouped with responses to antibiotics that have similar effects to cold or heat, respectively. As further support, we use a library of transcriptional fluorescent reporters to confirm heat-shock and cold-shock genes are induced by antibiotics. We also show strains evolved at high temperatures are more sensitive to antibiotics that mimic the effects of cold. Taken together, our results strongly suggest that temperature stress responses have been co-opted to deal with antibiotic stress.


Conflict of interest statement

The authors declare that they have no conflict of interest.

Figures

Fig. 1
Fig. 1
Schematic illustration of the approach taken in this work. a Growth is measured in the following conditions: reference growth gφ at the optimal temperature (Topt = 41 °C) in the absence of drug, gx at optimal temperature with drug, gy at experimental temperature Texp, but no drug, and gxy at non-optimal temperature with drug. b The growth of each experimental condition is converted to proportions wx, wy, wxy by dividing by the reference growth. The difference between wxy (observed growth) and the product of wx and wy (expected growth under independence) is then used to classify the interaction between drugs and temperatures into three cases: synergistic (red line), additive (white or not shown), and antagonistic (green line), c which can be represented as an interaction network. d Drugs and temperatures can then be clustered into a functional class based on the monochromaticity of interactions with a different class. This example shows a drug-temperature interaction, but drug–drug interactions are obtained similarly, by replacing the growth with no drug at Texp with the growth under a second drug at Topt
Fig. 2
Fig. 2
Monochromatic clustering of the interaction network. a Unclustered interaction network. The nodes that correspond to drugs are color-coded by their mechanism of action (Table 1), and the nodes that correspond to temperatures are colored in a gradient from blue (low) to red (high). The edges correspond to discretized interaction type, as in Fig. 3c: synergy (red), antagonism (green), additive or unknown (no edge). b Network clustered into monochromatic classes by the modified Prism2 algorithm (Supplemental Information)
Fig. 3
Fig. 3
Interaction effects between antibiotics and temperature based on growth after 24-h. The interaction effect (ε~) values are color-coded in a gradient, from synergy (red) to additive (gray) and antagonism (green). a Overall distribution of the mean estimated interaction effects across all treatments. The distribution shows three clear peaks, corresponding to strong synergy, additivity, and antagonistic buffering. b Matrix heatmap of the mean interaction effects. Antibiotics with the same mechanism of action show similar interaction patterns. c Matrix heatmap of the discretized interaction types used for constructing the edges of the interaction network
Fig. 4
Fig. 4
Gene expression of E. coli after exposure to antibiotics and high temperature. The gene expression response of E. coli was evaluated with a library of 1870 fluorescent transcriptional reporters. a Mean absolute gene expression distance between experimental conditions. Lower numbers indicate conditions with more similar gene expression profiles. b Gene expression of representative heat-shock and cold-shock genes relative to control (37 °C) in response to experimental conditions (44 °C, STR, TET). c Gene ontology terms in the biological process category over-represented in the set of over-expressed and under-expressed genes in each experimental condition relative to control. Terms that are in bold occur in more than one treatment
Fig. 5
Fig. 5
Antibiotic sensitivity of high-temperature-adapted E. coli strains. a Absolute change in the IC50 (µg/mL) relative to the ancestral strain. Heat-adapted strains (red), rpoB mutant strains (purple). Error bars represent 95% credible intervals (CIs). Gray region represents the 95% CI of ancestral strain. Drugs are grouped according to the clusters of antibiotics and temperature in (Fig. 2). Conditions where the model fit was poor were removed from the plots (Supplemental Information). b Heatmap of log2 fold changes from the ancestral IC50. Heat-adapted strains are denoted by HA, while rpoB mutant strains are denoted by M. Positive numbers (yellow) indicate increased IC50 (more resistance), while negative numbers (blue) indicate a decreased IC50 (higher sensitivity). Drugs are grouped in the same way as in a. Missing conditions are shown in white

References

    1. Hoffmann AA, Parsons PA. Evolutionary genetics and environmental stress. Oxford, England, UK: Oxford University Press; 1991.
    1. Meyers LA, Bull JJ. Fighting change with change: adaptive variation in an uncertain world. Trends Ecol Evol. 2002;17:551–7. doi: 10.1016/S0169-5347(02)02633-2. - DOI
    1. Cho H, Uehara T, Bernhardt TG. Beta-lactam antibiotics induce a lethal malfunctioning of the bacterial cell wall synthesis machinery. Cell. 2014;159:1300–11. doi: 10.1016/j.cell.2014.11.017. - DOI - PMC - PubMed
    1. Kohanski MA, Dwyer DJ, Hayete B, Lawrence CA, Collins JJ. A common mechanism of cellular death induced by bactericidal antibiotics. Cell. 2007;130:797–810. doi: 10.1016/j.cell.2007.06.049. - DOI - PubMed
    1. Gilchrist GW. Specialists and generalists in changing environments. I. Fitness landscapes of thermal sensitivity. Am Nat. 1995;146:252–70. doi: 10.1086/285797. - DOI

Publication types

Substances