

Remapping the cognitive and neural profiles of children who struggle at school
- PMID: 30171790
- PMCID: PMC6808180
- DOI: 10.1111/desc.12747
Remapping the cognitive and neural profiles of children who struggle at school
Abstract
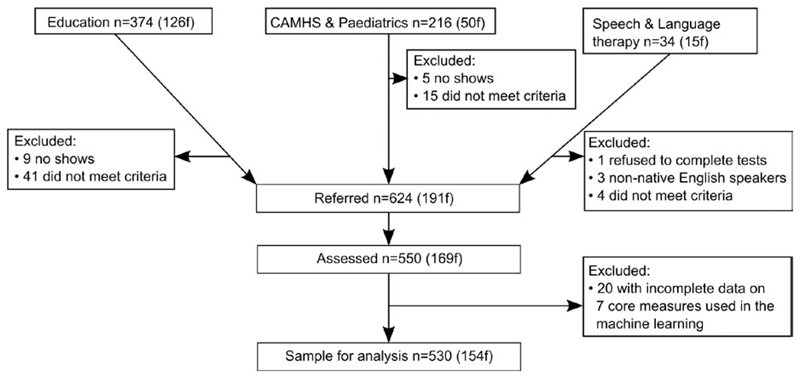
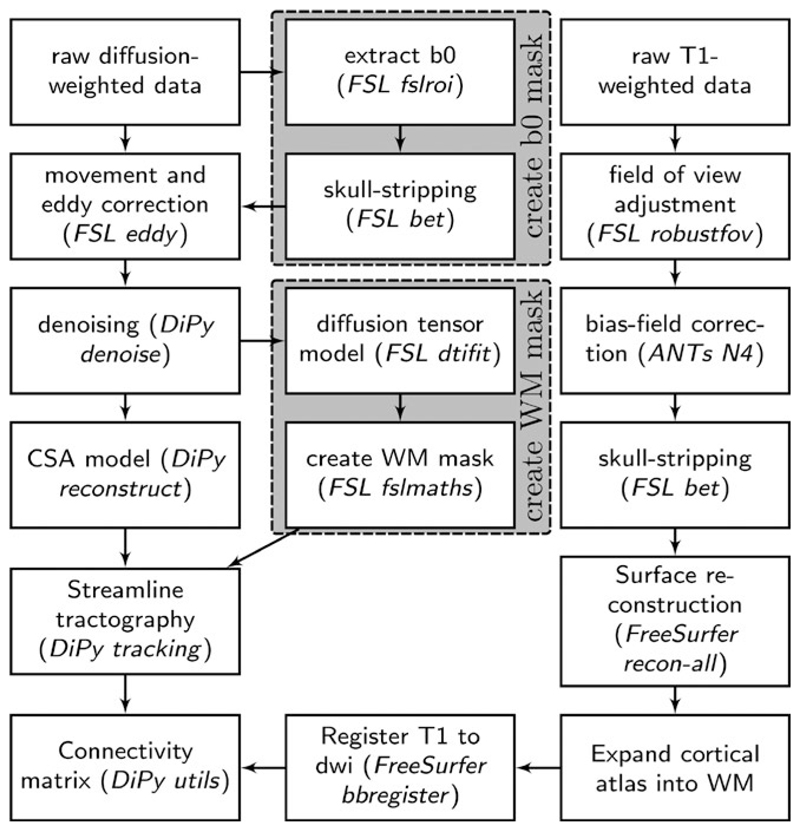
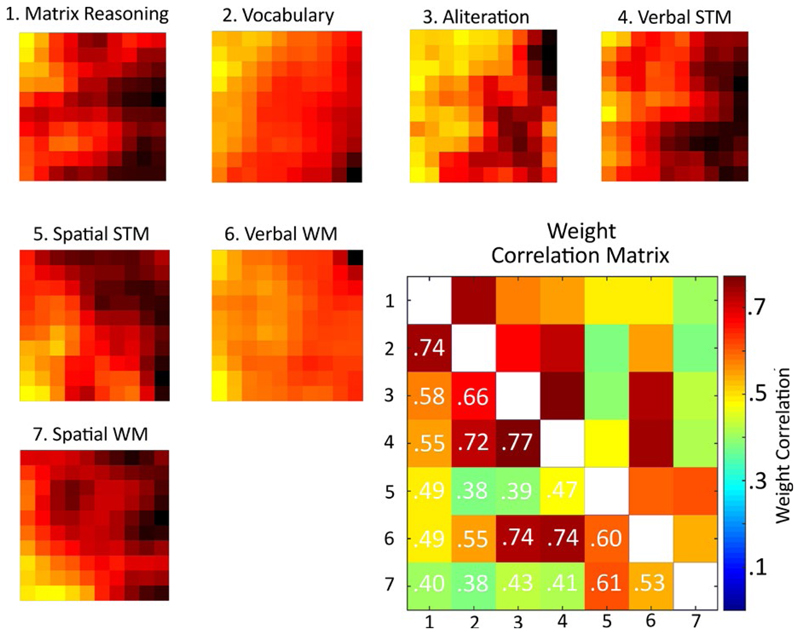
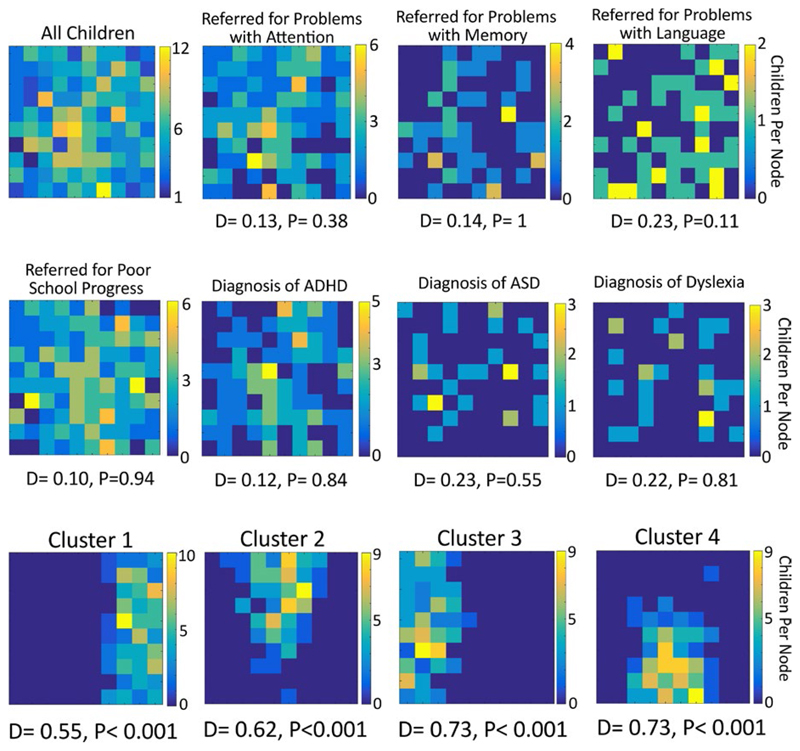
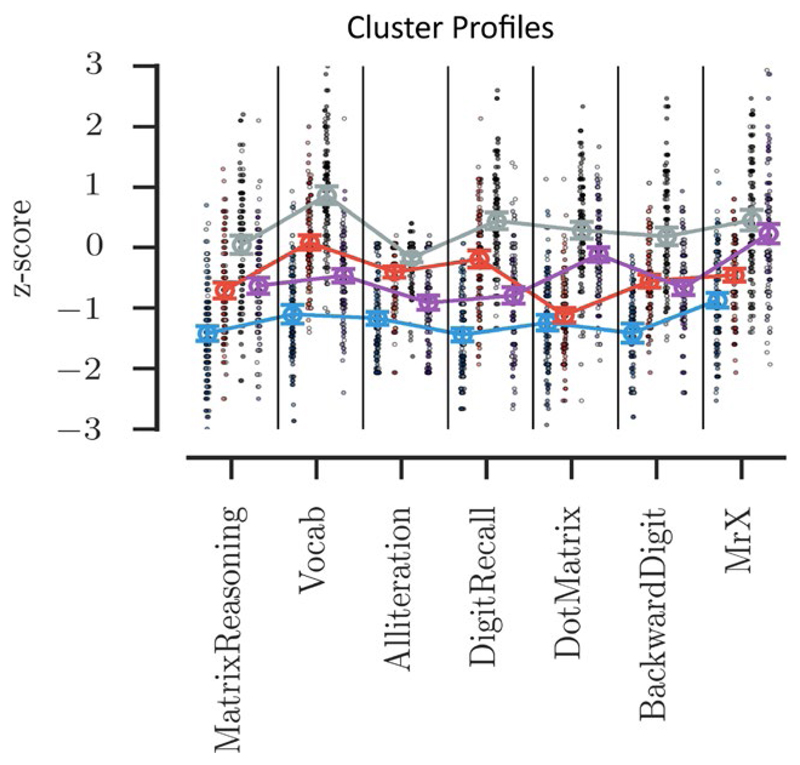
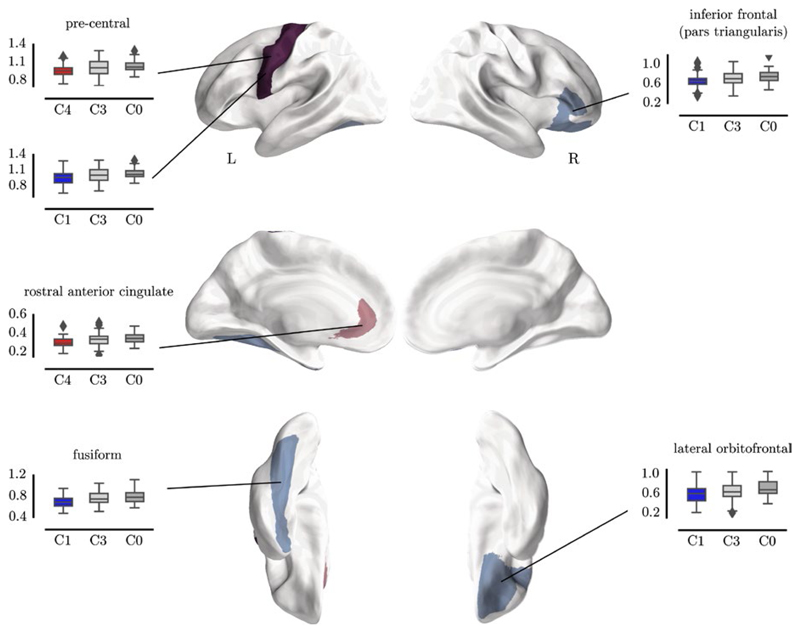
Our understanding of learning difficulties largely comes from children with specific diagnoses or individuals selected from community/clinical samples according to strict inclusion criteria. Applying strict exclusionary criteria overemphasizes within group homogeneity and between group differences, and fails to capture comorbidity. Here, we identify cognitive profiles in a large heterogeneous sample of struggling learners, using unsupervised machine learning in the form of an artificial neural network. Children were referred to the Centre for Attention Learning and Memory (CALM) by health and education professionals, irrespective of diagnosis or comorbidity, for problems in attention, memory, language, or poor school progress (n = 530). Children completed a battery of cognitive and learning assessments, underwent a structural MRI scan, and their parents completed behavior questionnaires. Within the network we could identify four groups of children: (a) children with broad cognitive difficulties, and severe reading, spelling and maths problems; (b) children with age-typical cognitive abilities and learning profiles; (c) children with working memory problems; and (d) children with phonological difficulties. Despite their contrasting cognitive profiles, the learning profiles for the latter two groups did not differ: both were around 1 SD below age-expected levels on all learning measures. Importantly a child's cognitive profile was not predicted by diagnosis or referral reason. We also constructed whole-brain structural connectomes for children from these four groupings (n = 184), alongside an additional group of typically developing children (n = 36), and identified distinct patterns of brain organization for each group. This study represents a novel move toward identifying data-driven neurocognitive dimensions underlying learning-related difficulties in a representative sample of poor learners.
Keywords: cognitive development; education; learning difficulties; machine learning.
© 2018 The Authors. Developmental Science Published by John Wiley & Sons Ltd.
Figures
References
-
- Alloway T. Automated Working Memory Assessment (AWMA) London, UK: Pearson Assessment; 2007.
-
- American Psychiatric Association. Diagnostic and statistical manual of mental disorders. 5th ed. Washington, DC: Author; 2013.
Publication types
MeSH terms
Grants and funding
LinkOut - more resources
Full Text Sources
Other Literature Sources
Medical
