

Fetal brain growth portrayed by a spatiotemporal diffusion tensor MRI atlas computed from in utero images
- PMID: 30172006
- PMCID: PMC6289660
- DOI: 10.1016/j.neuroimage.2018.08.030
Fetal brain growth portrayed by a spatiotemporal diffusion tensor MRI atlas computed from in utero images
Abstract
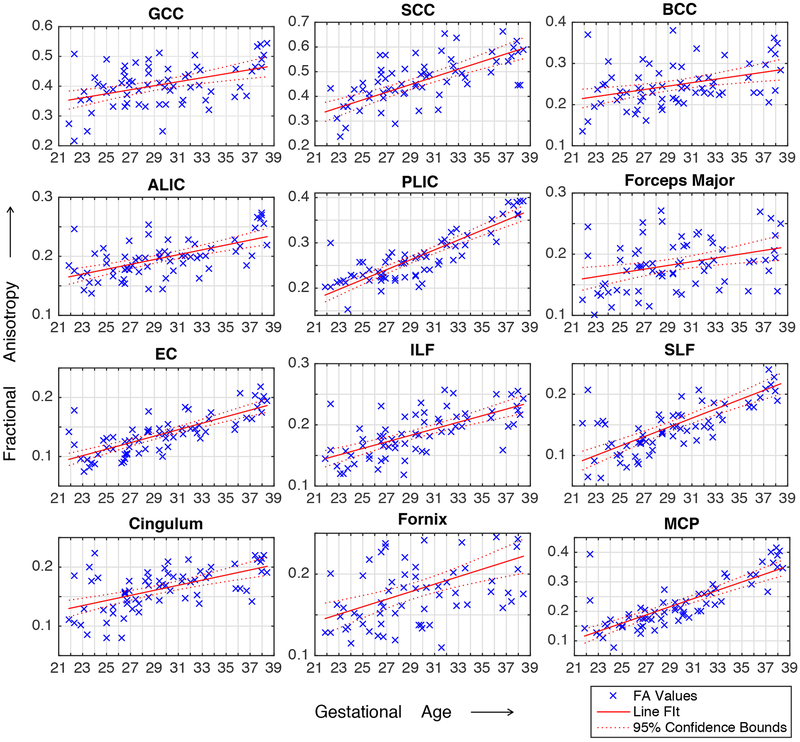
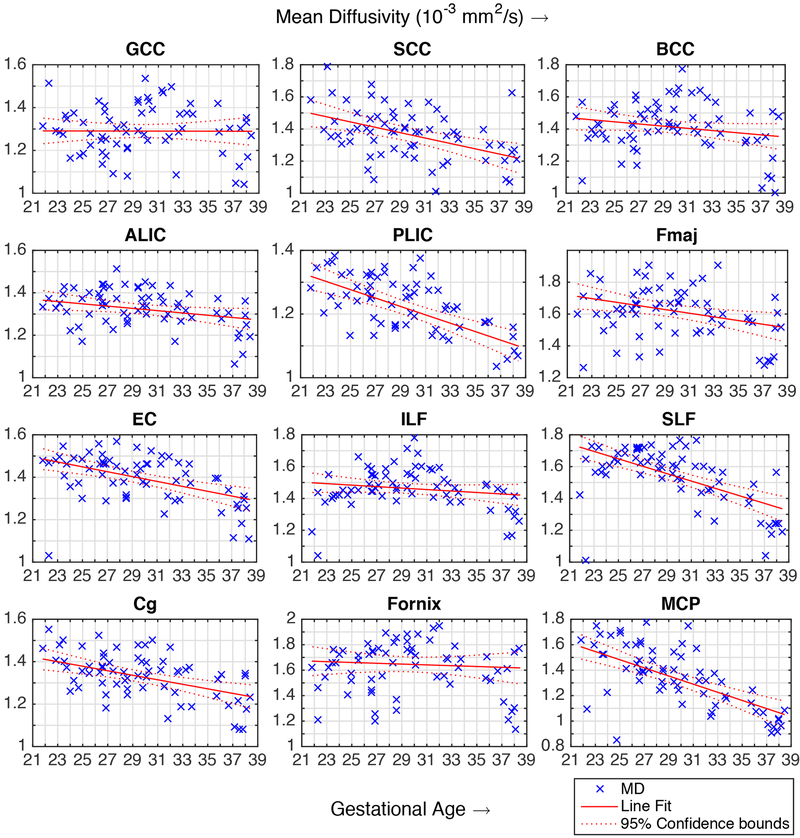
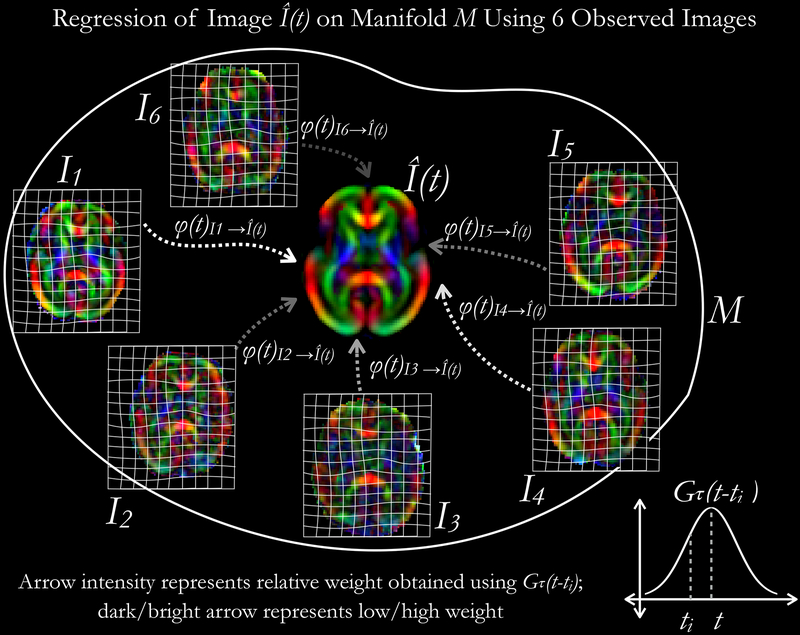
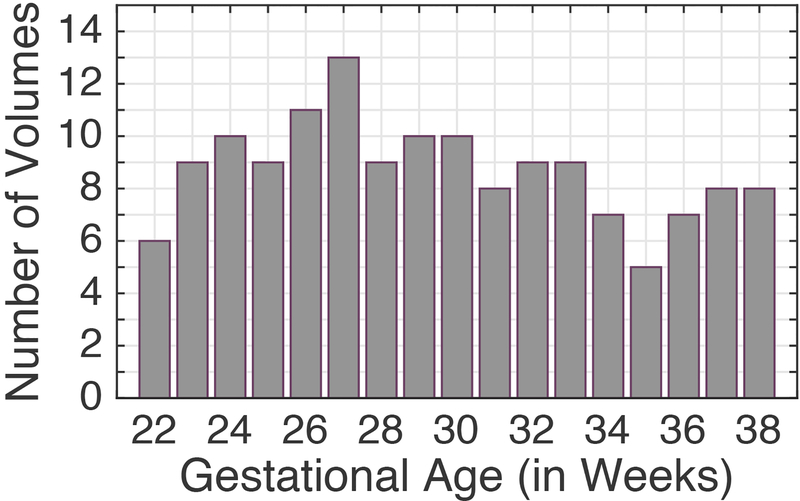
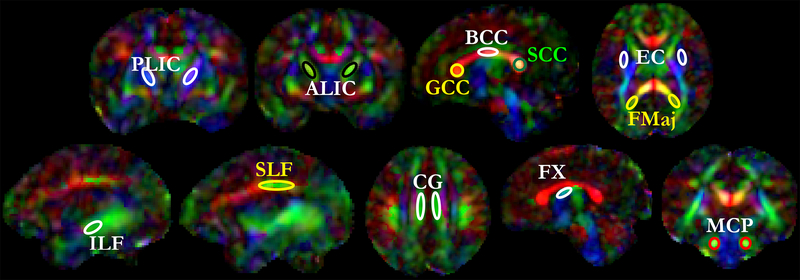
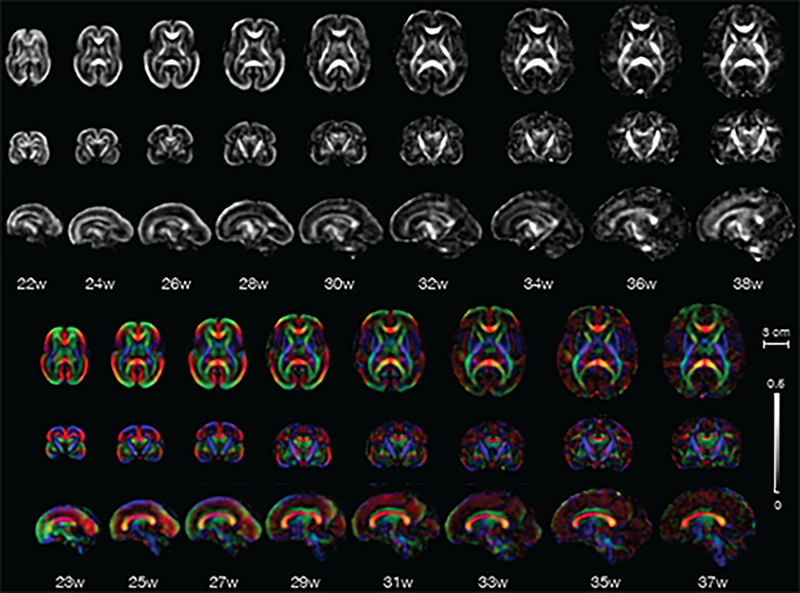
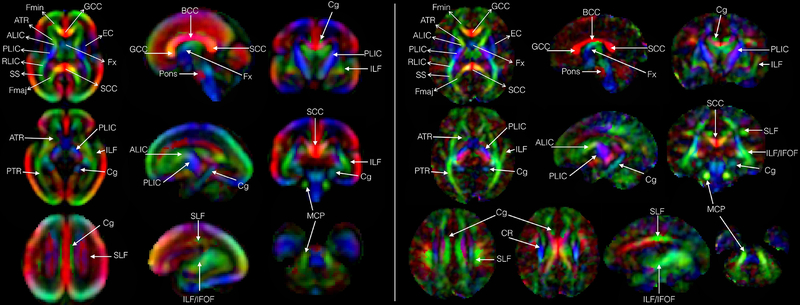
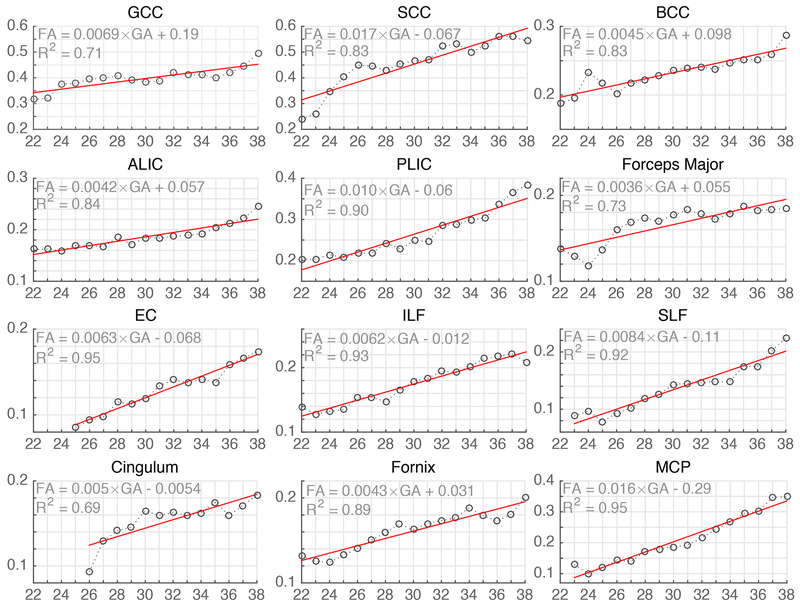
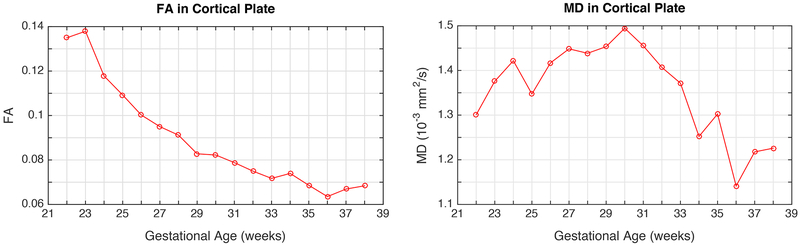
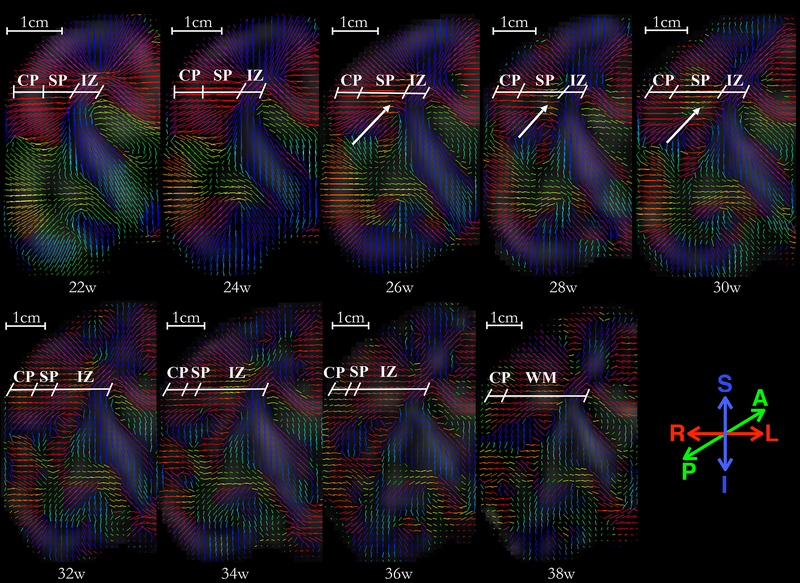
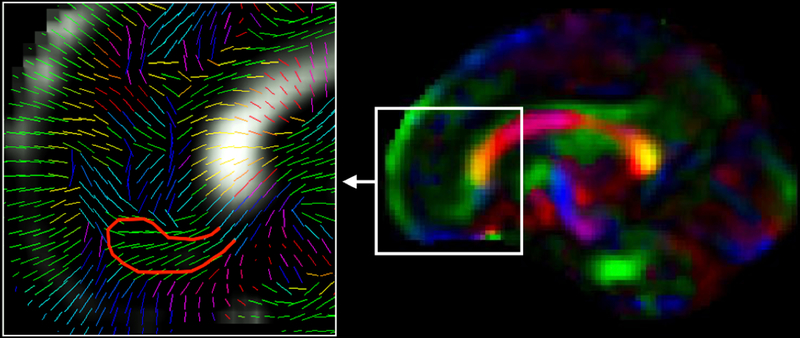
Altered structural fetal brain development has been linked to neuro-developmental disorders. These structural alterations can be potentially detected in utero using diffusion tensor imaging (DTI). However, acquisition and reconstruction of in utero fetal brain DTI remains challenging. Until now, motion-robust DTI methods have been employed for reconstruction of in utero fetal DTIs. However, due to the unconstrained fetal motion and permissible in utero acquisition times, these methods yielded limited success and have typically resulted in noisy DTIs. Consequently, atlases and methods that could enable groupwise studies, multi-modality imaging, and computer-aided diagnosis from in utero DTIs have not yet been developed. This paper presents the first DTI atlas of the fetal brain computed from in utero diffusion-weighted images. For this purpose an algorithm for computing an unbiased spatiotemporal DTI atlas, which integrates kernel-regression in age with a diffeomorphic tensor-to-tensor registration of motion-corrected and reconstructed individual fetal brain DTIs, was developed. Our new algorithm was applied to a set of 67 fetal DTI scans acquired from healthy fetuses each scanned at a gestational age between 21 and 39 weeks. The neurodevelopmental trends in the fetal brain, characterized by the atlas, were qualitatively and quantitatively compared with the observations reported in prior ex vivo and in utero studies, and with results from imaging gestational-age equivalent preterm infants. Our major findings revealed early presence of limbic fiber bundles, followed by the appearance and maturation of projection pathways (characterized by an age related increase in FA) during late 2nd and early 3rd trimesters. During the 3rd trimester association fiber bundles become evident. In parallel with the appearance and maturation of fiber bundles, from 21 to 39 gestational weeks gradual disappearance of the radial coherence of the telencephalic wall was qualitatively identified. These results and analyses show that our DTI atlas of the fetal brain is useful for reliable detection of major neuronal fiber bundle pathways and for characterization of the fetal brain reorganization that occurs in utero. The atlas can also serve as a useful resource for detection of normal and abnormal fetal brain development in utero.
Copyright © 2018 Elsevier Inc. All rights reserved.
Figures
Similar articles
-
Temporal slice registration and robust diffusion-tensor reconstruction for improved fetal brain structural connectivity analysis.Neuroimage. 2017 Aug 1;156:475-488. doi: 10.1016/j.neuroimage.2017.04.033. Epub 2017 Apr 19. Neuroimage. 2017. PMID: 28433624 Free PMC article.
-
In utero diffusion tensor imaging of the fetal brain: A reproducibility study.Neuroimage Clin. 2017 Jun 9;15:601-612. doi: 10.1016/j.nicl.2017.06.013. eCollection 2017. Neuroimage Clin. 2017. PMID: 28652972 Free PMC article.
-
A normative spatiotemporal MRI atlas of the fetal brain for automatic segmentation and analysis of early brain growth.Sci Rep. 2017 Mar 28;7(1):476. doi: 10.1038/s41598-017-00525-w. Sci Rep. 2017. PMID: 28352082 Free PMC article.
-
Delineating neural structures of developmental human brains with diffusion tensor imaging.ScientificWorldJournal. 2010 Jan 21;10:135-44. doi: 10.1100/tsw.2010.21. ScientificWorldJournal. 2010. PMID: 20098957 Free PMC article. Review.
-
Mapping fetal brain development in utero using magnetic resonance imaging: the Big Bang of brain mapping.Annu Rev Biomed Eng. 2011 Aug 15;13:345-68. doi: 10.1146/annurev-bioeng-071910-124654. Annu Rev Biomed Eng. 2011. PMID: 21568716 Free PMC article. Review.
Cited by
-
Coordinating cerebral cortical construction and connectivity: Unifying influence of radial progenitors.Neuron. 2022 Apr 6;110(7):1100-1115. doi: 10.1016/j.neuron.2022.01.034. Epub 2022 Feb 24. Neuron. 2022. PMID: 35216663 Free PMC article. Review.
-
Through-Plane Super-Resolution With Autoencoders in Diffusion Magnetic Resonance Imaging of the Developing Human Brain.Front Neurol. 2022 May 2;13:827816. doi: 10.3389/fneur.2022.827816. eCollection 2022. Front Neurol. 2022. PMID: 35585848 Free PMC article.
-
In vivo characterization of emerging white matter microstructure in the fetal brain in the third trimester.Hum Brain Mapp. 2020 Aug 15;41(12):3177-3185. doi: 10.1002/hbm.25006. Epub 2020 May 6. Hum Brain Mapp. 2020. PMID: 32374063 Free PMC article.
-
Deep learning-based parameter estimation in fetal diffusion-weighted MRI.Neuroimage. 2021 Nov;243:118482. doi: 10.1016/j.neuroimage.2021.118482. Epub 2021 Aug 26. Neuroimage. 2021. PMID: 34455242 Free PMC article.
-
Deep learning microstructure estimation of developing brains from diffusion MRI: a newborn and fetal study.bioRxiv [Preprint]. 2023 Jul 2:2023.07.01.547351. doi: 10.1101/2023.07.01.547351. bioRxiv. 2023. Update in: Med Image Anal. 2024 Jul;95:103186. doi: 10.1016/j.media.2024.103186. PMID: 37425859 Free PMC article. Updated. Preprint.
References
-
- Adluru N, Zhang H, Fox AS, Shelton SE, Ennis CM, Bartosic AM, Oler JA, Tromp DPM, Zakszewski E, Gee JC, Kalin NH, Alexander AL, 2012. A diffusion tensor brain template for Rhesus Macaques. Neuroimage 59, 306–318. https://doi.org/10.1016/j.neuroimage.2011.07.029 - DOI - PMC - PubMed
-
- Alexander AL, Lee JE, Lazar M, Field AS, 2007. Diffusion tensor imaging of the brain. Neurotherapeutics 4, 316–29. https://doi.org/10.1016/j.nurt.2007.05.011 - DOI - PMC - PubMed
-
- Arsigny V, Fillard P, Pennec X, Ayache N, 2006. Log-Euclidean metrics for fast and simple calculus on diffusion tensors. Magn. Reson. Med 56, 411–421. https://doi.org/10.1002/mrm.20965 - DOI - PubMed
-
- Ball G, Srinivasan L, Aljabar P, Counsell SJ, Durighel G, Hajnal JV, Rutherford MA, Edwards AD, 2013. Development of cortical microstructure in the preterm human brain. Proc. Natl. Acad. Sci 110, 9541–9546. https://doi.org/10.1073/pnas.1301652110 - DOI - PMC - PubMed
-
- Barona-Garcia J, 2014. Comparison of methodologies for creation of white matter fiber tract atlases. San Diego State University.
Publication types
MeSH terms
Grants and funding
LinkOut - more resources
Full Text Sources
Other Literature Sources
Medical
