

The burden of disease in Russia from 1980 to 2016: a systematic analysis for the Global Burden of Disease Study 2016
- PMID: 30173906
- PMCID: PMC6172188
- DOI: 10.1016/S0140-6736(18)31485-5
The burden of disease in Russia from 1980 to 2016: a systematic analysis for the Global Burden of Disease Study 2016
Abstract
Background: Over the past few decades, social and economic changes have had substantial effects on health and wellbeing in Russia. We aimed to use data from the Global Burden of Diseases, Injuries, and Risk Factors Study 2016 (GBD 2016) to evaluate trends in mortality, causes of death, years lived with disability (YLDs), years of life lost (YLLs), disability-adjusted life-years (DALYs), and associated risk factors in Russia from 1980 to 2016.
Methods: We estimated all-cause mortality by use of a multistage modelling process that synthesised data from vital registration systems, surveys, and censuses. A composite measure of health loss due to both fatal and non-fatal disease burden (DALYs) was calculated as the sum of YLLs and YLDs for each age, sex, year, and location. Health progress was evaluated in comparison with patterns of change in similar countries by use of the Socio-demographic Index that was developed for GBD 2016.
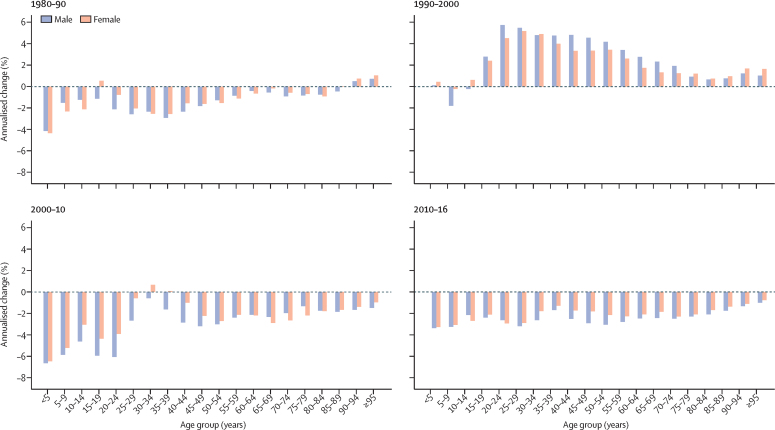
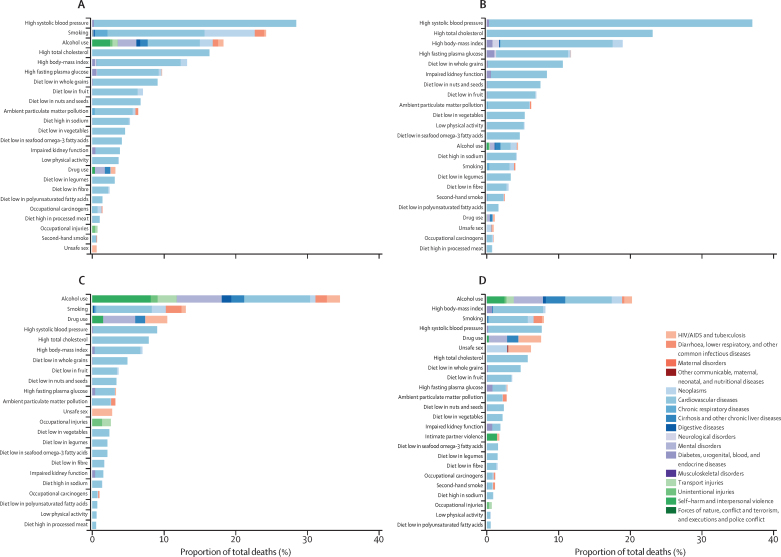
Findings: Following rapid decreases in life expectancy after the collapse of the Soviet Union, life expectancy at birth in Russia improved between 2006 and 2016. The all-cause mortality rate decreased by 16·6% (95% uncertainty interval 9·4-33·8) between 1980 and 2016. This overall decrease encompasses the cycles of sharp increases and plateaus in mortality that occurred before 2005. Child mortality decreased by 57·5% (53·5-61·1) between 2000 and 2016. However, compared with countries at similar Socio-demographic Index levels, rates of mortality and disability in Russia remain high and life expectancy is low. Russian men have a disproportionate burden of disease relative to women. In 2016, 59·2% (55·3-62·6) of mortality in men aged 15-49 years and 46·8% (44·5-49·5) of mortality in women were attributable to behavioural risk factors, including alcohol use, drug use, and smoking.
Interpretation: Trends in mortality in Russia from 1980 to 2016 might be related to complicated patterns of behavioural risk factors associated with economic and social change, to shifts in disease burden, and to changes in the capacity of and access to health care. Ongoing mortality and disability from causes and risks amenable to health-care interventions and behaviour modifications present opportunities to continue to improve the wellbeing of Russian citizens.
Funding: Bill & Melinda Gates Foundation.
Copyright © 2018 The Author(s). Published by Elsevier Ltd. This is an Open Access article under the CC BY 4.0 license. Published by Elsevier Ltd.. All rights reserved.
Figures
Comment in
-
Risk factor policies, morbidity, and mortality in Russia.Lancet. 2018 Sep 29;392(10153):1094-1095. doi: 10.1016/S0140-6736(18)32043-9. Epub 2018 Aug 30. Lancet. 2018. PMID: 30173908 No abstract available.
References
-
- Russian Federation Federal State Statistics Service Russia in figures. 2017. http://www.gks.ru/wps/wcm/connect/rosstat_main/rosstat/ru/statistics/pub... (in Russian).
-
- Vishnevsky A. We are once again to expect a natural decline in the population. 2015. http://www.narodsobor.ru/events/demography/26139-lnas-snova-zhdet-estest... (in Russian).
-
- GBD 2015 Risk Factors Collaborators Global, regional, and national comparative risk assessment of 79 behavioural, environmental and occupational, and metabolic risks or clusters of risks, 1990–2015: a systematic analysis for the Global Burden of Disease Study 2015. Lancet. 2016;388:1659–1724. - PMC - PubMed
Publication types
MeSH terms
LinkOut - more resources
Full Text Sources
Other Literature Sources
Miscellaneous
