. 2018 Sep 20;175(1):71-84.e18.
doi: 10.1016/j.cell.2018.08.004. Epub 2018 Aug 30.

Light Affects Mood and Learning through Distinct Retina-Brain Pathways

Affiliations

Light Affects Mood and Learning through Distinct Retina-Brain Pathways

Diego Carlos Fernandez et al. Cell. .

Abstract

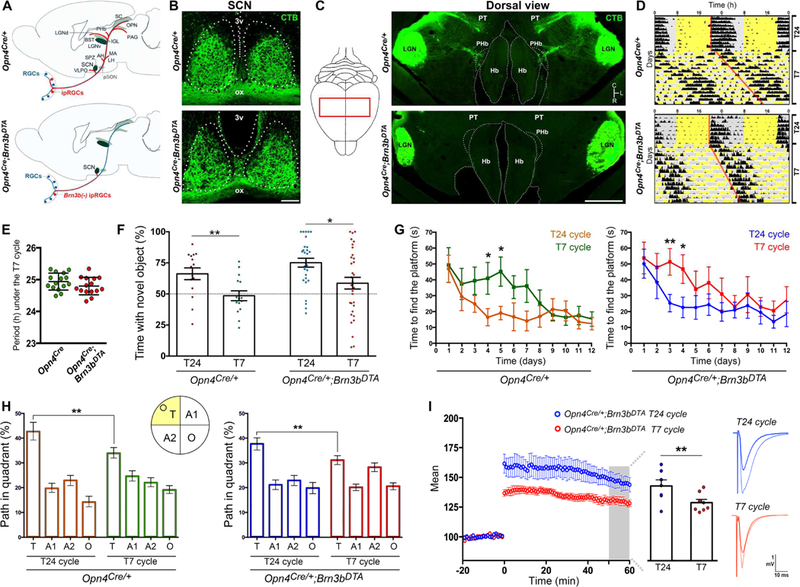
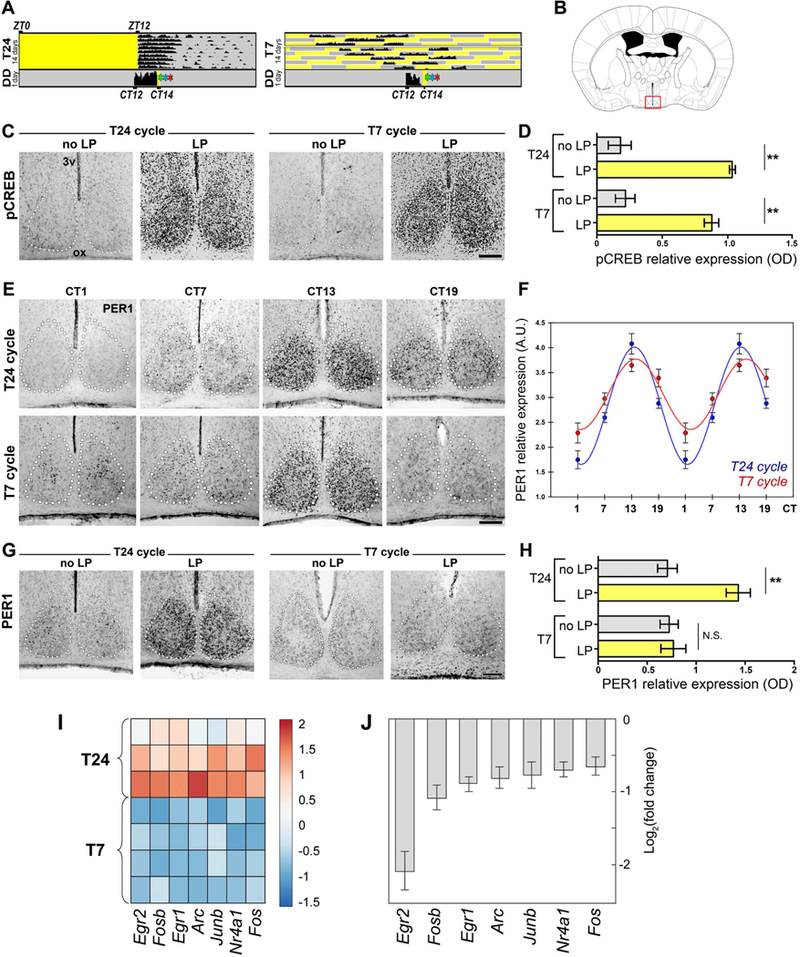
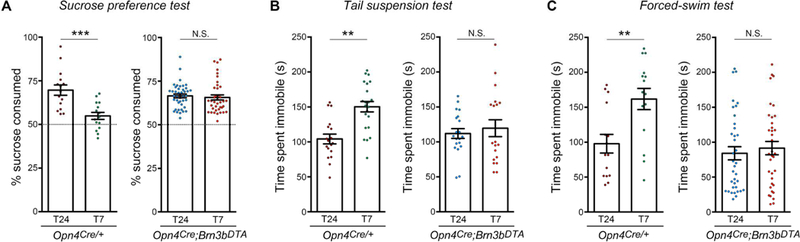
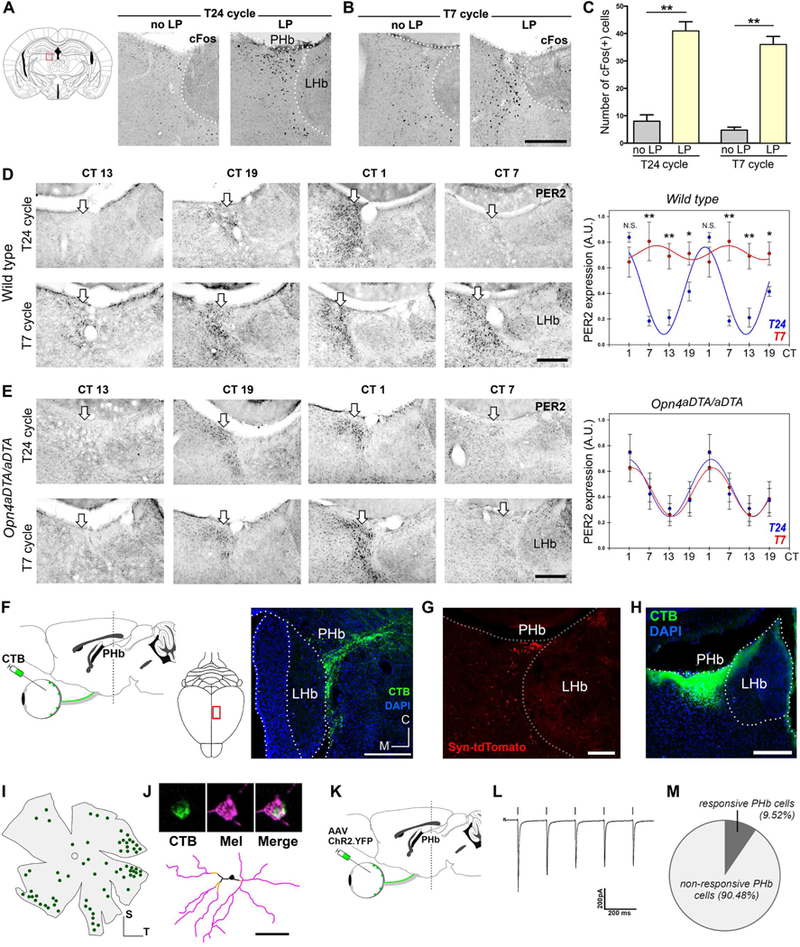
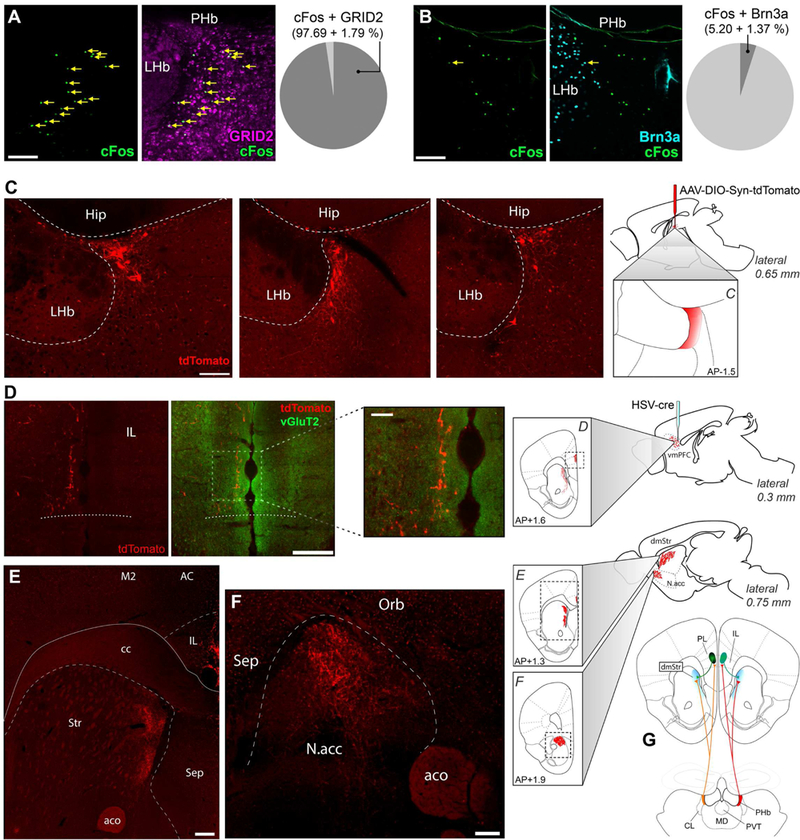
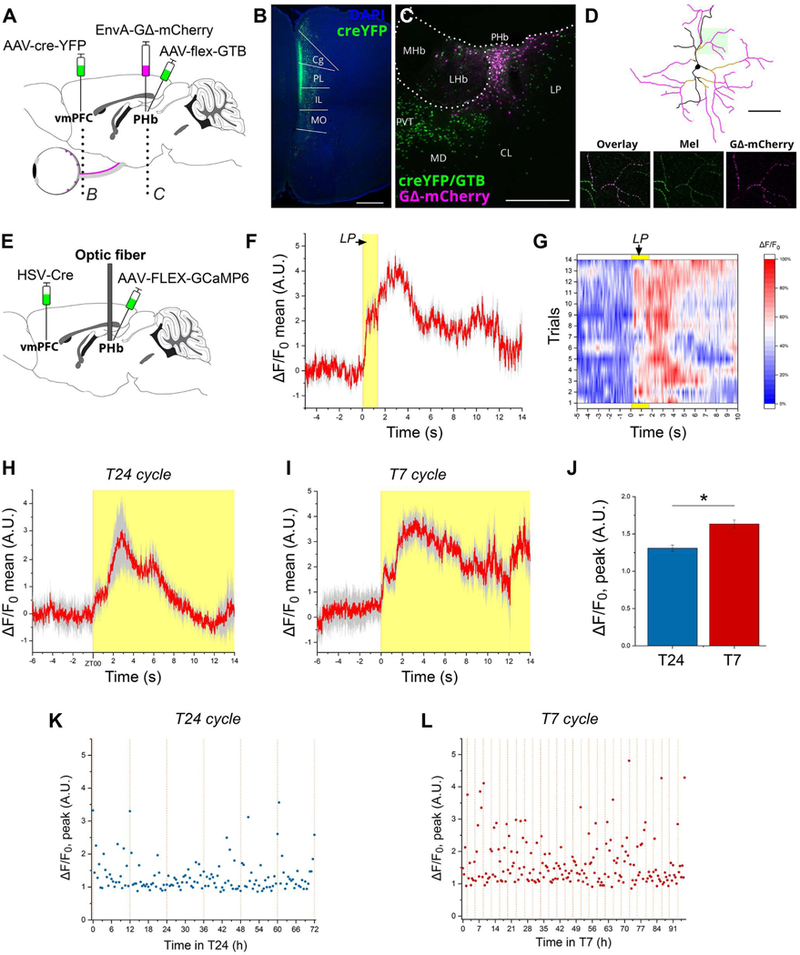
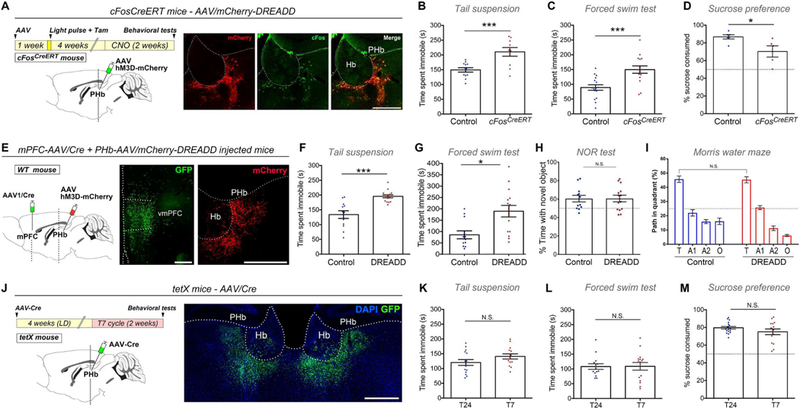
Light exerts a range of powerful biological effects beyond image vision, including mood and learning regulation. While the source of photic information affecting mood and cognitive functions is well established, viz. intrinsically photosensitive retinal ganglion cells (ipRGCs), the central mediators are unknown. Here, we reveal that the direct effects of light on learning and mood utilize distinct ipRGC output streams. ipRGCs that project to the suprachiasmatic nucleus (SCN) mediate the effects of light on learning, independently of the SCN's pacemaker function. Mood regulation by light, on the other hand, requires an SCN-independent pathway linking ipRGCs to a previously unrecognized thalamic region, termed perihabenular nucleus (PHb). The PHb is integrated in a distinctive circuitry with mood-regulating centers and is both necessary and sufficient for driving the effects of light on affective behavior. Together, these results provide new insights into the neural basis required for light to influence mood and learning.

Keywords: aberrant light cycle; circadian rhythms; ipRGCs; learning; mood; perihabenular nucleus; suprachiasmatic nucleus; ventromedial prefrontal cortex.


Conflict of interest statement

DECLARATION OF INTERESTS

The authors declare no competing financial conflicts of interest.

Figures

Figure 1.
Figure 1.. SCN-projecting ipRGCs drive light-induced cognitive deficits.
(A) Schemes showing ipRGC projections in Opn4Cre/+ (control) and Opn4cre/+ ;Brn3bzDTA mice. (B-C) Retinal projections (Bm3b(−) ipRGCs) were retained in the SCN, but absent in most ipRGC targets in Opn4Cre/+ ;Brn3bzDTA mice. (D-E) The pattern of locomotor activity and circadian periods length under the T7 cycle were similar between groups. Data are mean±SEM, by Student’s t test. n=15. (F) A significant reduction in the time exploring the novel object was observed in mice exposed to the T7 cycle vs. T24-housed mice. The statistical analysis compared to 50% (dotted lines) was: Opn4Cre/+: T24 p<0.01; T7 p=0.716; Opn4pCre/+ ;Brn3bDTA: T24 p<0.001; T7 p=0.754; by one sample t-test. n=15–35. (G-H) Using the MWM, we found significant deficits during learning (G) and test (H) trials in mice exposed to the T7 cycle, vs. T24-housed mice. n=12–14. (I) T7-housed Opn4Cre/+ ;Brn3bDTA mice showed significant LTP deficits, vs. T24-housed mice (n=8–10 mice). Data are mean±SEM. *p<0.05, **p<0.01, by Tukey’s test. 3v: third ventricle; ox: optic chiasm; LGN: lateral geniculate nucleus; Hb: habenular complex; PT: pretectum. Scale bars: 100μm (B), 1mm (C). See also Figure S1.
Figure 2.
Figure 2.. Photic responsiveness and gene expression in the SCN.
(A-B) T24 or T7-housed mice were kept in darkness for 1 day, exposed to a light pulse, and immediately perfused for assess pCREB levels (A, green star), perfused after 90 min for PER1 levels (A, red star), or after 60 min for SCN dissections (A, blue star). (C-D) A significant increase in pCREB levels were observed in both light pulse (LP) treated groups, vs. no light pulse (noLP) controls. Data are mean±SEM. **p<0.01; by Tukey’s test. n=5–6 mice. (E-F) No significant differences in the rhythmicity of PER1 levels were observed between groups (F). Data are mean±SEM; by Student’s f test. n=4–5 mice. (G-H) The exposure of mice to the T7 cycle affected the light-mediated induction of PERI in the SCN. Data are mean±SEM. **p<0.01; by Tukey’s test. n=5–6 mice.(I) Heat map of relative gene expression levels for selected immediate-early genes. (J) Fold change in expression level of immediate-early genes in T7 vs. T24 samples (T24: n=3, T7: n=4 replicates; SCN tissue was pooled from 3 mice per replicate, FDR-adjusted p<0.01 for all samples). 3v: third ventricle; ox: optic chiasm; DD: constant darkness; ZT: Zeitgebertime.Scale bars: l00μm.See also Figures S2 and S3.
Figure 3.
Figure 3.. ipRGC-SCN pathway is not involved in light-mediated mood alterations.
(A-C) Opn4Cre/+ mice housed under the T7 cycle showed mood alterations. These mood-related deficits induced by the T7 cycle were abolished in Opn4Cre/+;Brn3bzDTA mice. For the SPT, the total volume consumed (in ml) were: Opn4Cre/+: T24=5.3±1.2; T7=5.1±0.8; Opn4Cre/+ ;Brn3bDTA: T24=5.1±l.l; T7=5.8±0.8; by Tukey’s test. In addition, the statistical analysis vs. 50% (dotted lines, A) was: Opn4Cre/+: T24 p<0.01; T7 p= 0.30; Opn4Cre/+ ;Brn3bDTA: T24 p<0.01; T7 p<0.01; by one sample t-test). Data are mean±SEM. ***p<0.001, **p<0.01, by Tukey’s test. Opn4Cre/+ mice, n=15–16; Opn4Cre/+;Brn3bDTA mice, n=29–42.
Figure 4.
Figure 4.. Characterization of retinal input to the PHb.
(A-C) A significant increase in the number of light-induced c-Fos(+) cells in PHb were observed in both groups, vs. no light pulse controls. Data are mean±SEM. **p<0.01; by Tukey’s test. n=5 mice. (D-E) Immunohistochemical evidence for the rhythmic PER2 expression in the PHb (white arrows) in mice housed under the T24 or T7 cycles. In WT mice, PER2 levels exhibited circadian rhythmicity in the PHb under the T24 cycle, but the T7 cycle exposure significantly raised PER2 expression levels (D). In mice lacking ipRGC projections (Opn4aDTA/aDTA), PER2 rhythms in the PHb (E) became impervious to the effects of the T7 cycle. Data are mean±SEM. *p< 0.05, **p<0.01. by Student’s t test. n=4–5 mice. (F) Retinal projections to the PHb, traced by CTβ. (G) ipRGC afferents to PHb contain a synaptophysin fusion protein (Opn4CreERT;ROSASyn tdTomato). (H-J) CTβ was stereotaxically injected in the PHb (H), and all retrolabeled RGCs (I) were melanopsin(+) (J). Form a total of 49 ipRGCs analyzed, 46 cells were identified as Ml, and 3 were M3. n=8 mice. (K-M) Optogenetic evidence for functional connections between ipRGCs and PHb neurons. Current response in a representative PHb neuron is shown (L). A subpopulation of PHb neurons showed a ChR2- induced response to light pulses (M, n=63 cells). 3v: third ventricle; ox: optic chiasm; no LP: no light pulse; LP: light pulse. Scale bars: 100μm (J); 200μm (B, D, E, F, G, H). See also Figures S3 and S4.
Figure 5.
Figure 5.. Thalamic PHb projects to mood-regulating centers.
(A-B) Light induced cFos(+) cells in the PHb were colocalized with GRID2 (A) or Bm3a (B) markers. Data are mean±SEM; n=3 mice. (C-F) HSV/cre was injected into the vmPFC, while AAV/DIO-synaptophysin-tdTomato was injected into the PHb. Labeled somas were exclusively found in the PHb (C). PHb neurons have three targets: the vmPFC, including the IL (D), the dorsomedial striatum (E), and the NAc (F). n=12 mice. (G) These experiments revealed a thalamocortical loop, represented here diagrammatically. cc: corpus callosum; M2: secondary motor cortex; AC: anterior cingulate cortex; Str: striatum; aco: anterior commissure; Sep: septal nuclei; Orb: orbitofrontal cortex, Hip: hippocampus. Scale bars: (D insert) 50μm; (A, B, C) 100μm; (D, E, F) 200μm. See also Figure S5.
Figure 6.
Figure 6.. Disynaptic circuits connect ipRGCs to mood-regulating centers.
(A-D) A three-virus retrograde transynaptic tracing system was used to identify the retino-PHb-vmPFC pathway. EnvA-GΔRabies-mCherry expresses mCherry in PHb neurons expressing both Cre-EYFP and the Cre-dependent helper AAV (starter neurons) and presynaptic inputs to these neurons. A retrolabeled RGC expressing mCherry counterstained for melanopsin is shown (D). (E) The PHb was transfected with a fluorescent Ca2+ sensor by injecting a cre-dependent GCaMP6m vector in the PHb region and a retrogradely transported ere virus in the vmPFC. (F) Average response to a 2 s light pulse delivered at zeitgeber time (ZT) 18 to a mouse kept under the T24 cycle. The Ca2+ transient comprises a fast-rising component plateauing for 1.1 s before a second phase supervenes to generate a higher peak 3 s after light presentation. A biphasic response could bespeak either the transfection in our experimental design of two distinct (sub)populations that respond to light with different time courses, or a functional property of a single neuronal population. (G) A map of the 14 individual trials averaged in (F) is shown. (H) PHb activity following regularly-scheduled lights-on event in T24 cycle. (I) In T7 cycle, the PHb responds to dark-to-light transitions with a biphasic Ca2+ transient analogous to the one observed in T24 cycle. (J) Comparison of peak fluorescence in T24 vs. T7-housed mice recorded over 72 hours. Peak fluorescence in T7 cycle is significantly higher (**p<0.001; by Student’s t test). (K-L) Time course of peak fluorescence (calculated as the difference between maximum and median for each sample recording) recorded over multiple days in T24 or T7 cycles. Dashed orange lines indicate light transitions. Data are mean±SEM; n=3 mice. Scale bars: (D) l00μm; (C) 200μm; (B) 500μm. See also Figure S6.
Figure 7.
Figure 7.. Manipulation of PHb neuronal function alters affective behavior.
(A)c-FosCreERT/+ mice injected with an AAV5/DIO-hM3D-mCherry in the PHb, received a light pulse and 4-OH-Tam. Injection sites were evaluated for mCherry, and c-Fos staining was used to confirm CNO- neuronal activation. (B-C) Chronic activation of light-responsive PHb neurons leads to behavioral alterations. n=10–16. (D) The SPT was evaluated in c-FosCreERT/+ and control injected-mice that received CNO twice a day (see STAR Methods). c-FosCreERT/+ injected-mice displayed a significant reduced preference for sucrose, vs. control group. n=5–7. (E) vmPFC-projecting PHb cells were chronically activated in mice that were bilaterally injected in the vmPFC with a retrogradely-transported AAV/Cre (J-K), and an AAV5/DIO-hM3D-mCherry in PHb. (F-G) CNO treatment in DREADD-injected mice caused a significant increased in the immobility time in the TST (F), and FST (G), vs. control mice. n=12–15. (H-I) CNO treatment in DREADD-injected mice had no effect on cognitive functions. For the NOR test (H), the statistical analysis vs. 50% (dotted lines) was: Control: p<0.05; DREADD: p<0.05; by one sample t-test. Using the MWM test, we found no significant deficits during the test (I) trial. n=12–14. (J) AAV5/Cre-GFP was bilaterally injected into the PHb of mice that express tetanus toxin (tetX) in a Cre-dependent manner. GFP expression confirms injection site that included the PHb and was largely restricted to immediately adjoining thalamic nuclei. (K-M) Suppressing PHb synaptic output eliminated any statistical difference in the TST (K), FST (L), and SPT (M) between mice housed under the T24 or T7 cycles. For the SPT, the statistical analysis compared to 50% (dotted lines, M) was: T24 p<0.001; T7 p<0.001; by one sample t-test). n=14–15. Data are mean±SEM. */> 0.05; ***p<0.001, by Student’s / test. Hb: habenular complex. Scale bars: 200μm. See also Figures S6 and S7.

Comment in

References

    1. Altimus CM, Güler AD, Villa KL, McNeill DS, Legates TA, and Hattar S (2008). Rods-cones and melanopsin detect light and dark to modulate sleep independent of image formation. Proc. Natl. Acad. Sci. U. S. A. 105, 19998–20003. - PMC - PubMed
    1. Bedrosian TA, Fonken LK, Walton JC, Haim A, and Nelson RJ (2011). Dim light at night provokes depression-like behaviors and reduces CA1 dendritic spine density in female hamsters. Psychoneuroendocrinology 36, 1062–1069. - PubMed
    1. Berson DM, Dunn FA, and Takao M (2002). Phototransduction by retinal ganglion cells that set the circadian clock. Science 295, 1070–1073. - PubMed
    1. Can A, Dao DT, Terrillion CE, Piantadosi SC, Bhat S, and Gould TD (2012). The tail suspension test. J. Vis. Exp e3769. - PMC - PubMed
    1. Charan J, and Kantharia N (2013). How to calculate sample size in animal studies? J. Pharmacol. Pharmacother. 4, 303. - PMC - PubMed

Publication types

MeSH terms