. 2018 Sep 20;175(1):85-100.e23.
doi: 10.1016/j.cell.2018.08.011. Epub 2018 Aug 30.

Memory B Cells Activate Brain-Homing, Autoreactive CD4+ T Cells in Multiple Sclerosis

Affiliations

Memory B Cells Activate Brain-Homing, Autoreactive CD4+ T Cells in Multiple Sclerosis

Ivan Jelcic et al. Cell. .

Abstract

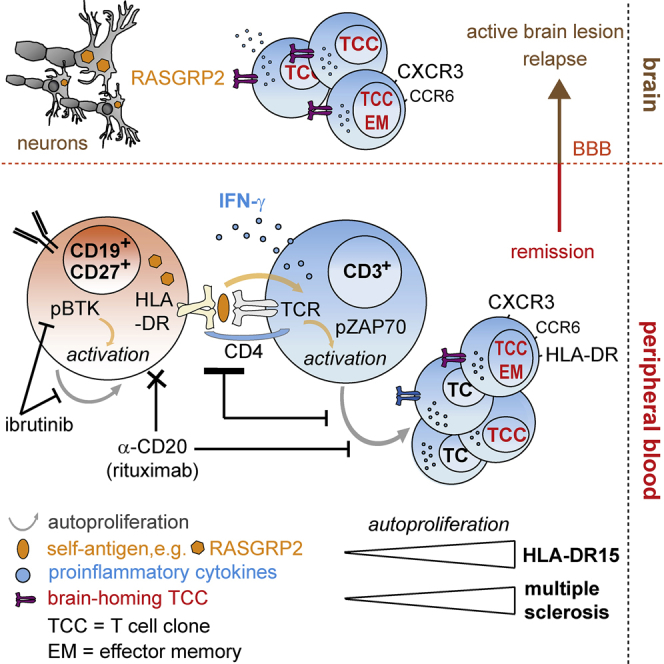
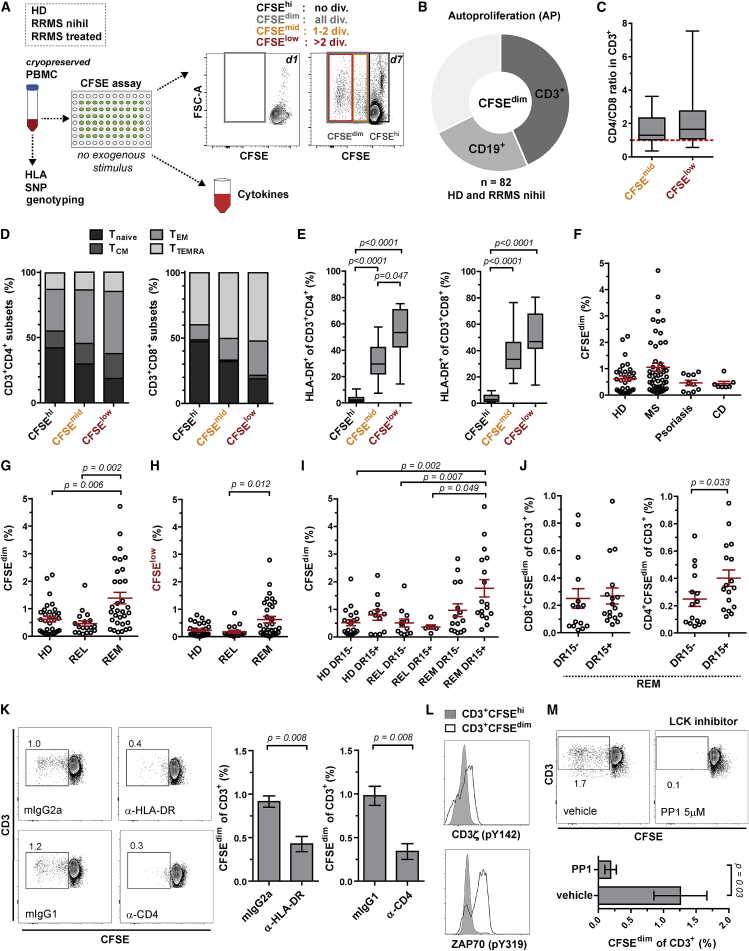
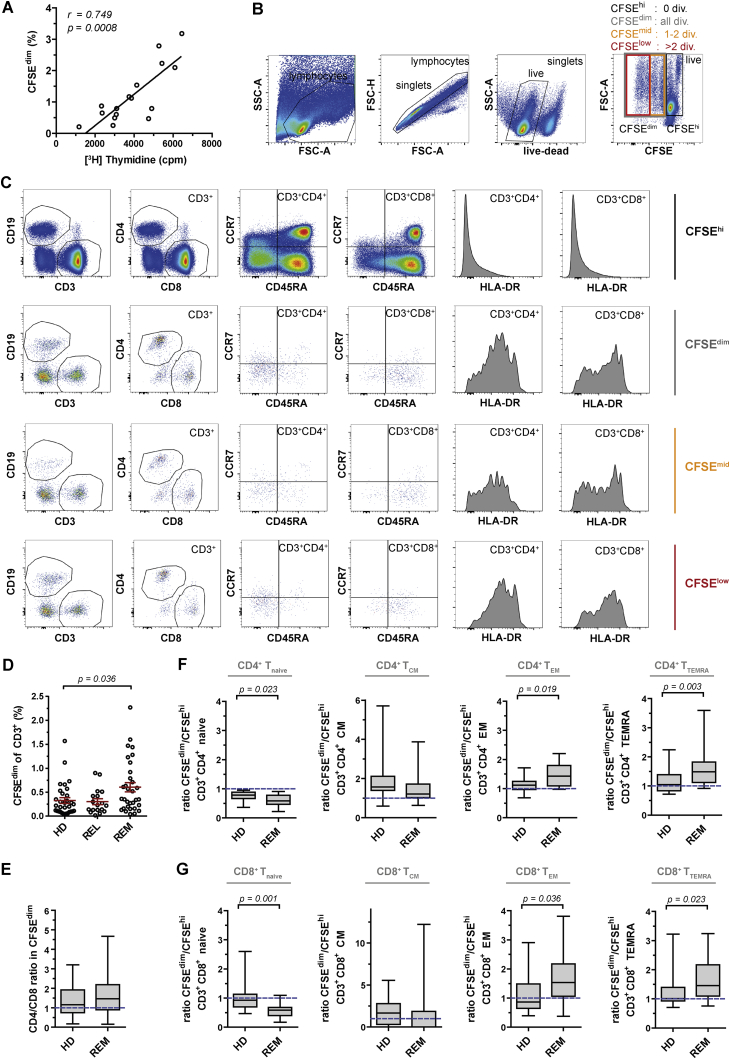
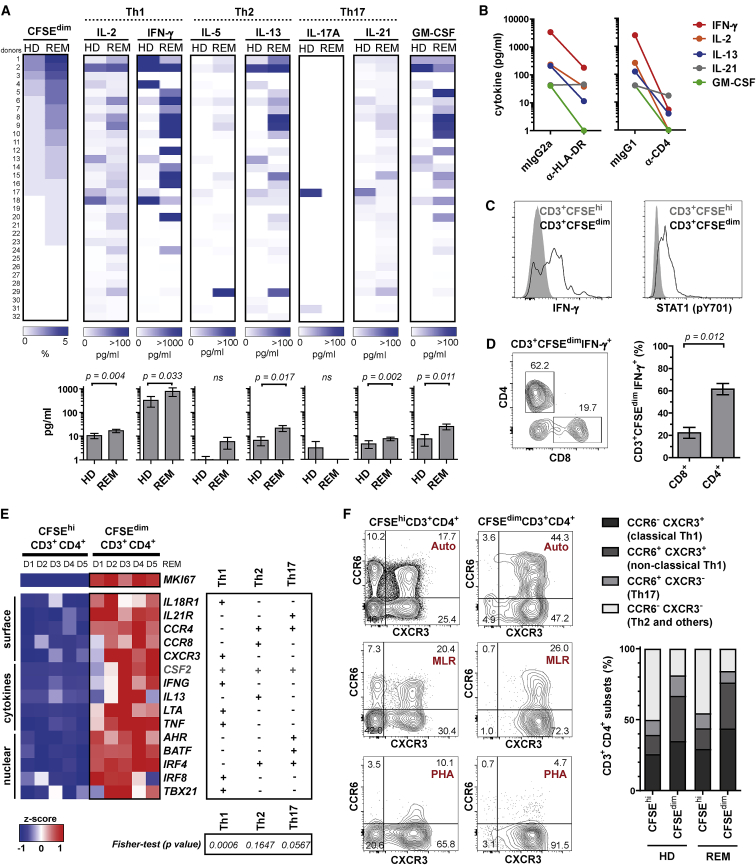
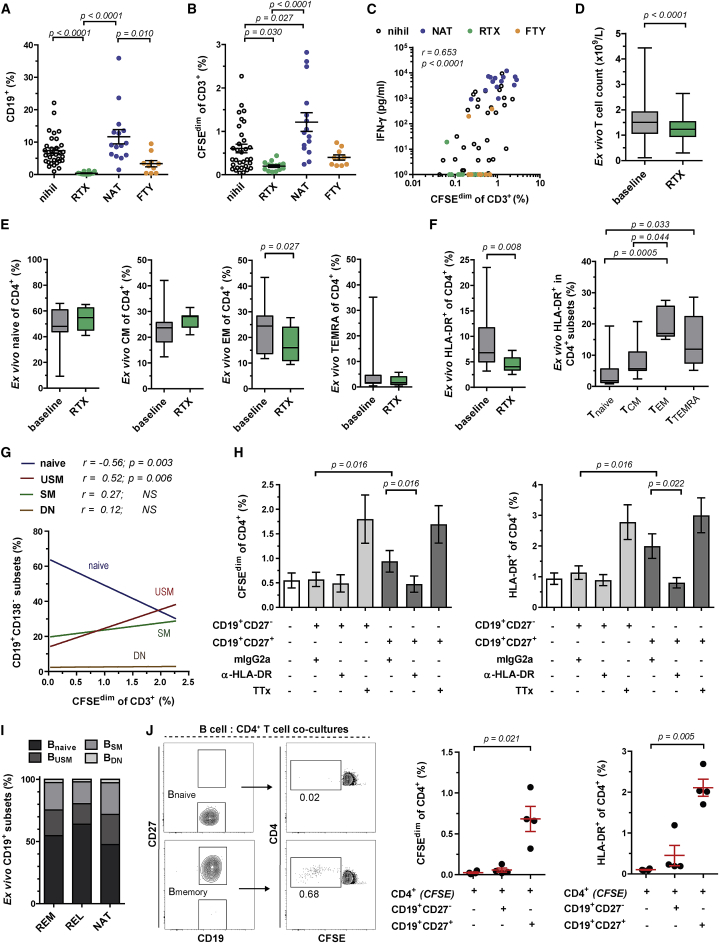
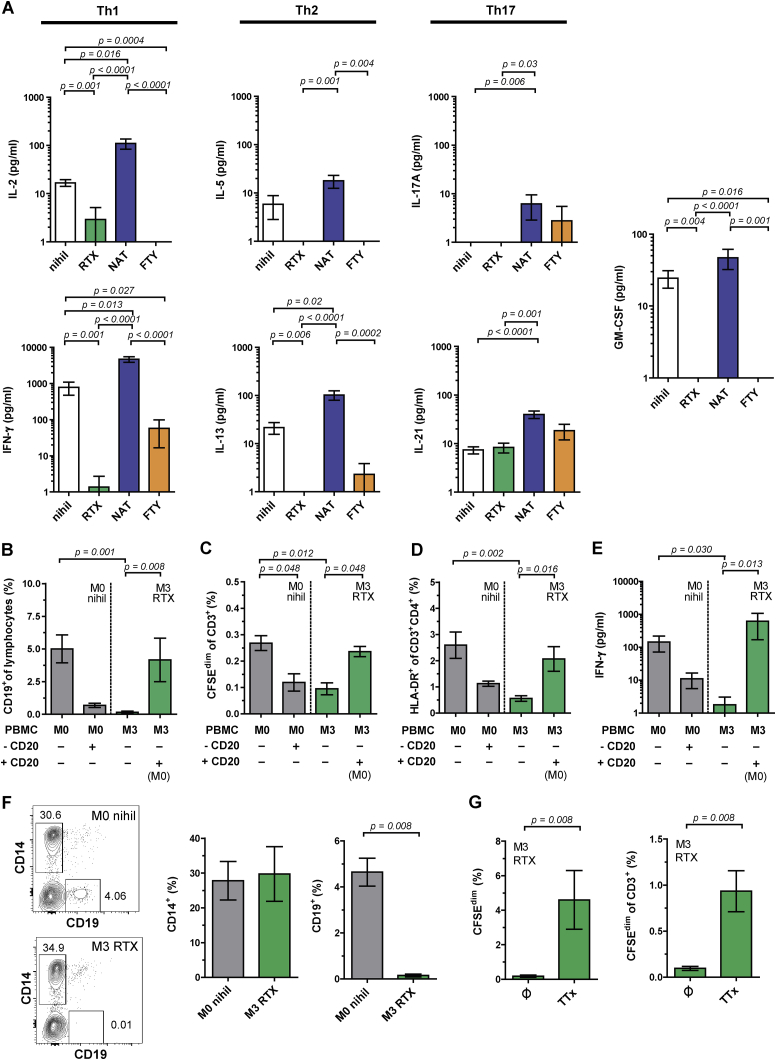
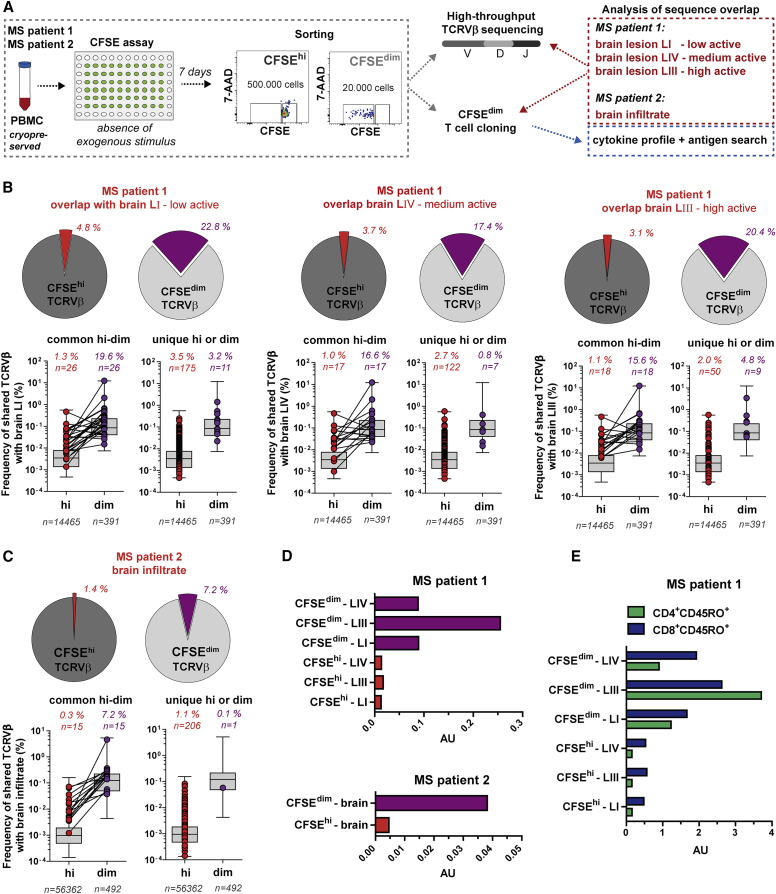
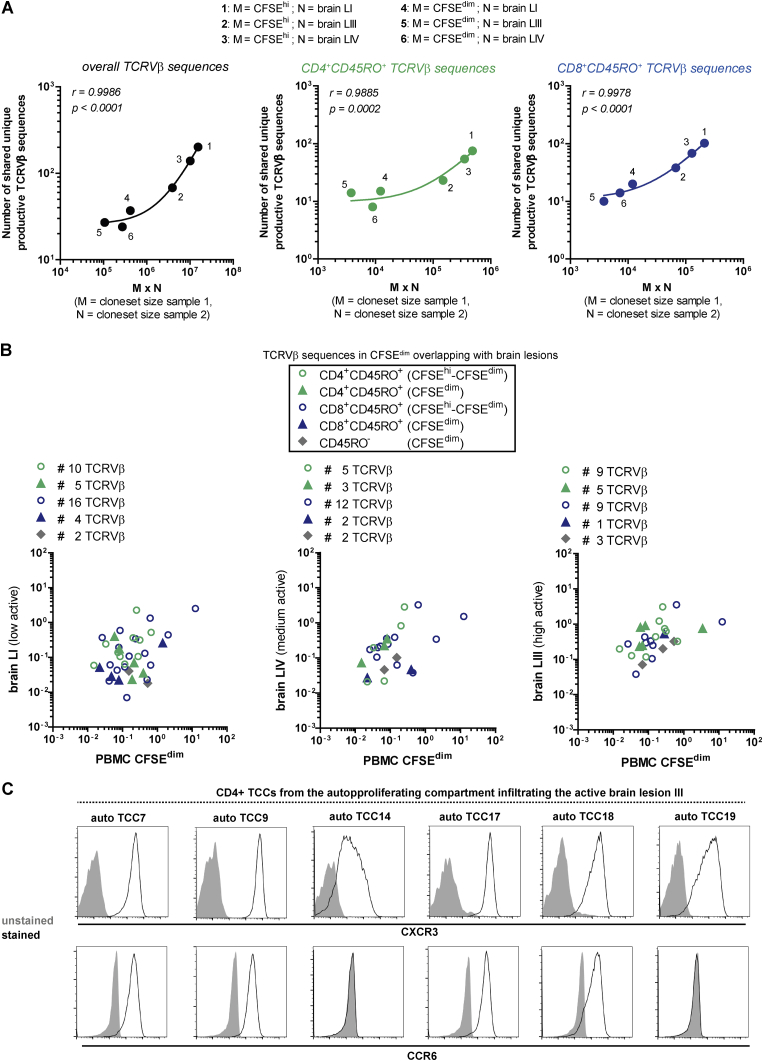
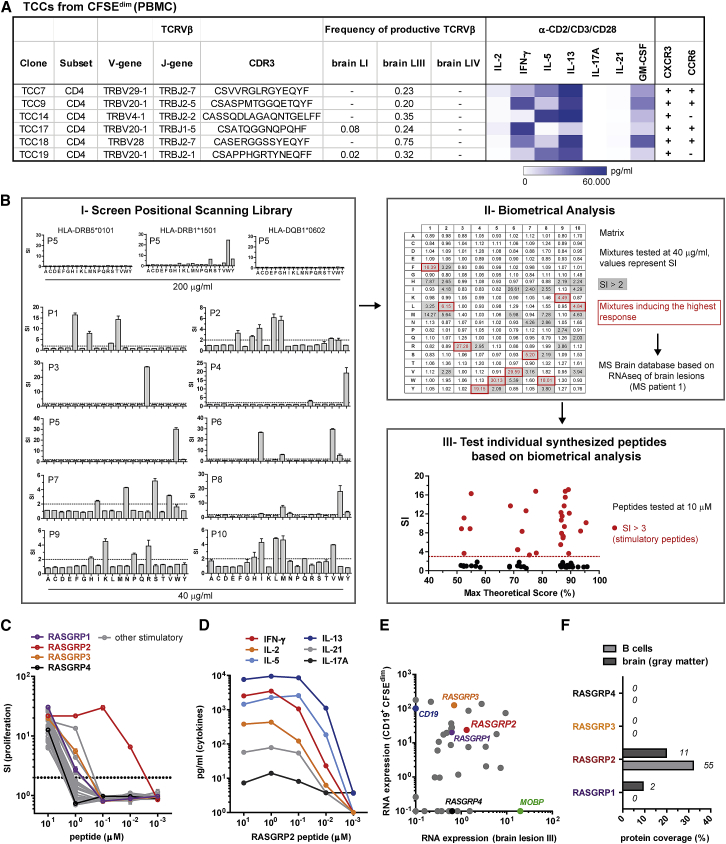
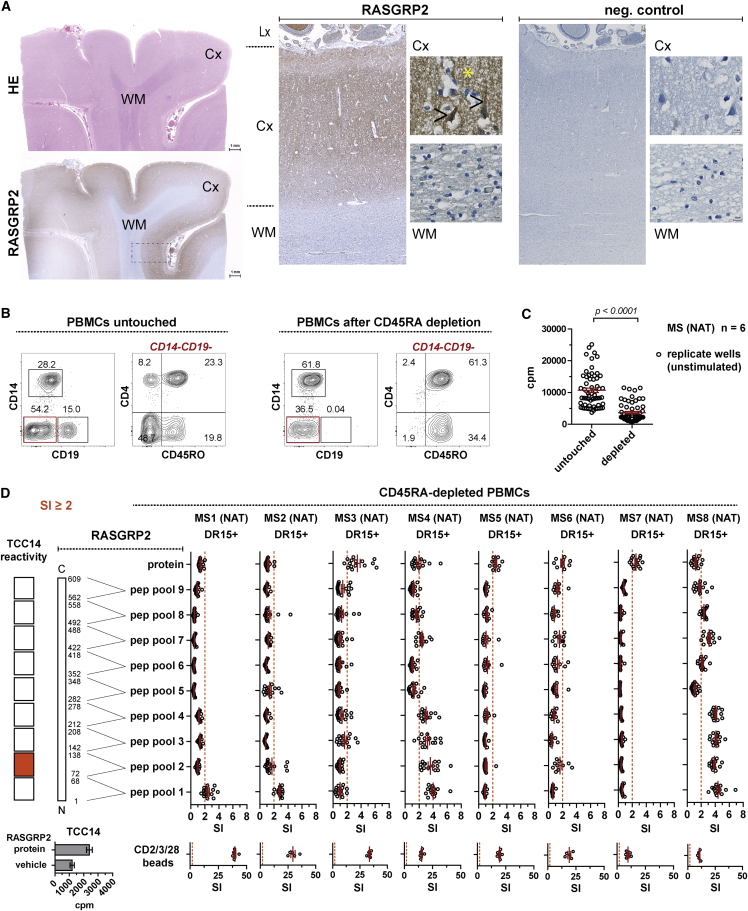
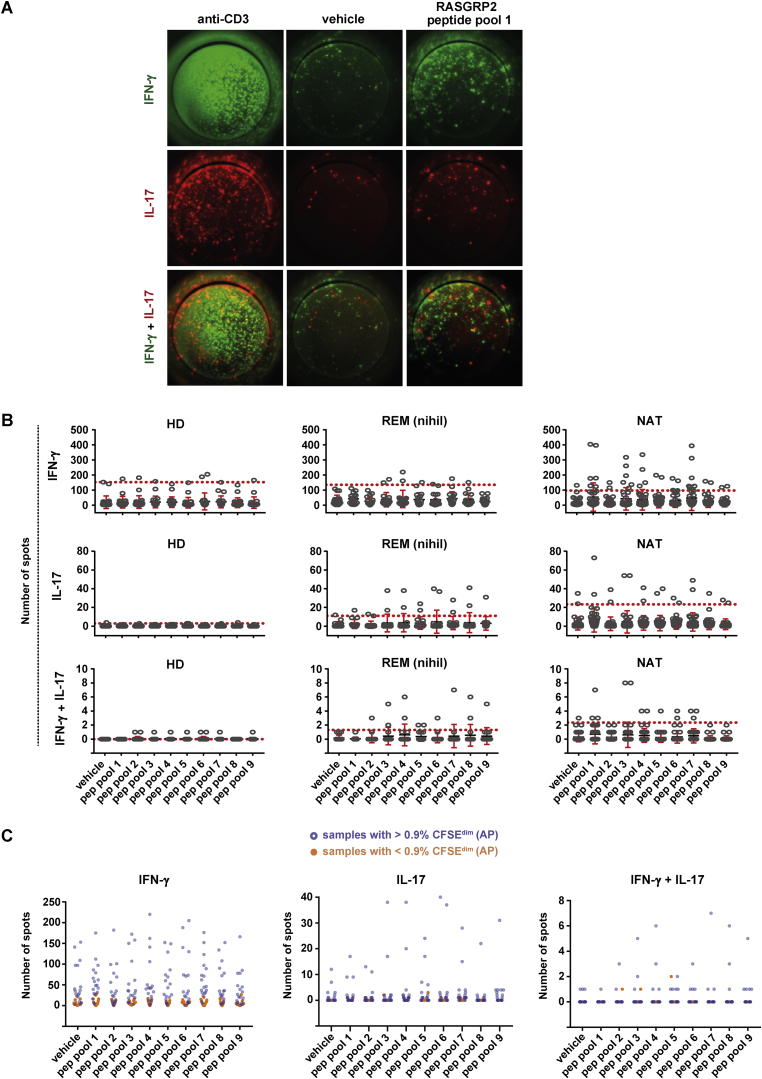
Multiple sclerosis is an autoimmune disease that is caused by the interplay of genetic, particularly the HLA-DR15 haplotype, and environmental risk factors. How these etiologic factors contribute to generating an autoreactive CD4+ T cell repertoire is not clear. Here, we demonstrate that self-reactivity, defined as "autoproliferation" of peripheral Th1 cells, is elevated in patients carrying the HLA-DR15 haplotype. Autoproliferation is mediated by memory B cells in a HLA-DR-dependent manner. Depletion of B cells in vitro and therapeutically in vivo by anti-CD20 effectively reduces T cell autoproliferation. T cell receptor deep sequencing showed that in vitro autoproliferating T cells are enriched for brain-homing T cells. Using an unbiased epitope discovery approach, we identified RASGRP2 as target autoantigen that is expressed in the brain and B cells. These findings will be instrumental to address important questions regarding pathogenic B-T cell interactions in multiple sclerosis and possibly also to develop novel therapies.

Keywords: B cells; HLA-DR15; RASGRP2; T cell receptor; T cells; autoproliferation; brain; multiple sclerosis; pathogenesis.


Figures

None
Graphical abstract
Figure 1
Figure 1
AP of Peripheral Lymphocytes Increases during REM and Depends on CD4-HLA-DR-TCR Interactions (A) Workflow for assessing AP in vitro using CFSE-labeled PBMCs in serum-free medium and in the absence of exogenous stimulus for 7 days. (B) Proportion of B and T cells among CFSEdim (AP) cells (mean; n = 82 RRMS and HDs). (C–E) CD4/CD8 ratio of T cells (C), naive/memory (D), and activated HLA-DR-expressing (E) CD4+ and CD8+ T cells in CFSEhi, CFSEmid, and CFSElow cells (n = 20 RRMS and HDs; in C and E, whiskers: min-max; in D, mean). T cell subsets: Tnaive CD45RA+CCR7+; TCM CD45RACCR7+; TEM CD45RACCR7; TTEMRA CD45RA+CCR7. (F) AP of HDs (n = 32) and untreated patients with RRMS (n = 50), psoriasis (n = 10), and Crohn’s disease (CD; n = 7) (mean ± SEM). (G and H) Frequency of all (CFSEdim) (G) or only high (CFSElow) (H) AP cells for HDs (n = 32), untreated RRMS patients in relapse (REL; n = 18) or remission (REM; n = 32) (mean ± SEM; Kruskal-Wallis test). (I) AP in HLA-DR15 and DR15+ HDs (n = 32), REL (n = 18), and REM (n = 32) (mean ± SEM; Kruskal-Wallis test). (J) Frequency of AP CD4+ and CD8+ T cells in HLA-DR15 (n = 15) and DR15+ (n = 17) REM (mean ± SEM; Mann-Whitney U test). (K) AP of T cells upon blocking HLA-DR, CD4, or with isotype controls (mean ± SEM; n = 5 REM; Mann-Whitney U test). (L) Phosphorylation of CD3ζ and ZAP-70 in AP T cells. Representative example out of 3 REM are shown. (M) AP of T cells with and without treatment with the selective LCK inhibitor PP1 (mean ± SEM; n = 4 REM; Mann-Whitney U test). See also Figures S1 and S2 and Tables S1, S2, and S3.
Figure S1
Figure S1
Effector Memory T Cells Enrich in the Autoproliferating Compartment of RRMS Patients in Remission Independent of the Rounds of Cell Divisions, Related to Figure 1 and Table S1 (A) Cell proliferation measured by CFSE-labeling (CFSEdim) was compared to thymidine incorporation assay using the same donors and equal amounts of PBMCs and incubating for 7 days in serum-free medium and absence of exogenous stimulus (Spearman’s rank correlation test). (B and C) Gating strategy of CFSE-labeled cells after 7 days of AP, analyzed by flow cytometry. (B) Gating on singlets, live- and then on CFSEdim cells including all cell divisions (div.), CFSEmid including 1-2 divisions, CFSElow including more than 2 divisions, or non-proliferating resting cells (CFSEhi). (C) Exemplary cell subset phenotyping of the CFSEdim, CFSEmid, CFSElow and CFSEhi cell compartment showing increasing HLA-DR expression with increasing proliferation. (D) Frequency of AP T cells (CFSEdimCD3+) for each HD (n = 32), untreated RRMS in relapse (REL; n = 18) and RRMS in remission (REM; n = 32) (mean ± SEM; Kruskal-Wallis test). (E) CD4/CD8 ratio in the CFSEdimCD3+ compartment of HD (n = 32) and REM (n = 32) (whiskers: min - max). Dotted line at ratio of 1 indicates equal distribution of CD4+ and CD8+ T cells. (F and G) Ratio of naive/memory cell subset frequency in CFSEdim versus CFSEhi compartment of (F) CD4+ and (G) CD8+ T cells respectively is shown for HD (n = 15) and REM (n = 24) (whiskers: min - max; Mann-Whitney U test). A ratio of 1 (dotted line) indicates an equal proportion of the appropriate T cell subset in the CFSEdim and CFSEhi compartment. T cell subsets: Tnaive CD45RA+CCR7+; TCM CD45RA-CCR7+; TEM CD45RA-CCR7-; TTEMRA CD45RA+CCR7-.
Figure S2
Figure S2
IFN-γ Secretion Is Strongly Increased during AP in RRMS (REM) but Is Not the Cause of Increased AP, Related to Figures 1 and 2 and Table S1 (A) A second cohort of HD (n = 14; for PHA n = 10) and REM (n = 14; for PHA n = 12) was used to assess AP (unstimulated) and reactivities to conventional B- (α-IgM) or T cell stimulation with polyclonal/broad (MLR, PHA) or antigen-specific (TTx) activation using CFSE-labeling and subsequent co-culture for 7 days in serum-free medium. Frequency of all proliferating (CFSEdim) cells for each HD and REM under the different conditions is depicted (mean ± SEM; Mann-Whitney U test). (B) Secretion of Th1 (IL-2, TNF, IFN-γ), Th2 (IL-4, IL-5, IL-13) and Th17 (IL-17A, IL-21, IL-22) cytokines in supernatants collected after 7 days of AP (no stimulus), conventional B- (α-IgM) or T cell stimulation with polyclonal (MLR) or antigen-specific (TTx) activation from HD (n = 14) and REM (n = 14; for TTx n = 13) (mean ± SEM; Mann-Whitney U test). (C) Levels of IFN-γ and GM-CSF secretion in HLA-DR15-and DR15+ HD (DR15- n = 20 and DR15+ n = 12) and REM (DR15- n = 15 and DR15+ n = 17; whiskers: min - max). Cytokine measurement was performed with bead-based immunoassay and GM-CSF by ELISA. (D) Frequency of CFSEdim cell population (gray bars) in the presence of blocking IFN-γ, blocking GM-CSF or appropriate isotype control antibodies (mean ± SEM; n = 5 REM). Cytokine neutralization (blue line) in supernatant is depicted exemplarily for one of the donors.
Figure 2
Figure 2
AP Involves Classical and Non-classical Th1 Cells with Increased Proinflammatory Responses in MS (A) AP (% CFSEdim) and cytokine secretion profile for each donor (n = 32 HDs; n = 32 REM) after 7-day culture. Subject values are organized according to their AP strength. The graphs under the heatmap represent the mean cytokine secretion in supernatants (mean ± SEM; Mann-Whitney U test). (B) Mean cytokine response following AP in the presence of blocking HLA-DR, CD4, or isotype controls (n = 5 REM). (C) Intracellular IFN-γ and phosphorylation of STAT1 in CFSEhi and CFSEdim (AP) T cells. Representative example out of 5 REM. (D) Proportion of CD4 and CD8 subsets in AP IFN-γ+ T cells (mean ± SEM; n = 5 REM; Mann-Whitney U test). (E) RNA sequencing data of sorted CFSEhi and CFSEdim (AP) CD4+ T cells (n = 5 REM) for Th1, Th2, and Th17 gene sets, each defined by 17 subset-specific genes. MKI67 served as control transcript for proliferation. The differential expression shows only significantly upregulated genes (log2 >1.0; false discovery rate [FDR] <0.01) in AP CD4+ T cells and is expressed by the z-score based on the reads per kilobase million (RPKM) values. Th gene sets were tested for significance (Fisher test). (F) Distribution of classical Th1 (CXCR3+CCR6), non-classical Th1 (CXCR3+CCR6+), and Th17 (CXCR3CCR6+) cells in the CFSEhi and CFSEdim compartment, exemplarily shown for AP, MLR, and PHA in one donor and as mean for AP in HDs (n = 9) and REM (n = 13). See also Figure S2 and Table S1.
Figure S3
Figure S3
B Cells Participate in AP and Maintain and Drive AP T Helper Cells in MS, Related to Figure 3 and Table S1 (A) Proportion of CD3+ and CD19+ cells (pie charts) in the CFSEdim compartment of HD (n = 14; for PHA n = 10) and REM (n = 14; for PHA n = 12) after AP (unstimulated) and reactivities to conventional B- (α-IgM) or T cell stimulation with polyclonal/broad (MLR, PHA) or antigen-specific (TTx) activation using CFSE-labeling and subsequent co-culture for 7 days in serum-free medium. (B–D) Sorted and subsequently expanded (PHA, IL-2) AP cells (CFSEdim) from DR15+ HD and REM were tested for their reactivity on autologous EBV-transformed B cells. For the co-culture experiments, we incubated 2x10⁵ CFSE-labeled expanded bulk T cells either alone or with 5x10⁵ irradiated (300 Gy) autologous EBV-transformed B cells in the absence of any stimulus or the presence of blocking HLA-DR (L243) antibody or PHA, respectively. After 72 hours, 4 replicate wells of each condition were pooled and analyzed for survival (live-dead marker) and proliferation (CFSE) by flow cytometry. Cells were gated first on CD4+ T cells to exclude B cells, prior to analysis of live cells and then on proliferating cells. (B) Exemplary dot plots of the different conditions shown for one HD and one REM. (C) Survival and (D) proliferation results of DR15+ HD (n = 5) and REM (n = 5) (mean ± SEM).
Figure 3
Figure 3
B-T Cell Interaction Promotes AP in a HLA-DR- and BTK-Dependent Manner (A) Correlation and frequency of AP B and T cells in HDs (n = 32) and RRMS (n = 18 REL; n = 32 REM; Spearman’s rank correlation test). (B) T/B cell ratio in the proliferating compartment after AP, MLR, or α-IgM stimulation (HDs, n = 14; REM, n = 14; whiskers: min-max). (C) AP B cells in HLA-DR15 (n = 15) and DR15+ (n = 17) REM (mean ± SEM). (D) AP and IFN-γ secretion of T cells without or after depletion of B cells (W) and after separation of B cells into transwells (T) (mean ± SEM; CFSE: n = 6 REM; IFN-γ: n = 5 REM; Kruskal-Wallis test). (E) Distribution of B cell subsets (Bnaive CD27IgD+; BUSM CD27+IgD+; BSM CD27+IgD; BDN CD27IgD) in CFSEhi and AP CFSEdim (mean; n = 8 REM). (F) HLA-DR expression of CFSEhi and AP CFSEdim B cells (mean ± SEM; n = 18 REM; Mann-Whitney U test). (G) Sorting of CFSEhi and CFSEdim B cells following AP, incubation with control or HLA-DR-blocking antibodies and transfer into B cell-depleted and CFSE-labeled autologous PBMCs. Proliferation and activation of CD4+ T cells were assessed after 7 days of stimulus-free co-culture (mean ± SEM; n = 3 REM). (H) AP of B and CD4+ T cells in the presence of isotype control or α-CD40-blocking antibody. Representative example out of 3 REM is shown. (I) AP of B and CD4+ T cells upon addition of the selective BTK inhibitor ibrutinib or vehicle (DMSO) control (left graph). Right graph shows the HLA-DR expression (line) and survival (numbers) of B cells (mean ± SEM; n = 3 REM). (J) Phosphorylation of BTK in AP B cells. Representative example out of 3 REM is shown. See also Figure S3 and Table S1.
Figure 4
Figure 4
In Vivo B Cell Depletion Reduces Memory B Cell-Induced Activation of T Helper Cells (A and B) Frequency of B cells (A) and AP T cells (B) in REM (nihil; black; n = 32) and RRMS patients under rituximab (RTX; green; n = 14), natalizumab (NAT; blue; n = 15), or fingolimod (FTY; orange; n = 10) treatment (mean ± SEM; Kruskal-Wallis test). (C) Correlation between IFN-γ secretion and AP T cells (Spearman’s rank correlation test). (D) Ex vivo T cell counts in fresh blood of MS patients before (baseline) and after RTX therapy (n = 179; whiskers: min-max; Wilcoxon matched-pairs signed-rank test). (E and F) Ex vivo frequency of naive/memory (E) and activated (F, left) CD4+ T cells in fresh blood of RRMS patients before (REM, nihil) and after RTX treatment. Right panel (F) shows the distribution of naive/memory subsets in activated CD4+ T cells before RTX (E and F: n = 9; whiskers: min-max; Wilcoxon matched-pairs signed-rank and Kruskal-Wallis test). (G) Correlation between AP T cells and ex vivo peripheral B cell subsets in REM (n = 27; Spearman’s rank correlation test). (H) AP and activation of CD4+ T cells upon transfer of CD27 naive and CD27+ memory B cells of MS patients before RTX to CFSE-labeled autologous PBMCs from time point of RTX therapy. B cells were incubated with isotype control or HLA-DR-blocking antibodies before transfer (mean ± SEM; n = 7; Wilcoxon matched-pairs signed-rank test for naive versus memory and mIgG2a versus α-HLA-DR). (I) Distribution of ex vivo peripheral B cell subsets in REM (n = 27), REL (n = 10), and NAT (n = 10). (J) Sorted naive and memory B cells were co-cultured with autologous CFSE-labeled CD4+ T cells to assess AP and activation of CD4+ T cells after 7 days (mean ± SEM; n = 4 REM; Kruskal-Wallis test). See also Figure S4 and Table S1.
Figure S4
Figure S4
B Cell Depletion Reduces AP and Proinflammatory Cytokine Response, whereas Response to Control Antigen Remains, Related to Figure 4 and Table S1 (A) Secretion of Th1 (IL-2, IFN-γ), Th2 (IL-5, IL-13), Th17 (IL-17A, IL-21) cytokines and GM-CSF in supernatants collected after 7 days of AP from untreated and treated RRMS patients (REM, nihil, black, n = 32; RTX, green, n = 14; NAT, blue, n = 15; FTY, orange, n = 10; mean ± SEM; Kruskal-Wallis test). (B–E) CFSE-labeled PBMCs of MS patients before onset of (M0 = month 0) and after RTX treatment (M3 = 3 months) as well as conditions with deletion and transfer of CD20+ cells from PBMCs before onset of RTX (M0) to autologous PBMCs after RTX therapy (M3) were cultured for 7 days in the absence of exogenous stimulus. Samples were analyzed for the frequency of (B) B cells (C) AP T cells, (D) activated HLA-DR+CD4+ T cells and (E) IFN-γ secretion (mean ± SEM; n = 5; Kruskal-Wallis test). (F) Ex vivo frequency of monocytes and B cells in longitudinal RTX MS samples (mean ± SEM; n = 5; Mann-Whitney U test). (G) Response of PBMCs from RTX-treated MS patients in 7-day CFSE assay without antigen or in presence of tetanus toxoid (TTx) as control antigen by assessing frequency of proliferating CFSEdim and proliferating T cells (mean ± SEM; n = 5; Mann-Whitney U test).
Figure 5
Figure 5
Peripheral Blood-Derived TCCs Undergoing AP Are Frequently Found in MS Brain Lesions (A) TCRVβ repertoire of the AP compartment and TCCs generated thereof were compared with the corresponding brain infiltrate of two MS patients. (B and C) Frequency overlap of unique productive TCRVβ sequences in peripheral CFSEhi (red) and CFSEdim (AP, purple) with TCRVβ sequences in the MS brain lesions (B; MS patient 1, experiment B) or the brain infiltrate (C; MS patient 2) represented by pie charts. Box-and-whisker plots indicate the distribution and frequency of all TCRVβ sequences from the respective peripheral cell compartments. Shared TCRVβ sequences in the brain infiltrate that were found also in both (left graph) or uniquely (right graph) in one of the two CFSE compartments are depicted by dots. The number (n) of total unique (gray) and the number as well as frequency overlap of shared TCRVβ sequences of the CFSEhi (red) and CFSEdim (purple) compartment are shown. (D and E) Overlap of TCRVβ sequences upon normalization of the shared and total clone-set sizes that were compared with each other. The calculated value is given as arbitrary unit (AU) and was performed based on the TCRVβ sequences in the clone sets of MS patient 1 and 2 (D), and on the TCRVβ sequences that were matching with either peripheral blood memory (CD45RO+) CD4+ (red) or CD8+ (blue) T cells of MS patient 1 (E). See also Figures S5 and S6 and Tables S4 and S5.
Figure S5
Figure S5
Similar High-Frequency Overlap of Shared TCRVβ Sequences between AP Cells and Brain Lesions in Two Independent Experiments Despite Diverse TCRVβ Repertoire, Related to Figure 5 and Tables S4 and S5 (A) Comparison of unique productive TCRVβ sequences and their frequencies in CFSEhi and CFSEdim cells from the two independent CFSE experiments A and B of peripheral blood in MS patient 1. (B and C) Overlap of productive TCRVβ sequences of the (B) CFSEhi and (C) CFSEdim compartment from peripheral blood with brain infiltrates of three MS lesions in two independent experiments of patient 1. (D and E) Graphs show the frequency of productive TCRVβ sequences in the isolated CFSEdim cell population (AP) of MS patient 1 in the two independent experiments (D) A and (E) B. The graph is plotted with the TCRVβ-chain against the J-chain families. Red bars indicate TCRVβ sequences present in the CFSEdim compartment that match with TCRVβ sequences in brain lesions. The boxes refer to the red bars and depict the frequency of shared TCRVβ sequences in the CFSEdim compartment as well as their frequency and appearance in the different brain lesions. The data from experiment B (MS patient 1) was used for the analyses in Figure 5.
Figure S6
Figure S6
Proliferating CD4+CD45RO+ T Cells Infiltrate Preferentially the High Active Lesion, whereas CD8+CD45RO+ T Cells Are More Globally Expanded, Related to Figures 5 and 6 and Tables S4 and S5 (A) Correlation of the number of shared unique productive TCRVβ sequences in cloneset samples 1 (M) and 2 (N) with the number of unique productive TCRVβ sequences in cloneset sample 1 (M) multiplied by the number of unique productive TCRVβ sequences in cloneset sample 2 (N), in order to normalize the number of shared TCRVβ sequences for the cloneset size (Zvyagin et al., 2014). Correlations were performed for overall TCRVβ sequences and TCRVβ sequences that were identified in the peripheral CD4+CD45RO+ or CD8+CD45RO+ T cell compartment (Spearman’s rank correlation test). (B) Frequencies of shared unique productive TCRVβ sequences in the AP compartment and the brain lesions of MS patient 1 (experiment B). Colors indicate, which TCRVβ sequences were also identified in the peripheral CD4+CD45RO+ (green) or CD8+CD45RO+ (blue) T cell compartment. Circles correspond to brain-matching TCRVβ sequences which are found in both CFSEhi and CFSEdim cells, and triangles correspond to brain-matching TCRVβ sequences only found in CFSEdim cells. The position of the symbols reflects the corresponding frequency of the TCRVβ sequence inside the AP compartment or the brain lesion. (C) Brain-homing CD4+ TCCs from the AP compartment of MS patient 1 were analyzed for the expression of the brain-homing receptors CXCR3 and CCR6. Prior to analysis, gates were set on live cells.
Figure 6
Figure 6
AP TCCs Home to the Brain and Recognize Self-Antigens that Are Expressed in Brain Lesions and B Cells (A) Brain-homing TCCs isolated from the AP compartment of PBMCs with their corresponding TCRVβ sequence, frequency in the brain lesions, and functional phenotype. (B) Screening procedure for peptide ligand identification of the AP brain-homing TCC14 (MS patient 1, HLA-DR15+/+) using a positional scanning library. (I) The restriction of the TCC was tested with BLS cells expressing HLA-DR15 alleles (DR2a or DR2b) or DQw6. Subsequently, TCC14 was tested with all combinatorial peptide mixtures using BLS-DR2b cells. Proliferative responses (mean ± SEM; stimulatory index = SI; dotted line SI = 2) were assessed by thymidine incorporation. Mean responses from three experiments were used to generate a matrix for optimal amino acid combinations of a potential peptide ligand. (II) The potential best cognate antigens were then predicted using a transcriptome database from the brain lesions of MS patient 1. (III) The top 92 predicted peptides were tested for reactivity and are shown with one of their corresponding matrix scores. (C) The stimulatory peptides were tested in decreasing concentrations for the proliferative response of TCC14 (mean ± SEM). Peptides from RASGRP family members are highlighted. (D) Cytokine response of TCC14 upon stimulation with decreasing concentrations of the RASGRP2 peptide. (E) Expression level (RPKM) of stimulatory peptide-originating transcripts (e.g. RASGRP1-4) and control transcripts (MOBP, CD19) in the active brain lesion III of MS patient 1 and AP B cells (n = 6 REM). Expression levels under 0.1 or absent were set as 0.1. (F) Proteome analysis of peripheral blood B cells (n = 4 REM) and brain tissue (gray matter, pooled, n = 6 MS). The protein coverage (columns) and spectral counts (numbers) of RASGRP1-4 are depicted as measure for protein abundance. See also Figure S6 and Table S6.
Figure 7
Figure 7
RASGRP2 Is Expressed in Cortical Neurons and Shows Reactivity for Memory T Cells in MS Patients (A) First column: HE and RASGRP2 immunohistochemical staining in the occipital lobe of a 53-year-old male patient. Scale bar: 1 mm. Second and third column: RASGRP2 reactivity is present in a punctate pattern (yellow asterisk) in the neuropil of the cortex (Cx) and diffusely throughout the cytoplasm of scattered neuronal cells (black arrow), whereas the white matter (WM) remains negative. Lx, leptomeninges. Scale bars: 100 µm and 10 µm. (B and C) Lymphocyte composition (B) and AP (C) before and after CD45RA depletion of PBMCs (mean ± SEM; Mann-Whitney U test). Proliferation was assessed by thymidine incorporation. (D) Proliferative responses of CD45RA-depleted PBMCs (NAT; n = 8) and TCC14 to overlapping 15-mer RASGRP2 peptide pools, covering the sequence of RASGRP2 from N (pool 1) to C terminus (pool 9), to the recombinant RASGRP2 protein, vehicle control (DMSO), and α-CD2/CD3/CD28 stimulation after 7 days. Dots represent replicate wells (NAT: mean ± SEM; TCC14: mean ± SEM of 6 replicate wells). Stimulatory index (SI) = ratio of the response of a given well to the mean response of the vehicle control. A SI >2 is considered as positive response. See also Figure S7 and Table S7.
Figure S7
Figure S7
Th1-Th17 Reactivity to RASGRP2 Is Influenced by AP and Increases Stepwise from HD to REM to NAT, Related to Figures 1, 2, and 7 and Table S7 (A) Fluorospot images in PBMCs with cytokine reactivity (IFN-γ and/or IL-17) to the RASGRP2 peptide pool 1, as compared to the vehicle control. The positive control with anti-CD3 stimulation is included for comparison. (B) Fluorospot-based cytokine reactivity in PBMCs from HD (n = 11), REM (n = 9) or RRMS patients treated with NAT (n = 20). Number of IFN-γ+, IL17+ and IFN-γ+IL17+ spots is shown for the negative control (vehicle) and upon stimulation with RASGRP2 peptide pools, covering the sequence of RASGRP2 from N- (pool 1) to C terminus (pool 9). Each condition was performed for each donor in duplicate wells. The dots represent the response in a given well. Mean ± SEM is shown with red bars while the red dotted line depicts the mean + 3x standard deviation of the vehicle control. The latter is considered as threshold for positive responses. (C) The results from fluorospot were compared to the degree of AP measured by the CFSE assay in the same individuals (incl. HD and REM; n = 16). Number of IFN-γ+, IL17+ and IFN-γ+IL17+ spots is shown for the negative control (vehicle) and upon stimulation with RASGRP2 peptide pools. Orange dots correspond to samples with low AP (< 0.9% CFSEdim), while blue dots correspond to samples with high AP (> 0.9% CFSEdim).

Comment in

References

    1. Balashov K.E., Rottman J.B., Weiner H.L., Hancock W.W. CCR5(+) and CXCR3(+) T cells are increased in multiple sclerosis and their ligands MIP-1alpha and IP-10 are expressed in demyelinating brain lesions. Proc. Natl. Acad. Sci. USA. 1999;96:6873–6878. - PMC - PubMed
    1. Basdeo S.A., Cluxton D., Sulaimani J., Moran B., Canavan M., Orr C., Veale D.J., Fearon U., Fletcher J.M. Ex-Th17 (Nonclassical Th1) cells are functionally distinct from classical Th1 and Th17 cells and are not constrained by regulatory T cells. J. Immunol. 2017;198:2249–2259. - PubMed
    1. Beecham A.H., Patsopoulos N.A., Xifara D.K., Davis M.F., Kemppinen A., Cotsapas C., Shah T.S., Spencer C., Booth D., Goris A., International Multiple Sclerosis Genetics Consortium (IMSGC) Wellcome Trust Case Control Consortium 2 (WTCCC2) International IBD Genetics Consortium (IIBDGC) Analysis of immune-related loci identifies 48 new susceptibility variants for multiple sclerosis. Nat. Genet. 2013;45:1353–1360. - PMC - PubMed
    1. Brinkmann V., Billich A., Baumruker T., Heining P., Schmouder R., Francis G., Aradhye S., Burtin P. Fingolimod (FTY720): discovery and development of an oral drug to treat multiple sclerosis. Nat. Rev. Drug Discov. 2010;9:883–897. - PubMed
    1. Cai G., Hafler D.A. Multispecific responses by T cells expanded by endogenous self-peptide/MHC complexes. Eur. J. Immunol. 2007;37:602–612. - PubMed

Publication types

MeSH terms