. 2018 Sep 12;24(3):392-404.e8.
doi: 10.1016/j.chom.2018.08.002. Epub 2018 Aug 30.

Capsid-CPSF6 Interaction Licenses Nuclear HIV-1 Trafficking to Sites of Viral DNA Integration

Affiliations

Capsid-CPSF6 Interaction Licenses Nuclear HIV-1 Trafficking to Sites of Viral DNA Integration

Vasudevan Achuthan et al. Cell Host Microbe. .

Abstract

HIV-1 integration into the host genome favors actively transcribed genes. Prior work indicated that the nuclear periphery provides the architectural basis for integration site selection, with viral capsid-binding host cofactor CPSF6 and viral integrase-binding cofactor LEDGF/p75 contributing to selection of individual sites. Here, by investigating the early phase of infection, we determine that HIV-1 traffics throughout the nucleus for integration. CPSF6-capsid interactions allow the virus to bypass peripheral heterochromatin and penetrate the nuclear structure for integration. Loss of interaction with CPSF6 dramatically alters virus localization toward the nuclear periphery and integration into transcriptionally repressed lamina-associated heterochromatin, while loss of LEDGF/p75 does not significantly affect intranuclear HIV-1 localization. Thus, CPSF6 serves as a master regulator of HIV-1 intranuclear localization by trafficking viral preintegration complexes away from heterochromatin at the periphery toward gene-dense chromosomal regions within the nuclear interior.

Keywords: CPSF6; HIV capsid; HIV integrase; HIV integration; HIV trafficking; LEDGF/p75; lamina-associated domain; nuclear trafficking.


Conflict of interest statement

DECLARATION OF INTERESTS

The authors declare no competing interests.

Figures
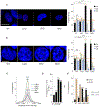
Figure 1.
Figure 1.. CPSF6 dependence of HIV-1 DNA localization.
(A and B) Representative central z-section images of infected cells obtained using Provirus ViewHIV (A) or MICDDRP (B). Nuclei (blue) are stained with DAPI throughout the figures, with vDNA appearing in red. Scale bars, 20 μm (A) and 10 μm (B). Distributions of 240-973 total HIV-1 foci from n=3 independent experiments, each conducted in duplicate (A), and 300-383 total foci from n=2 independent experiments conducted in duplicate (B), were binned into nuclear zones. Results are mean ± standard error of mean (SEM). ***, P < 0.0001; *, P < 0.05; NS, P > 0.05; orange indicators are in comparison to random (dashed line). (C) Histogram analysis of HIV-1 integration with respect to LADs; MRC is shown as gray shade. (D and E) Proportion of integration sites within 2.5 kb of LADs (D) and at cLADs vs. ciLADs (E). P values (as in A) compare results to WT (black asterisks) or MRC (gray asterisks).
Figure 2.
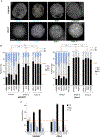
Figure 2.. CA-CSPF6 interaction underlies nuclear dispersion and LAD evasion during HIV-1 integration.
(A) Representative images of infected cells developed by Provirus ViewHIV; scale bar, 20 μm. Results are mean ± SEM for n=2 experiments, each conducted in duplicate, encompassing between 172 and 415 total foci across the indicated conditions. (B) Representative SCIP assay images and nuclear dispersion values (mean ± SEM for n=2 experiments, each conducted in duplicate); bar, 10 μm. Number of counted foci ranged from 36 to 168. Other panel A and B labelings is the same as in Figure 1A. (C and D) Proportion of integration sites nearby LADs (C) and at cLADs vs. ciLADs (D). See Figure 1D, E for additional details.
Figure 3.
Figure 3.. CPSF6-dependent pan-nuclear HIV-1 localization in primary T cells.
(A) Representative Provirus ViewHIV images of infected CD4+ T cells from two blood donors at 24 hpi. Results (mean ± SEM from n=2 independent experiments, each conducted in duplicate) compile 72-233 total HIV-1 foci across the indicated conditions. Other labeling is as in Figure 1A. (B and C) HIV-1 integration sites observed within 2.5 kb of LADs (B) and at cLADs vs. ciLADs (C). Dashed lines, MRC values. See Figure 1D, E for further information.
Figure 4.
Figure 4.. RIG selection as a function of integration targeting pathway.
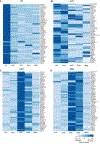
(A-D) Heatmaps compare integration frequency of the top 50 targeted genes in the indicated cell type across all cell types and the MRC. Maps are colored based on Z-score values; darker shades of blue denote values enriched compared to the MRC and lighter shades of blue are depleted compared to the MRC. See Tables S3 for integration frequencies and P values.
Figure 5.
Figure 5.. Characterization of pathway-specific RIGs.
(A) Bee-swarm plots show lengths of top 50 genes targeted by HIV-1 in the noted cell type or the MRC. (B) Box-and-whiskers plots show average gene expression values for the RIGs noted in panel A. Whiskers include 10-90 percentiles. (C) Proportion of top 50 genes showing LAD association. The computational pipeline (in the absence of infection) enriches for long genes (panel A), accounting for the high proportion of LAD association among MRC RIGs. Combined proportions of LAD and non-LAD RIGs were statistically compared to combined WT or MRC values. (D) Expression values of chromatin outside versus inside LAD regions in indicated HEK293T cell type. TPM, transcripts per million reads. ***, P < 0.001; **, P < 0.01; *, P < 0.05; NS, P > 0.05 (black, compared to WT or indicated sample; gray, compared to MRC).
Figure 6.
Figure 6.. Inherent gene localization in uninfected cells.
(A) Radial locations of visualized RIGs in uninfected HEK293T and CD4+ T cells from donor A. Representative images of nuclei stained by DAPI (gray pseudocolor) along with indicated gene-specific foci. Scale bars, 3 μm. (B) Stacked column graphs show distributions of 101-238 total gene foci binned into three nuclear zones. Orange lines indicate random PN and MN distributions. (C) Zonal analyses of Group 1-3 genes as compiled gene sets. ***, P < 0.0001; *, P < 0.01; NS, P > 0.05 (orange, gene set compared to random; black, cross gene set comparisons).
Figure 7.
Figure 7.. Intranuclear PIC distribution and HIV-1 integration site selection.
(A, B) Peripheral, mid, and central topological nuclear sections are illustrated in WT cells (A) versus cells depleted for CPSF6 (B). A representative chromatin fiber is shown in blue, with nuclear lamina in gray. Background blue gradient represents relative concentration of gene dense chromatin towards the nuclear interior. PICs contain orange spheres connected by a black DNA loop. CPSF6 and LEDGF/p75 are shown as black triangles and green circles, respectively.

References

    1. Achuthan V, Keith BJ, Connolly BA, and DeStefano JJ (2014). Human immunodeficiency virus reverse transcriptase displays dramatically higher fidelity under physiological magnesium conditions in vitro. J. Virol 88, 8514–8527. - PMC - PubMed
    1. Albanese A, Arosio D, Terreni M, and Cereseto A (2008). HIV-1 pre-integration complexes selectively target decondensed chromatin in the nuclear periphery. PLoS One 3, e2413. - PMC - PubMed
    1. Boyle S, Gilchrist S, Bridger JM, Mahy NL, Ellis JA, and Bickmore WA (2001). The spatial organization of human chromosomes within the nuclei of normal and emerin-mutant cells. Hum. Mol. Genet 10, 211–219. - PubMed
    1. Brussel A, and Sonigo P (2003). Analysis of early human immunodeficiency virus type 1 DNA synthesis by use of a new sensitive assay for quantifying integrated provirus. J. Virol 77, 10119–10124. - PMC - PubMed
    1. Burdick RC, Delviks-Frankenberry KA, Chen J, Janaka SK, Sastri J, Hu WS, and Pathak VK (2017). Dynamics and regulation of nuclear import and nuclear movements of HIV-1 complexes. PLoS Pathog. 13, e1006570. - PMC - PubMed

Publication types

MeSH terms

Substances