. 2018 Nov 6;26(11):1451-1461.e4.
doi: 10.1016/j.str.2018.07.015. Epub 2018 Aug 30.

The N-Terminal GTPase Domain of p190RhoGAP Proteins Is a PseudoGTPase

Affiliations

The N-Terminal GTPase Domain of p190RhoGAP Proteins Is a PseudoGTPase

Amy L Stiegler et al. Structure. .

Abstract

The pseudoGTPases are a rapidly growing and important group of pseudoenzymes. p190RhoGAP proteins are critical regulators of Rho signaling and contain two previously identified pseudoGTPase domains. Here we report that p190RhoGAP proteins contain a third pseudoGTPase domain, termed N-GTPase. We find that GTP constitutively purifies with the N-GTPase domain, and a 2.8-Å crystal structure of p190RhoGAP-A co-purified with GTP reveals an unusual GTP-Mg2+ binding pocket. Six inserts in N-GTPase indicate perturbed catalytic activity and inability to bind to canonical GTPase activating proteins, guanine nucleotide exchange factors, and effector proteins. Biochemical analysis shows that N-GTPase does not detectably hydrolyze GTP, and exchanges nucleotide only under harsh Mg2+ chelation. Furthermore, mutational analysis shows that GTP and Mg2+ binding stabilizes the domain. Therefore, our results support that N-GTPase is a nucleotide binding, non-hydrolyzing, pseudoGTPase domain that may act as a protein-protein interaction domain. Thus, unique among known proteins, p190RhoGAPs contain three pseudoGTPase domains.

Keywords: ARHGAP35; ARHGAP5; PseudoGTPase; Rho signaling; crystal structure; pseudoenzyme.


Figures

Figure 1.
Figure 1.. Crystal structure of p190RhoGAP-A N-GTPase domain.
a) Domain assignment for p190RhoGAP protein. b) Ribbon diagram of the structure of p190RhoGAP N-GTPase domain (copy A). Secondary structure elements, GTP and Mg2+ are labeled, and the inserts unique to p190RhoGAP are colored in dark green. c) Ribbon diagram of the structural superposition of N-GTPase (green) with H-Ras (salmon) bound to nonhydrolyzable GTP analogue, GMP-PNP (PDB ID: 5P21) (Pai et al., 1990). Superposition performed by Dali (Holm and Rosenstrom, 2010).
Figure 2.
Figure 2.. Sequence features and conservation.
Structure-based sequence alignment of N-GTPase with H-Ras, with secondary structure elements drawn and labeled above the sequences. The location of the consensus GTPase G-motifs (underlined) and N-GTPase inserts (dark green) are indicated. The conservation p190RhoGAP-A (ARHGAP35) protein sequence from 77 species is shown; (*) identical, (:) strongly similar, (.) weakly similar, as determined by ClustalO (Sievers et al., 2011). Aligned sequences of p190RhoGAP-B (ARHGAP5) (72% identical) and the single p190RhoGAP gene from fly (54% identical) are also shown.
Figure 3.
Figure 3.. The p190 N-GTPase domain contains unique inserts that extend the GTPase domain.
a) Overall structure of N-GTPase with inserts colored and labeled. b) Core GTPase domain structure is shown in surface representation, with insert ribbons colored as in part a. Regions of the core GTPase domain that are buried by the inserts are colored dark grey. Two views related by a 90 degree rotation about the y-axis are shown. c-f) Specific interactions of the insert residues with each other and with the GTPase core. Inserts are colored as in part a.
Figure. 4.
Figure. 4.. The N-GTPase catalytic cleft binds both GTP and Mg2+ but is enzymatically inactive.
a) Unbiased difference electron density map (FobsFcalc) calculated before GTP and Mg2+ model building, with final refined GTP and Mg2+ positions shown. Map is contoured at +3 σ (green) and −3 σ (red). b) Final refined 2FobsFcalc map contoured at 1 σ (blue) and 3 σ (cyan), and final FoFc electron density map contoured at +3 σ (green) and −3 σ (red). c) Surface electrostatic potential of N-GTPase at the GTP/Mg2+ binding site. d) Strong anion exchange chromatography shows that N-GTPase is bound predominantly to GTP. Protein samples were denatured and precipitated, and the remaining nucleotide in solution was loaded onto a strong anion exchange column. Chromatography traces at absorbance of 254 nm is shown for purified N-GTPase (green), Rnd3 (cyan), and Rac1 wild-type (purple). The elution profiles of GDP (burgundy) and GTP (blue) were calibrated using nucleotides alone (commercially purchased). The absorbance values are normalized and offset. e) N-GTPase lacks hydrolysis activity in vitro. Strong Anion exchange chromatography was used to measure the relative level of GTP remaining after incubation of 0.5 mM protein at room temperature for 24 hr in the presence of 5 mM Mg2+. Rac1 was preloaded with GTP. A scatter dot plot shows each data point, with the bar graph indicating the mean of each column. P-values are indicated as determined in Prism (pairwise t-test). f and g) MANT-GTP exchange assays. The fluorescence of MANT-GTP is measured upon addition of H-Ras G12V (f) or p190RhoGAP N-GTPase (g) and followed over time. Curves are corrected for fluorescence of MANT-GTP alone (in absence of protein). “Basal” condition (red) indicates exchange curves without additives. Other curves are colored according to legend.
Figure 5.
Figure 5.. Analysis of GTP binding site in N-GTPase.
a) Ribbon diagram of N-GTPase structure (green) with consensus GTPase G motifs differently colored and labeled. P-loop: magenta, Switch I: pink Switch II: yellow, G4: teal, G5: purple. b) Ribbon diagram of H-Ras G12V (Grey) bound to GMP-PNP (PDB ID: 5P21). G motifs are colored as in part a. c) Zoom-in showing the superposition of H-Ras with N-GTPase and the catalytic Q61 of H-Ras (grey) sterically clashing with N-GTPase residues S22, T24, and E98. d) Map of N-GTPase interaction with GTP and Mg2+ adapted from Ligplot (Wallace et al., 1995). e) Detailed view of GTP gamma phosphate and Mg2+ binding site in N-GTPase (left) and H-Ras (right). Region shown is indicated by a dashed box in parts a and b. f) Solubility and total expression of N-GTPase wild-type (WT) and mutant proteins. Clarified (top) or total (bottom) lysates are resolved by SDS-PAGE and proteins visualized by Coomassie Blue staining. g) Final purified N-GTPase wild-type and mutant proteins, resolved by SDS-PAGE and stained with Coomassie Blue. h) Thermal denaturation curves from a representative experiment of N-GTPase proteins. Fluorescence signal has been normalized in each sample. i) Scatter dot plot of melting temperatures calculated as the mean of four measurements for each sample (error bars indicate standard deviation) determined by fitting the melting curve to a sigmoidal model. P-values from One-way ANOVA comparisons of the melting temperatures to wild-type is indicated above each bar (****: p <0.0001. n.s.: no significant difference).
Figure 6.
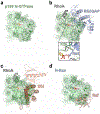
Figure 6.. Binding of typical GAP, GEF, and effector molecules is sterically blocked in N-GTPase
a) Ribbon and surface representation of N-GTPase structure (green). Orientation and coloring of N-GTPase is consistent in all panels. b) N-GTPase superposed onto RhoA (grey) bound to GAP domain of p190RhoGAP (light purple) (PDB ID: 5IRC (Amin et al., 2016)). Inset: zoom-in of Lys-28 in N-GTPase (green) clashing with Arg-finger from GAP domain (light purple). c) N-GTPase superposed onto RhoA (grey) bound to GEF (Dbl domain from Dbs, light purple, PDB ID: 1LB1 (Snyder et al., 2002)). d) N-GTPase superposed onto H-Ras (light blue) bound to its effector Raf (pink, PDB ID:4G0N (Fetics et al., 2015)).

References

    1. Adams PD, Afonine PV, Bunkoczi G, Chen VB, Davis IW, Echols N, Headd JJ, Hung LW, Kapral GJ, Grosse-Kunstleve RW, et al. (2010). PHENIX: a comprehensive Python-based system for macromolecular structure solution. Acta crystallographica Section D, Biological crystallography 66, 213–221. - PMC - PubMed
    1. Afonine PV, Grosse-Kunstleve RW, Echols N, Headd JJ, Moriarty NW, Mustyakimov M, Terwilliger TC, Urzhumtsev A, Zwart PH, and Adams PD (2012). Towards automated crystallographic structure refinement with phenix.refine. Acta crystallogr D 68, 352–367. - PMC - PubMed
    1. Ahmadian MR, Stege P, Scheffzek K, and Wittinghofer A (1997). Confirmation of the arginine-finger hypothesis for the GAP-stimulated GTP-hydrolysis reaction of Ras. Nat Struct Biol 4, 686–689. - PubMed
    1. Amin E, Jaiswal M, Derewenda U, Reis K, Nouri K, Koessmeier KT, Aspenstrom P, Somlyo AV, Dvorsky R, and Ahmadian MR (2016). Deciphering the Molecular and Functional Basis of RHOGAP Family Proteins: A SYSTEMATIC APPROACH TOWARD SELECTIVE INACTIVATION OF RHO FAMILY PROTEINS. J Biol Chem 291, 20353–20371. - PMC - PubMed
    1. Arthur WT, and Burridge K (2001). RhoA inactivation by p190RhoGAP regulates cell spreading and migration by promoting membrane protrusion and polarity. Mol Biol Cell 12, 2711–2720. - PMC - PubMed

Publication types

LinkOut - more resources