. 2018 Nov:17:71-81.
doi: 10.1016/j.molmet.2018.08.004. Epub 2018 Aug 18.

Distinct lipid droplet characteristics and distribution unmask the apparent contradiction of the athlete's paradox

Affiliations

Distinct lipid droplet characteristics and distribution unmask the apparent contradiction of the athlete's paradox

Sabine Daemen et al. Mol Metab. 2018 Nov.

Abstract

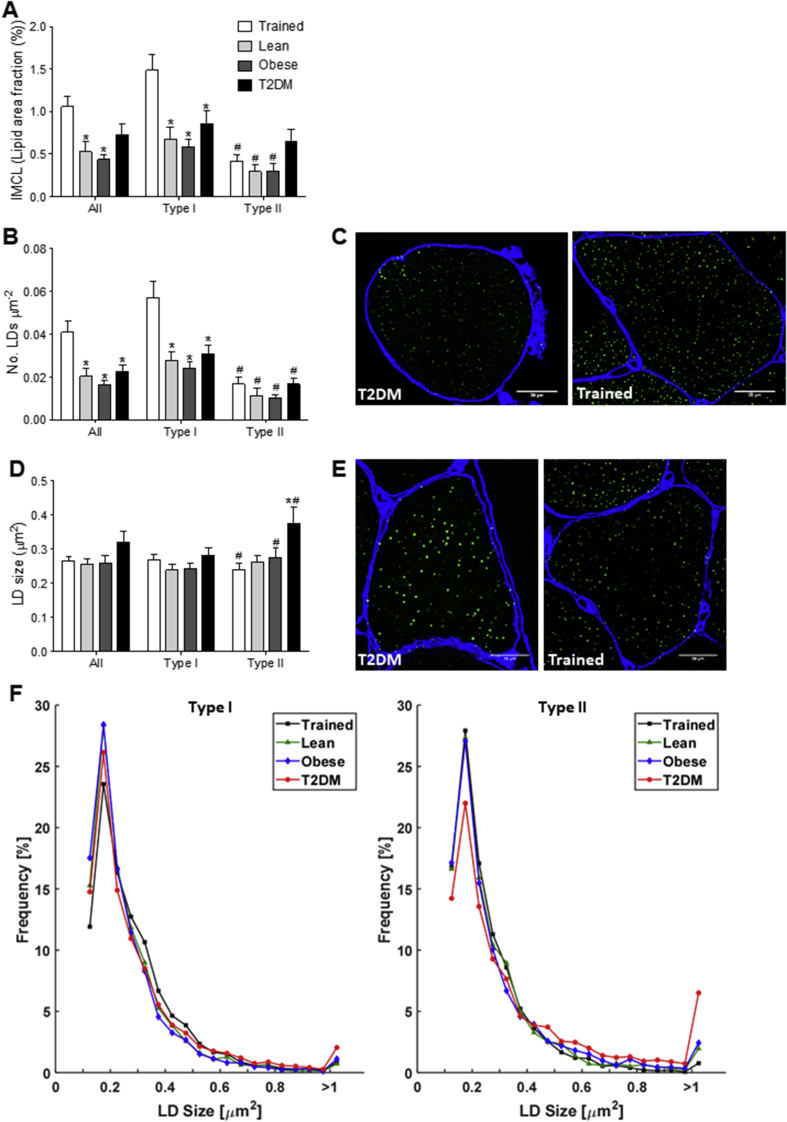
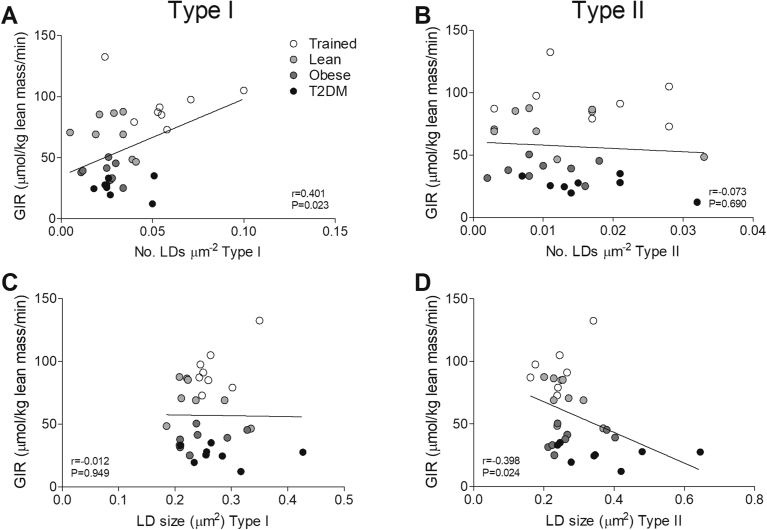
Objective: Intramyocellular lipid (IMCL) storage negatively associates with insulin resistance, albeit not in endurance-trained athletes. We investigated the putative contribution of lipid droplet (LD) morphology and subcellular localization to the so-called athlete's paradox.

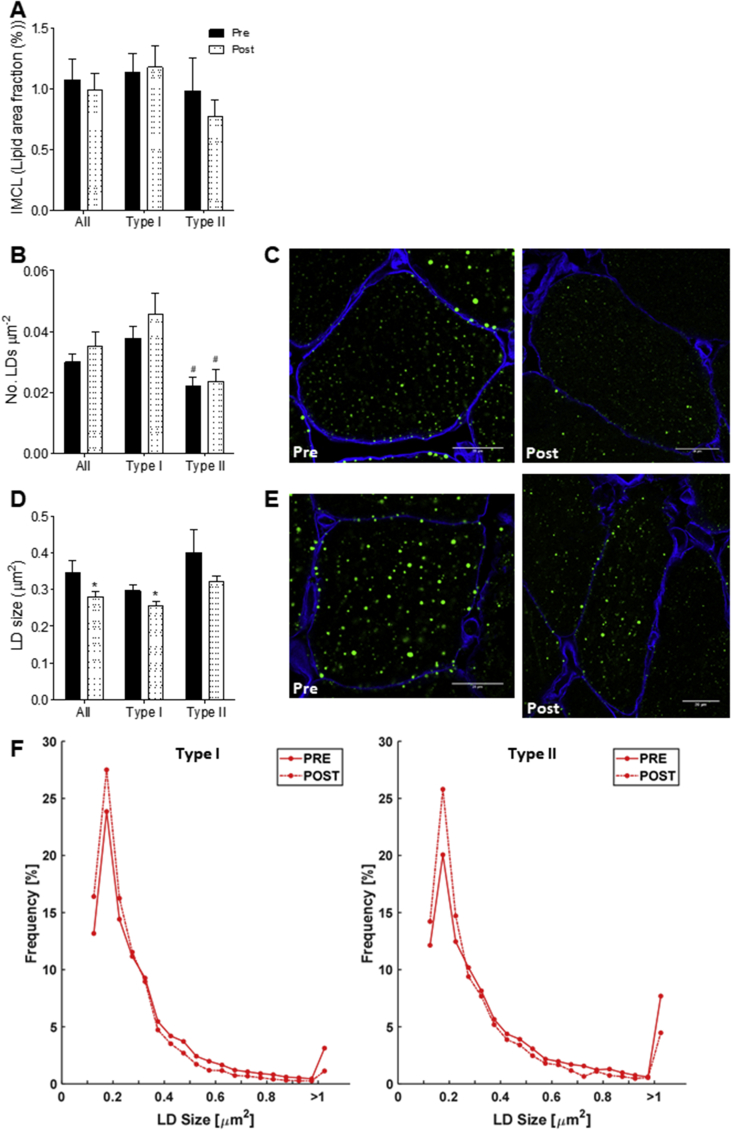
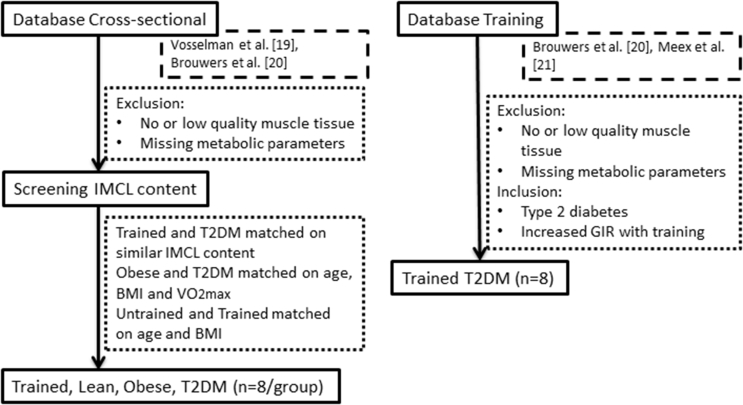
Methods: We performed quantitative immunofluorescent confocal imaging of muscle biopsy sections from endurance Trained, Lean sedentary, Obese, and Type 2 diabetes (T2DM) participants (n = 8/group). T2DM patients and Trained individuals were matched for IMCL content. Furthermore we performed this analysis in biopsies of T2DM patients before and after a 12-week exercise program (n = 8).

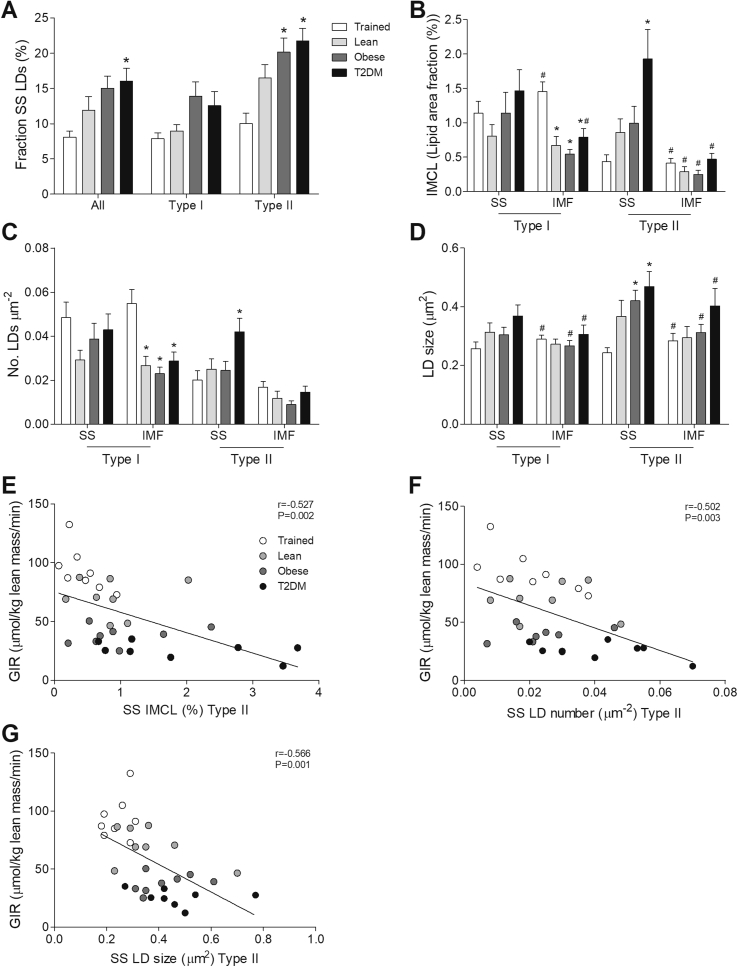
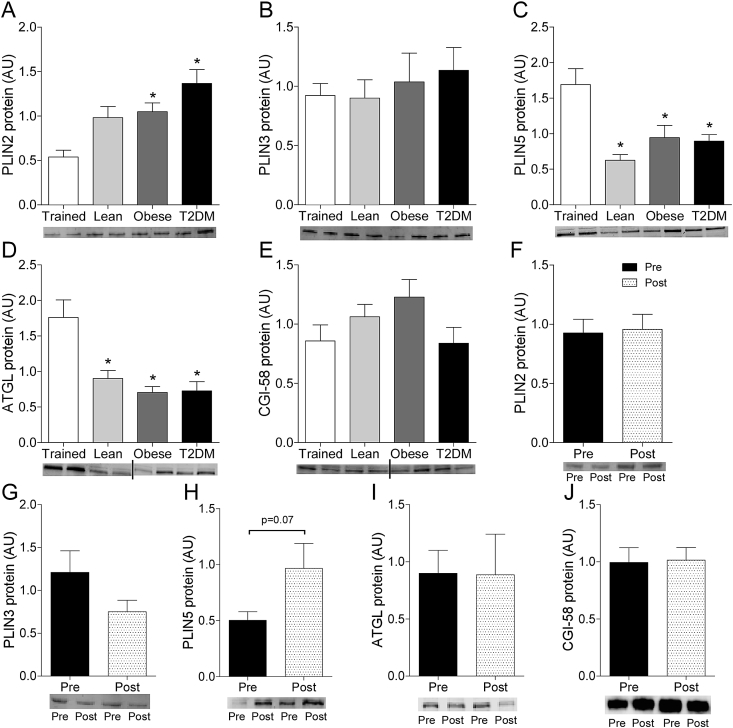
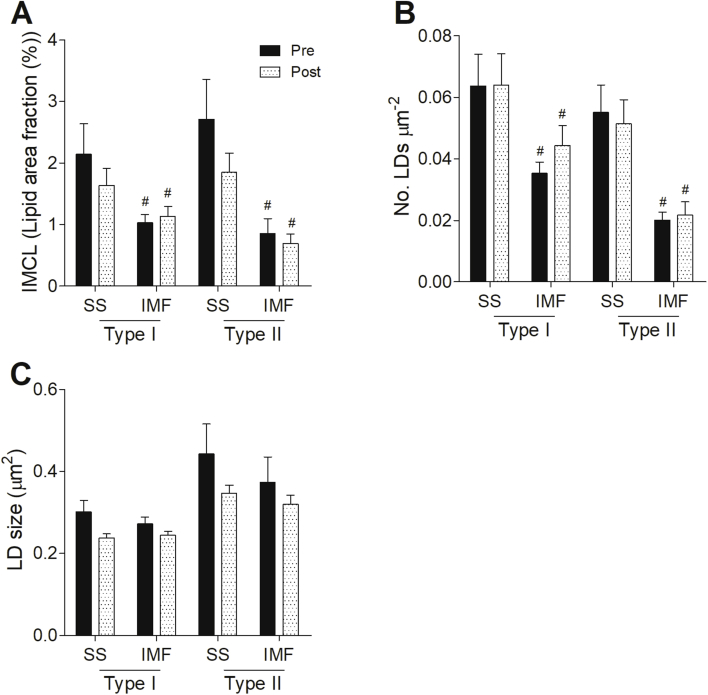
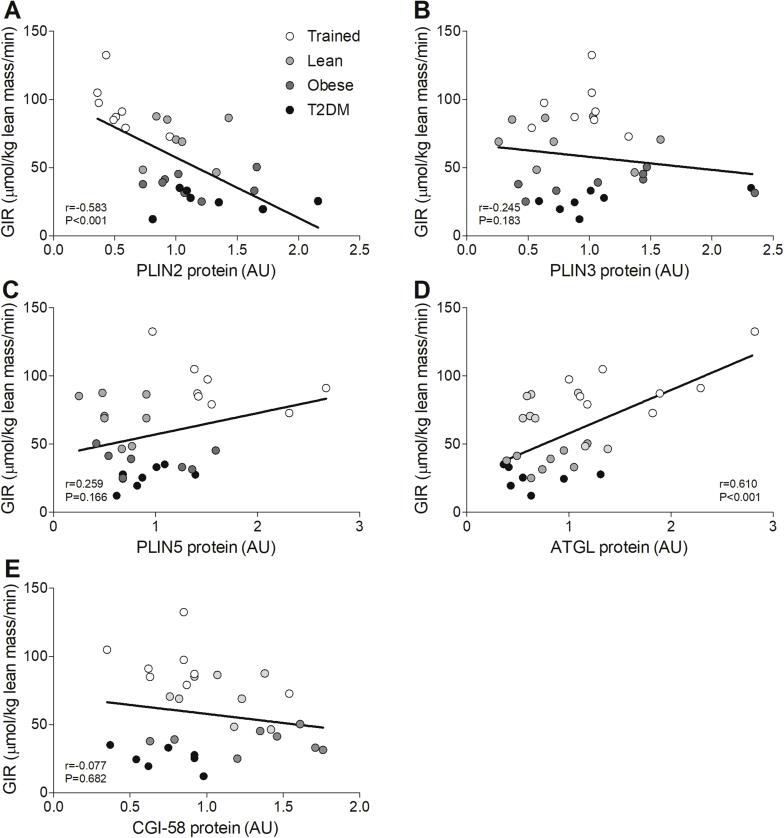
Results: We found marked differences in lipid storage morphology between trained subjects and T2DM: the latter group mainly store lipid in larger LDs in the subsarcolemmal (SS) region of type II fibers, whereas Trained store lipid in a higher number of LDs in the intramyofibrillar (IMF) region of type I fibers. In addition, a twelve-week combined endurance and strength exercise program resulted in a LD phenotype shift in T2DM patients partly towards an 'athlete-like' phenotype, accompanied by improved insulin sensitivity. Proteins involved in LD turnover were also more abundant in Trained than in T2DM and partly changed in an 'athlete-like' fashion in T2DM patients upon exercise training.

Conclusions: Our findings provide a physiological explanation for the athlete's paradox and reveal LD morphology and distribution as a major determinant of skeletal muscle insulin sensitivity.

Keywords: Athlete's paradox; Insulin sensitivity; Intramyocellular lipid; Lipid droplets.


Figures

Figure 1
Figure 1
IMCL content and lipid droplet morphology differ between groups of the cross-sectional study. Quantification of IMCL content (lipid area fraction) (A), LD number per fiber area (B), and LD size (D) of all fiber types, type I fibers and type II fibers of Trained (black), Lean (dark grey), Obese (light grey), and T2DM (black) determined with confocal microscopy. Representative confocal images of type I fibers (C) and type II fibers (E) of Trained (right) and T2DM (left) in cross-sectional view with cellular membrane (blue) and LDs (green). Frequency distribution of LD size in type I and type II fibers of Trained (black square), Lean (green triangle), Obese (blue diamond), and T2DM (red circle) (F). *p < 0.05 vs. Trained; #p < 0.05 vs. type I fibers.
Figure 2
Figure 2
LD size in type II and LD number in type I fibers correlates with insulin sensitivity. Correlations of GIR with LD number of type I fibers (A) and type II fibers (B) and with LD size of type I fibers (C) and type II fibers (D).
Figure 3
Figure 3
T2DM patients have increased lipid storage in the SS region. Fraction of LDs located in the SS region of all fiber types, type I fibers and type II fibers of Trained, Lean, Obese, and T2DM (A). Quantification of IMCL content (lipid area fraction) (B), LD number per fiber area (C) and LD size (D) in the SS and IMF region of type I fibers and type II fibers of Trained, Lean, Obese and T2DM. Correlations of GIR with SS IMCL content (lipid area fraction) (E), SS LD number (F) and SS LD size (G) in type II fibers. *p < 0.05 vs. Trained; #p < 0.05 vs. SS.
Figure 4
Figure 4
Training reduced LD size in T2DM patients. Quantification of IMCL content (lipid area fraction) (A), LD number per fiber area (B) and LD size (D) in all fiber types, type I fibers and type II fibers pre (black) and post (white speckled) training. Representative confocal images of type I fibers (C) and type II fibers (E) pre (left) and post (right) training in cross-sectional view with cellular membrane (blue) and LDs (green). Frequency distribution of LD size in type I and type II fibers pre (solid line) and post (dashed line) training of T2DM patients (F). *P < 0.05 vs. pre training, #p < 0.05 vs. type I fibers.
Figure 5
Figure 5
PLIN2, PLIN5 and ATGL protein levels differ between Trained and T2DM. Protein levels of PLIN2, PLIN3, PLIN5, ATGL, and CGI-58 of Trained, Lean, Obese, and T2DM (A–E) and pre and post training (F–J) determined via western blotting with representative blot images. Dividing lines in blot images indicate grouping of images of different parts of blots. *p < 0.05 vs. Trained.
Supplementary Figure 1
Overview of participant selection.
Supplementary Figure 2
No changes in SS and IMF lipid droplet distribution upon training in T2DM. Quantification of IMCL content (lipid area fraction) (A), LD number per fiber area (B) and LD size (C) in the SS and IMF region in type I fibers and type II fibers pre and post training. #p < 0.05 vs. SS.2
Supplementary Figure 3
PLIN2 (negative) and ATGL (positive) correlate with insulin sensitivity. Correlations of GIR with PLIN2 (A), PLIN3 (B), PLIN5 (C), ATGL (D), and CGI-58 (E) protein content.3

References

    1. Pan D.A., Lillioja S., Kriketos A.D., Milner M.R., Baur L.A., Bogardus C. Skeletal muscle triglyceride levels are inversely related to insulin action. Diabetes. 1997;46(6):983–988. - PubMed
    1. Krssak M., Falk Petersen K., Dresner A., DiPietro L., Vogel S.M., Rothman D.L. Intramyocellular lipid concentrations are correlated with insulin sensitivity in humans: a 1H NMR spectroscopy study. Diabetologia. 1999;42(1):113–116. - PubMed
    1. Goodpaster B.H., Theriault R., Watkins S.C., Kelley D.E. Intramuscular lipid content is increased in obesity and decreased by weight loss. Metabolism. 2000;49(4):467–472. - PubMed
    1. Goodpaster B.H., He J., Watkins S., Kelley D.E. Skeletal muscle lipid content and insulin resistance: evidence for a paradox in endurance-trained athletes. Journal of Clinical Endocrinology and Metabolism. 2001;86(12):5755–5761. - PubMed
    1. Walther T.C., Farese R.V., Jr. Lipid droplets and cellular lipid metabolism. Annual Review of Biochemistry. 2012;81:687–714. - PMC - PubMed

Publication types

MeSH terms

Substances