. 2018 Nov:17:1-16.
doi: 10.1016/j.molmet.2018.08.005. Epub 2018 Aug 20.

Sex dependent impact of gestational stress on predisposition to eating disorders and metabolic disease

Affiliations

Sex dependent impact of gestational stress on predisposition to eating disorders and metabolic disease

Mariana Schroeder et al. Mol Metab. 2018 Nov.

Abstract

Objective: Vulnerability to eating disorders (EDs) is broadly assumed to be associated with early life stress. However, a careful examination of the literature shows that susceptibility to EDs may depend on the type, severity and timing of the stressor and the sex of the individual. We aimed at exploring the link between chronic prenatal stress and predisposition to EDs and metabolic disease.

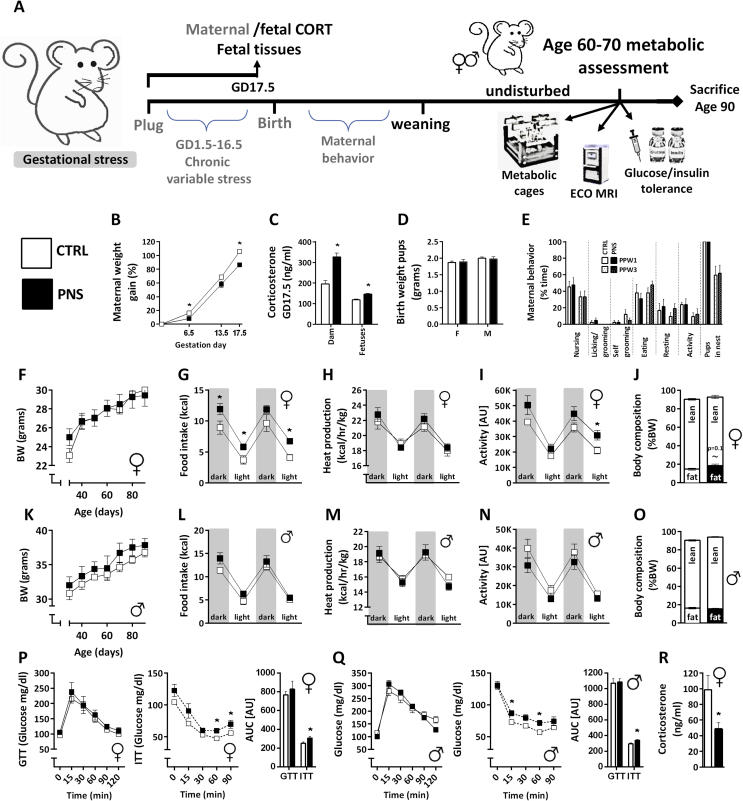
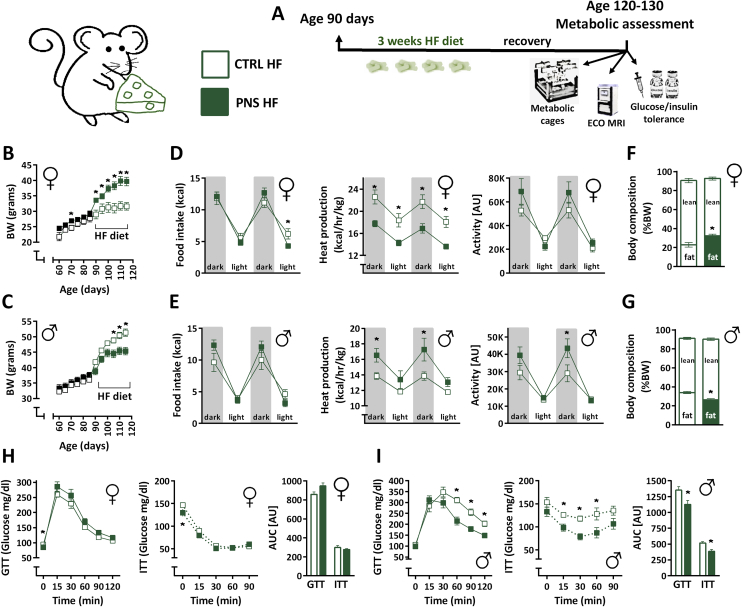
Methods: We used a chronic variable stress protocol during gestation to explore the metabolic response of male and female offspring to food restriction (FR), activity-based anorexia (ABA), binge eating (BE) and exposure to high fat (HF) diet.

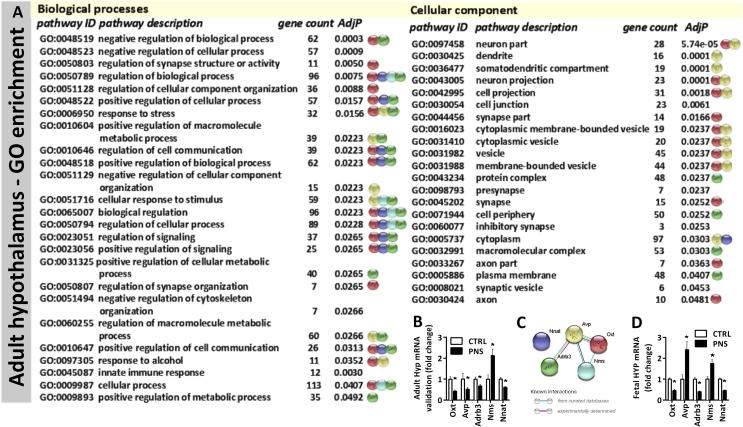
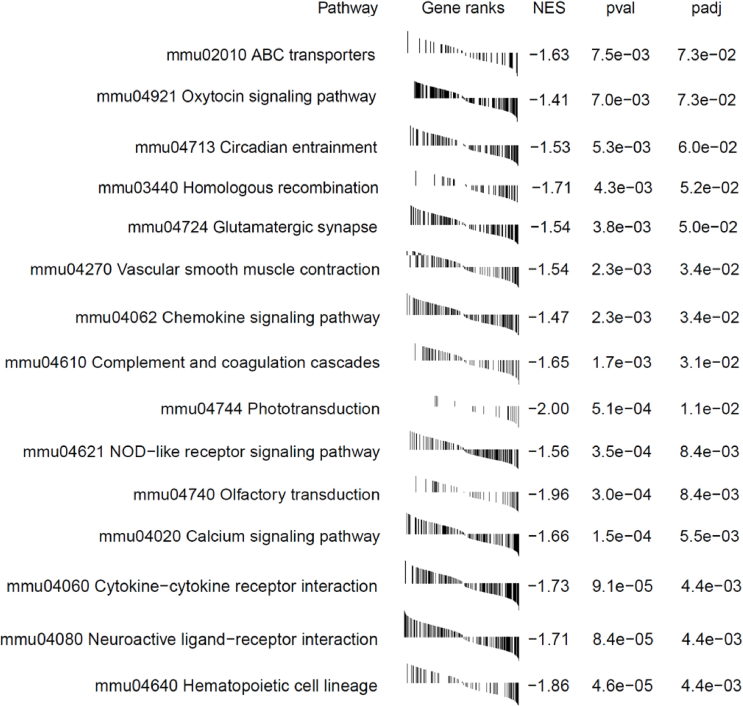
Results: Contrary to controls, prenatally stressed (PNS) female offspring showed resistance to ABA and BE and displayed a lower metabolic rate leading to hyperadiposity and obesity on HF diet. Male PNS offspring showed healthy responses to FR and ABA, increased propensity to binge and improved coping with HF compared to controls. We found that long-lasting abnormal responses to metabolic challenge are linked to fetal programming and adult hypothalamic dysregulation in PNS females, resulting from sexually dimorphic adaptations in placental methylation and gene expression.

Conclusions: Our results show that maternal stress may have variable and even opposing effects on ED risk, depending on the ED and the sex of the offspring.

Keywords: Activity based anorexia; Binge eating; Early life programming; Metabolic syndrome; Obesity; Stress.


Figures

Figure 1
Figure 1
Prenatal stress (PNS) causes basal metabolic abnormalities specifically in female offspring. (A) Experimental design. (B) PNS dams weighed less than controls (CTRLs) during gestation (F(1,18) = 7.01, p = 0.016). (C) Corticosterone levels were higher in PNS dams (t(18) = 5.15, p < 0.0001) and fetuses (t(18) = 5.79, p < 0.0001) on GD.17.5 compared to CTRLs. (D) Pups of both groups had similar body weight (BW) at birth. (E) Maternal behavior in the first and third postpartum weeks (PPW) was similar between the groups. (FJ) PNS female offspring displayed similar BW (F) and heat production (H) but tended to high adiposity (J) and displayed higher food consumption ((F(1,14) = 6.19, p = 0.026) (G)) and activity levels ((F(1,14) = 7.68, p = 0.015) (I) than CTRLs. (KO) Male PNS offspring displayed a normal metabolic profile. (PQ) Glucose tolerance was normal but insulin tolerance was affected by PNS in both sexes (F(1,15) = 5.60, p = 0.033 for females (P) and F(1,15) = 7.39, p = 0.017 for males (Q). Glucose tolerance test (GTT) is displayed on the left y-axis and insulin tolerance test (ITT) on the right y-axis. (R) Plasma corticosterone levels were lower in PNS than in CTRL females (t(10) = 2.55, p = 0.029). Data presented as mean and S.E.M. N = 6–10.
Figure 2
Figure 2
The metabolic response to food restriction differs between control (CTRL) and prenatally stress (PNS) animals. (A) Experimental design. (B) The pattern of weight loss was different in PNS females and CTRLs, with PNS animals maintaining their body weight (BW) throughout the protocol (Fint(3,8) = 6.20, p = 0.018). (C) The pattern of food intake during food restriction differed between PNS and CTRLs females (Fint(4,7) = 5.59, p = 0.024). (D) Food intake and activity levels post-recovery were similar between the groups. Heat production was lower in PNS (F(1,10) = 5. 90, p = 0.036). (E) In males, BW change did not differ between the groups. (F) PNS males consumed less calories than CTRLs when FR (F(1,10) = 14.19, p = 0.004). (G) Food intake and activity levels post-recovery were similar between the groups. Heat production was lower in PNS FR mice (F(1,10) = 10. 21, p = 0.01). (HI) Body fat was higher in PNS females (F(1,11) = 4. 92, p = 0.05), but not in males compared to CTRLs. (JK) Food restriction (FR) did not affect glucose or insulin sensitivity in the PNS group. Glucose tolerance test (GTT) is displayed on the left y-axis and insulin tolerance test (ITT) on the right y-axis. Data presented as mean and S.E.M. N = 6.
Figure 3
Figure 3
Metabolic and circadian abnormalities resulting from activity-based anorexia (ABA) are specific to females and are abolished by prenatal stress (PNS). (A) ABA timeline. (B) Body weight (BW) change and food intake on the last day of the ABA protocol were different only in control (CTRL) ABA females. ABA CTRL females run more in total and in the light phase. (C) ABA females (post-recovery) consumed more kcal during the light phase (F(2,27) = 2.62, p = 0.047), displayed higher heat production (F(2,27) = 3.90, p = 0.033) and hyperactivity in the light phase compared to resistant CTRL and PNS females. (D) Besides one CTRL male, all others were resistant to the ABA protocol, with similar BW and food intake and running distance and pattern. (E) All males showed similar food consumption post-recovery, but PNS showed lower heat production (F(2,20) = 5.73, p = 0.011) and higher activity in the dark phase compared to CTRLs (F(2,20) = 3.73, p = 0.042). (FG) The ABA protocol increased post-recovery body adiposity in females (F(2,27) = 4.20, p = 0.026, G), but not in males (G). (HI) The ABA protocol had no effects on glucose or insulin tolerance in any of the groups. Glucose tolerance test (GTT) is displayed on the left y-axis and insulin tolerance test (ITT) on the right y-axis. Data presented as mean and S.E.M. Differences between the groups are based on Tukey HSD multiple comparison tests. *p < 0.05 for comparisons between CTRL resistant and CTRL ABA groups. #p < 0.05 or comparisons between CTRL resistant and PNS groups. N = 8–12.
Figure 4
Figure 4
The Intermittent access binge eating (BE) protocol induced BE in control (CTRL) females and overeating in prenatal stress (PNS) males and exposed metabolic abnormalities. (A) BE protocol timeline. (B) Body weight (BW) during the BE protocol was similar between the groups in females. (C) During the habituation to Western diet (WD), PNS females (F(1,16) = 13.21, p = 0.002 consumed less kcal than CTRLs. (D) Contrary to CTRL females, PNS females did not develop BE (F(1,15) = 4.68, p = 0.047). (E) PNS females consumed less food during the dark phase (Fint(3,13) = 4.76, p = 0.019), displayed lower heat production (Fint(3,13) = 3.67, p = 0.041) and similar activity compared to CTRL females. (F) BW was lower in PNS males compared to CTRLs (Fint(4,7) = 17.26, p = 0.001). (G) During the habituation to WD, PNS males (F(1,11) = 28.52, p = 0.000) consumed less kcal than CTRLs. (H) The BE protocol induced a different response in PNS males; they consumed less at first and more WD in the last week of the protocol (Fint(3,8) = 4.23, p = 0.046). (I) PNS males consumed similar food and showed comparable activity levels post-recovery, but displayed higher heat production (F(1,10) = 11.86, p = 0.006) than CTRL males. (JK) PNS and BE did not affect body adiposity in males but tended to increase body fat mass in females. (L) Glucose tolerance was normal but the response to insulin differed in PNS females (Fint(4,12) = 7. 01, p = 0.004). (M) In males, glucose tolerance was normal and insulin tolerance tended to be improved by PNS (F(1,10) = 3. 31, p = 0.099). Glucose tolerance test (GTT) is displayed on the left y-axis and insulin tolerance test (ITT) on the right y-axis. Data presented as mean and S.E.M. N = 6–9.
Figure 5
Figure 5
Prenatal stress (PNS) induced opposite metabolic effects in males and females when exposed to high fat (HF) diet. (A) Experimental outline. (BC) Body weight (BW) in the PNS groups exposed to HF was differently affected according to sex (Fint:timexgroupxsex(11,18) = 2.80, p = 0.025). PNS female offspring gained more weight than controls (CTRLs) when exposed to HF diet (F(1,14) = 12.59, p = 0.003). (C) PNS male offspring gained less weight than CTRLs when exposed to HF diet (Fint(11,4) = 110.57, p = 0.000). (D) Post recovery PNS females showed similar food consumption, a different profile of activity (Fint(3,12) = 4.35, p = 0.027) and lower heat production than CTRLs (F(1,14) = 18.10, p = 0.001). (E) PNS males displayed similar food consumption, but higher heat production (Fint(3,12) = 3.87, p = 0.043) and a tendency to dark phase hyperactivity (Fint(3,12) = 2.74, p = 0.055) compared to CTRLs. (FG) PNS females had higher body adiposity (F(1,14) = 11.91, p = 0.004), while PNS males had lower body adiposity (F(1,14) = 17.09, p = 0.001) compared to same sex CTRLs. (HI) PNS had dramatically different effects on glucose (Fint(5,24) = 5.27, p = 0.002) and insulin (Fint(4,25) = 7.17, p = 0.001) tolerance depending on the sex of the offspring. PNS did not affect glucose or insulin tolerance in females (H), but dramatically improved both the glucose (F(5,10) = 4.07, p = 0.028) and insulin (F(1,14) = 7.32, p = 0.027) tolerance in PNS males exposed to HF diet (I). Glucose tolerance test (GTT) is displayed on the left y-axis and insulin tolerance test (ITT) on the right y-axis. Data presented as mean and S.E.M. N = 6–10.
Figure 6
Figure 6
Prenatal stress (PNS) affects global placental DNA/RNA methylation and gene expression in females. (A) Global DNA methylation differed between the groups and was higher in PNS females compared to female controls (CTRLs; Kruskal Wallis H = 19.71, p = 0.000). (B) Global DNA hydroxymethylation methylation differed between the groups and was higher in the PNS groups (Kruskal Wallis H = 15.9, p = 0.001). (C) Global RNA methylation differed between the groups and was lower in PNS females compared to female CTRLs (Kruskal Wallis H = 10.86, p = 0.013). Data presented as min. to max. with median. Specific group comparisons based on Mann Whitney tests. (DG) Placental gene expression for enzymes involved in DNA methylation and regulation of hydroxy(de)methylation and RNA methylation and demethylation were mainly determined by fetal sex (F(12,17) = 7.65, p = 0.000). Dnmt3a (Fint(1,31) = 7.32, p = 0.011) (D), Tet2 (Fint (1,31) = 5.60, p = 0.025) (E) and Alkbh5 (F(int(1,31) = 10.18, p = 0.003) (G) further showed a prenatal treatment × sex interaction and were upregulated by PNS only in females. Significance between the groups was based on post hoc Tukey HSD for multiple comparisons. *p < 0.05 between CTRLs and PNS in the same sex and #p < 0.05 between males and females in the same group. Data presented as mean and S.E.M. N = 8. (HK) Gene expression heatmap of genes contained in 4 significant KEGG pathways from RNA-Seq of CTRL (N = 6) and PNS female placentas (N = 6). (H) ABC transporter pathway (q-value = 0.073), (I) circadian entrainment (q-value = 0.060), (J) cytokine–cytokine receptor interaction (q-value = 0.004) and (K) oxytocin pathway (q-value = 0.073). (L) Heatmap showing the significant changes in expression of nutrient transporters resulting from PNS. (N = 6).
Figure 7
Figure 7
Prenatal stress (PNS) induced abnormalities in hypothalamic gene expression in adult females and fetuses. (A) Gene ontology (GO) enrichment analysis based on a hypothalamic gene expression array of the adult female hypothalamus of control (CTRL) and PNS animals. (B) RT-PCR validation shows different gene expression between the groups (Fint(4,69) = 9.48, p = 0.001). (C) STRING pathway analysis linking the affected genes (https://string-db.org). (D) Relative expression of the selected genes in the female fetal hypothalamus shows abnormalities resulting from PNS (Fint(4,80) = 17.74, p = 0.001). Data presented as mean and S.E.M. N = 6–12.
figs1
figs1
Image 1

Similar articles

Cited by

References

    1. Keski-Rahkonen A., Mustelin L. Epidemiology of eating disorders in Europe. Current Opinion in Psychiatry. 2016;29(6):340–345. - PubMed
    1. Smink F.R.E., van Hoeken D., Hoek H.W. Epidemiology of eating disorders: incidence, prevalence and mortality rates. Current Psychiatry Reports. 2012;14(4):406–414. - PMC - PubMed
    1. Smink F.R.E., van Hoeken D., Hoek H.W. Epidemiology, course, and outcome of eating disorders. Current Opinion in Psychiatry. 2013;26(6):543–548. - PubMed
    1. Su X., Liang H., Yuan W., Olsen J., Cnattingius S., Li J. Prenatal and early life stress and risk of eating disorders in adolescent girls and young women. European Child and Adolescent Psychiatry. 2016;25:1245–1253. - PMC - PubMed
    1. Steiger H., Thaler L. Eating disorders, gene-environment interactions and the epigenome: roles of stress exposures and nutritional status. Physiology and Behavior. 2016;162:181–185. - PubMed

Publication types