. 2018 Sep 20;71(6):1012-1026.e3.
doi: 10.1016/j.molcel.2018.07.033. Epub 2018 Aug 30.

Quantitative Activity Profile and Context Dependence of All Human 5' Splice Sites

Affiliations

Quantitative Activity Profile and Context Dependence of All Human 5' Splice Sites

Mandy S Wong et al. Mol Cell. .

Abstract

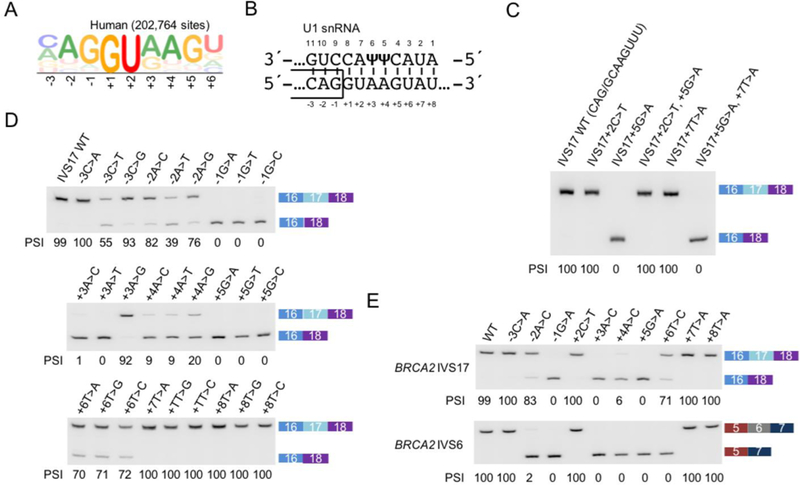
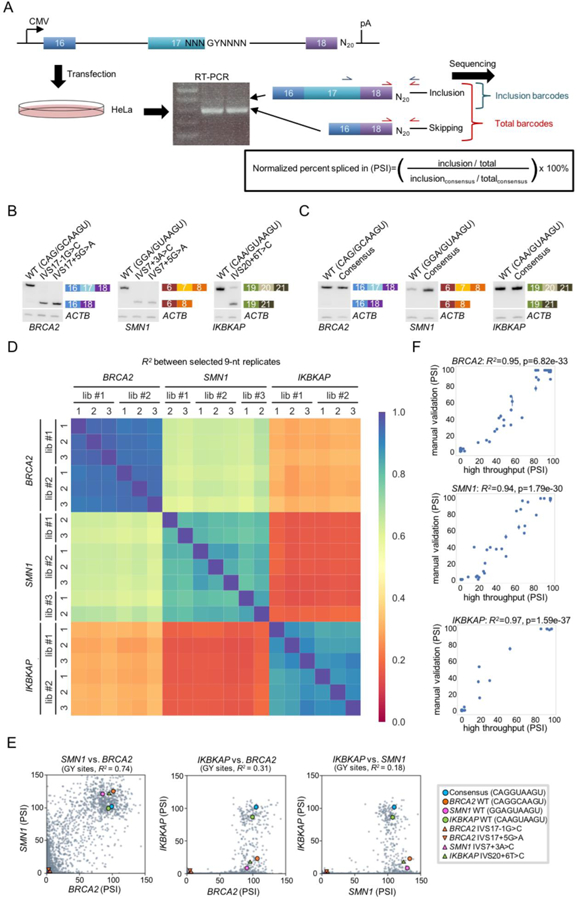
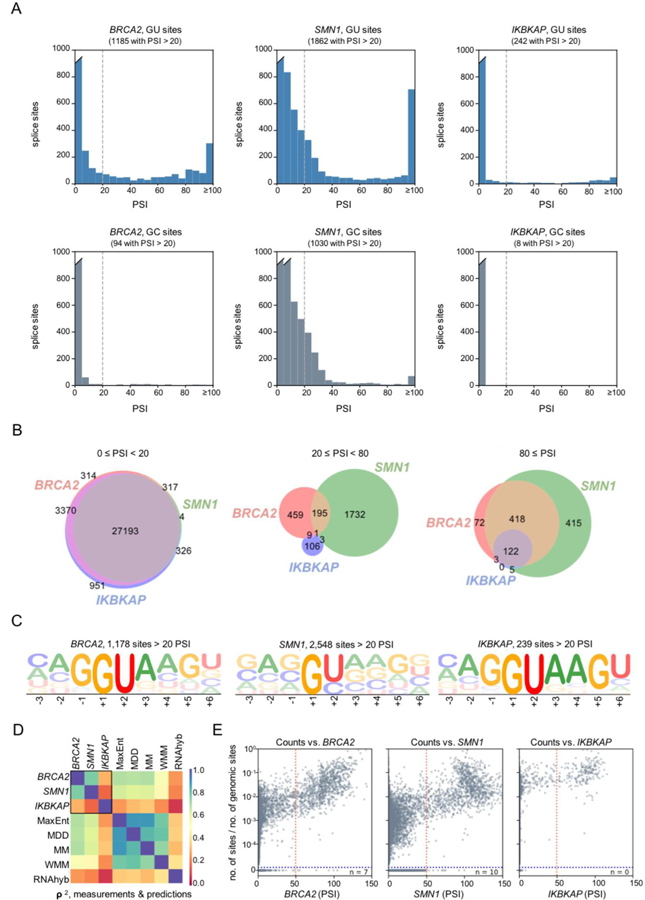
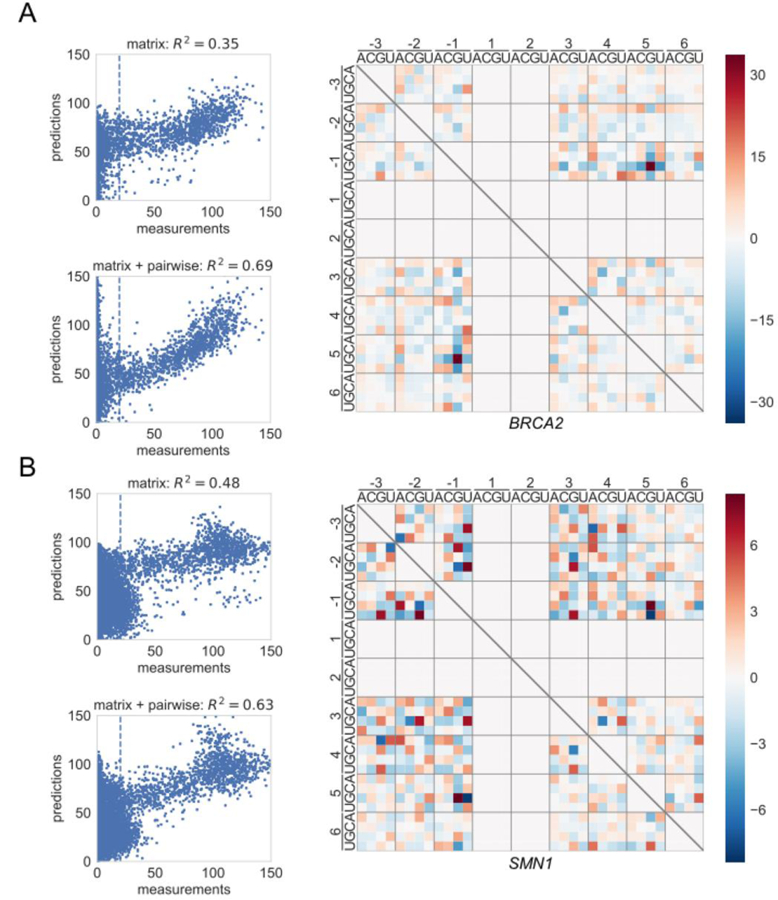
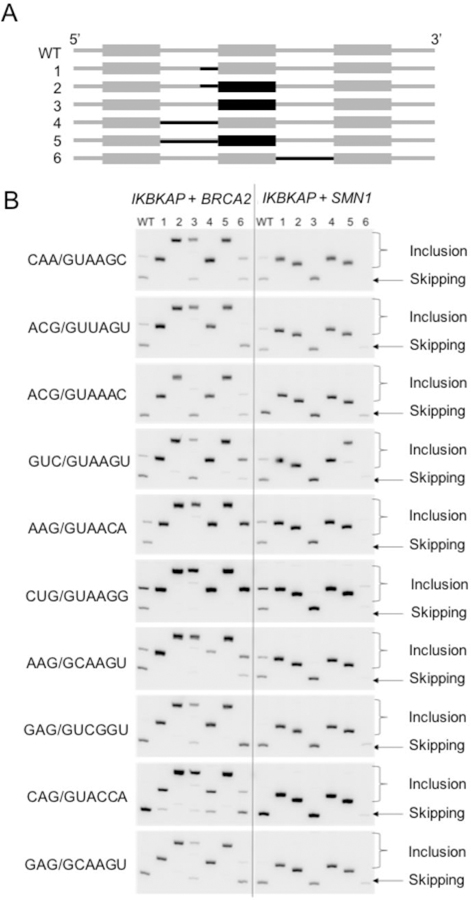
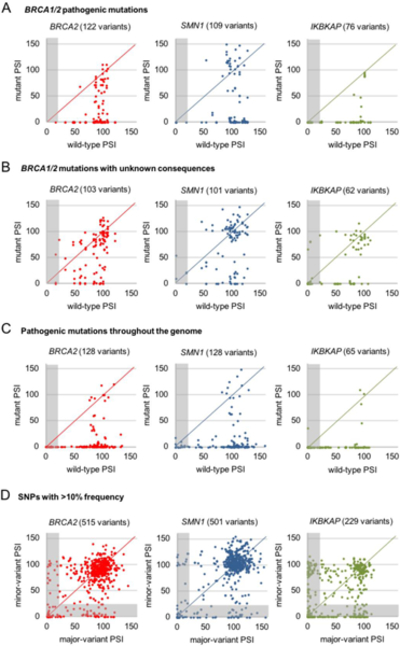
Pre-mRNA splicing is an essential step in the expression of most human genes. Mutations at the 5' splice site (5'ss) frequently cause defective splicing and disease due to interference with the initial recognition of the exon-intron boundary by U1 small nuclear ribonucleoprotein (snRNP), a component of the spliceosome. Here, we use a massively parallel splicing assay (MPSA) in human cells to quantify the activity of all 32,768 unique 5'ss sequences (NNN/GYNNNN) in three different gene contexts. Our results reveal that although splicing efficiency is mostly governed by the 5'ss sequence, there are substantial differences in this efficiency across gene contexts. Among other uses, these MPSA measurements facilitate the prediction of 5'ss sequence variants that are likely to cause aberrant splicing. This approach provides a framework to assess potential pathogenic variants in the human genome and streamline the development of splicing-corrective therapies.


Conflict of interest statement

Declaration of Interests

The authors declare no competing interests.

Figures

Figure 1.
Figure 1.. 5′ss activity and the effects of mutations can be recapitulated in minigenes.
(A) Sequence logo generated from 202,764 5′ss sequences in the human transcriptome. (B) Diagram showing the base-pairing between U1 snRNA and the consensus 5′ss sequence. ψ represents pseudouridine, an isomer of uridine found at conserved positions in U1 snRNA. (C) Systematic mutation of the exon 17 5′ss of a BRCA2 minigene spanning exons 16–18. Gel image is representative of triplicates. Percent spliced in (PSI) is indicated below each lane. (D) Different nucleotides at the same position induce exon skipping to similar extents, except for a few exceptions when the mutated nucleotide maintains complementarity by forming a G:ψ wobble base pair with U1 snRNA (e.g., +3A>G). Gel images are representative of triplicates. (E) BRCA2 intron 17 5′ss wild-type (WT) and mutant sequences replacing the 5′ss of BRCA2 intron 6 in a BRCA2 exons 5–7 minigene (bottom) show similar splicing efficiencies compared to the intron 17 context (top). Gel images are representative of triplicates.
Figure 2.
Figure 2.. MPSA measurements for 5′ss sequences.
(A) Schematic of the MPSA used to assess all 5′ss sequences. Minigenes were inserted into the pcDNA5 expression vector, which has a cytomegalovirus (CMV) promoter and a bGH polyadenylation site (pA). See also Figure S1. (B) Splicing of BRCA2, SMN1, and IKBKAP minigenes with wild-type (WT) and mutant 5′ss sequences. These measurements confirm that our minigene constructs can recapitulate the effects of known disease-associated mutations. ACTB was amplified in the same PCR reaction as a loading control. The gel image was divided for easier visualization. Gel images are representative of triplicates. (C) Splicing of BRCA2, SMN1, and IKBKAP minigenes with WT and consensus (CAG/GUAAGU) 5′ss sequences. The consensus sequence gives 100 PSI in all three contexts, substantiating its use in normalizing PSI measurements. ACTB was amplified in the same PCR reaction as a loading control. The gel image was divided for easier visualization. Gel images are representative of triplicates. (D) Heat map reporting the squared Pearson correlation (R2) of PSI values measured in 19 independent experiments. These correlations show that the replicate libraries within each context are more consistent with each other than with measurements made in heterologous contexts. Two low-quality datasets (SMN1 library 1, replicate 1 and SMN1 library 3, replicate 3) were not included in this and subsequent analyses (see Figure S2C, D). (E) Scatter plots comparing PSI values for each pair of minigene contexts. The consensus and WT 5′ss sequences are marked by circles with the indicated colors, and the mutant sequences are marked by triangles. (F) Comparison of high-throughput PSI measurements to manual measurements made in each context for the same 53 randomly selected 5′ss sequences for each context. Error bars indicate SD across triplicate transfections. Note that the high-throughput PSI measurements shown here are capped at 100. Figure S4 illustrates these measurements for each individual 5′ss assayed.
Figure 3.
Figure 3.. Further comparisons of MPSA measurements across three different contexts.
(A) Histograms showing the distribution of PSI measurements for all GU (top) and GC (bottom) 5′ss sequences in each of the three minigene contexts. The dashed line marks the 20% cutoff used to designate a 5′ss as active. The breaks in the left-most bars (indicated by a slant mark) indicate values exceeding the upper limit on the y-axis. PSI measurements above 100 were included in the right-most bar in each plot. (B) Venn diagrams showing contextual overlap in the number of 5′ss with activities in the ranges 0–20, 20–80, or 80–100 PSI. A complete 9×9 table of such overlaps is provided in Figure S5A. (C) Sequence logo generated from 5′ss sequences with PSI ≥20 in each context. Separate sequence logos for each independent-replicate library are shown in Figure S5B–D. (D) Heat map showing squared Spearman rank correlation values (ρ2) between the PSI measurements in each minigene context, and the predictions of previously published models, including: a maximum entropy model (MaxEnt; Yeo et al., 2004), a maximum dependence decomposition model (MDD; Burge et al., 1998), a first-order Markov model (MM; Krogh et al., 1994), a weight matrix model (WMM), and RNAhybrid predictions (RNAhyb; Kruger et al., 2006). Scatter plots for MPSA/model comparisons are shown in Figure S6A. (E) Scatter plots comparing the occurrence of each 5′ss in the human transcriptome, normalized to the occurrence of the respective 9-mer in the genome, to our measured PSI values. Here “n” indicates the number of 5′ss sequences with >50 PSI (left of the red dotted line) that do not occur in the human transcriptome (below the blue dotted line). A higher cutoff of PSI >50 (marked by the red dash line) was chosen to disregard the population of 5′ss with low activity seen only in the SMN1 context. See also Figure S6C.
Figure 4.
Figure 4.. Epistatic interactions in 5′ss activity.
(A) Scatter plots showing measured PSI values vs. PSI values predicted by either the matrix model (top) or the matrix + pairwise model (bottom) for BRCA2. The heat map shows the specific interactions present in the pairwise model. Red indicates a positive interaction; blue indicates a negative interaction. Note that pairwise models were inferred only for GU splice sites. Analyses for each separate library are shown in Figure S7C. (B) Same as A, but for SMN1. See also Figure S7D.
Figure 5.
Figure 5.. A weak upstream 3′ss drives the context-dependence of 5′ss activity in IKBKAP.
(A) Diagram of hybrid minigene constructs. IKBKAP minigene sequences are illustrated in gray. Black indicates either BRCA2 or SMN1 minigene sequences replacing the corresponding IKBKAP features. (B) Splicing of the hybrid constructs is shown in the RT-PCR gels. Due to the size differences of the middle exon between constructs, the size of the inclusion band varies. Gel images are representative of triplicates.
Figure 6.
Figure 6.. MPSA measurements help to predict pathogenic mutations.
(A) Scatter plots, corresponding to the three minigene contexts, comparing MPSA- measured PSI for multiple WT 5′ss sequences to mutant in BRCA1 and BRCA2 to mutant 5′ss variants thereof that are known to be pathogenic. Gray-shaded area indicates data points with WT PSI <20, which were excluded from the subsequent analysis. See also Figure S6B. (B) Same as above, but for mutant BRCA1 and BRCA2 5′ss sequences with unclassified or uncertain clinical significance. Gray-shaded area indicates data points with WT PSI <20, which were excluded from the analysis. See also Figure S6B. (C) Same as above, but for known disease-causing mutations across a broad range of genes and diseases, available from DBASS5 online resource (Buratti et al., 2007). Gray-shaded area indicates data points with WT PSI <20, which were excluded from the analysis. See also Figure S6B. (D) Same as above, but for 5′ss SNPs with >10% frequency found in the human population, compiled from the ExAC database (Lek et al., 1016). Gray-shaded area indicates data points for which either the major or minor variants had PSI <20, which were excluded from the analysis. See also Figure S6B.

References

    1. Anderson SL, Coli R, Daly IW, Kichula EA, Rork MJ, Volpi SA, Ekstein J, and Rubin BY (2001). Familial dysautonomia is caused by mutations of the IKAP gene. Am J Hum Genet 68, 753–8. - PMC - PubMed
    1. Bao P, Hobartner C, Hartmuth K, and Luhrmann R (2017). Yeast Prp2 liberates the 5´ splice site and the branch site adenosine for catalysis of pre-mRNA splicing. RNA - PMC - PubMed
    1. Bertram K, Agafonov D, Dybkov O, Haselbach D, Leelaram MN, Will CL, Urlaub H, Kastner B, Luhrmann R, and Stark H (2017). Cryo-EM structure of a pre-catalytic human spliceosome primed for activation. Cell 170, 701–713. - PubMed
    1. Buratti E, and Baralle FE (2004). Influence of RNA secondary structure on the pre-mRNA splicing process. Mol Cell Biol 24, 10505–14. - PMC - PubMed
    1. Buratti E, Chives M, Romano M, Baralle M, Kralovicova J, Barallel F, Krainer A, and Vorechovsky I (2007). Aberrant 5’ splice sites in human disease genes: mutation pattern, nucleotide structure and comparison of computational tools that predict their utilization. Nucleic Acids Res 35, 4250–6. - PMC - PubMed

Publication types

MeSH terms