. 2019 Jan 8;29(1):141-155.e9.
doi: 10.1016/j.cmet.2018.08.007. Epub 2018 Aug 30.

Fibroblasts Mobilize Tumor Cell Glycogen to Promote Proliferation and Metastasis

Affiliations

Fibroblasts Mobilize Tumor Cell Glycogen to Promote Proliferation and Metastasis

Marion Curtis et al. Cell Metab. .

Abstract

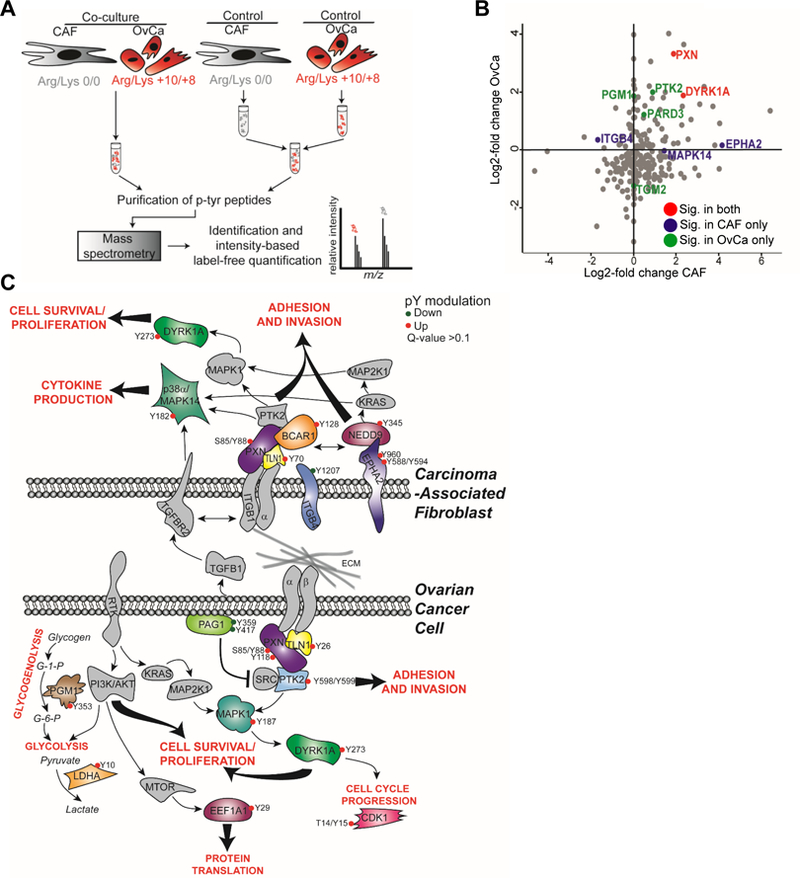
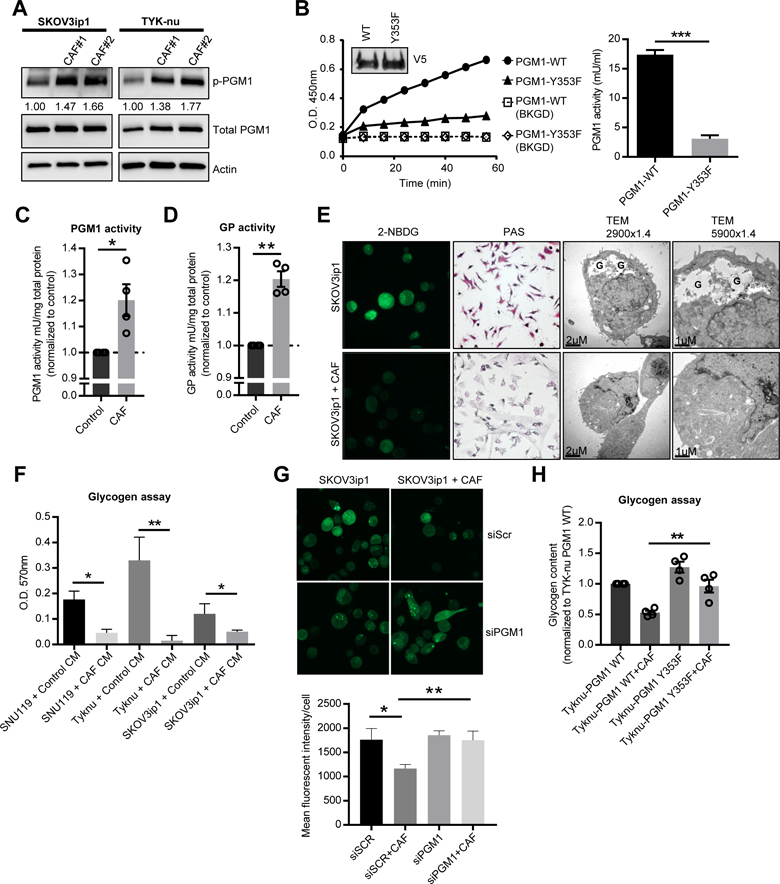
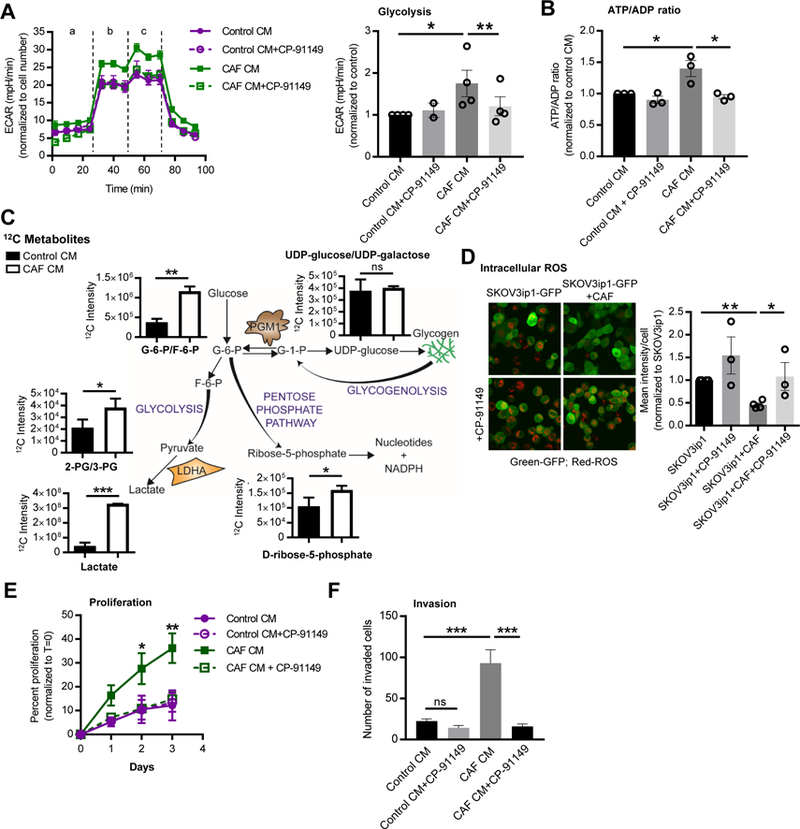
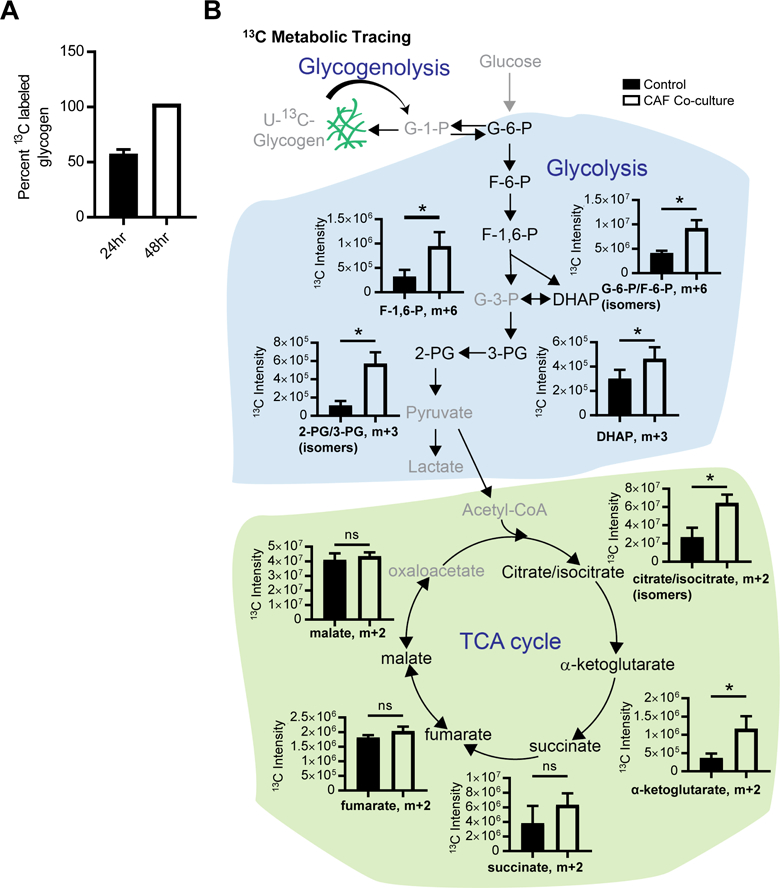
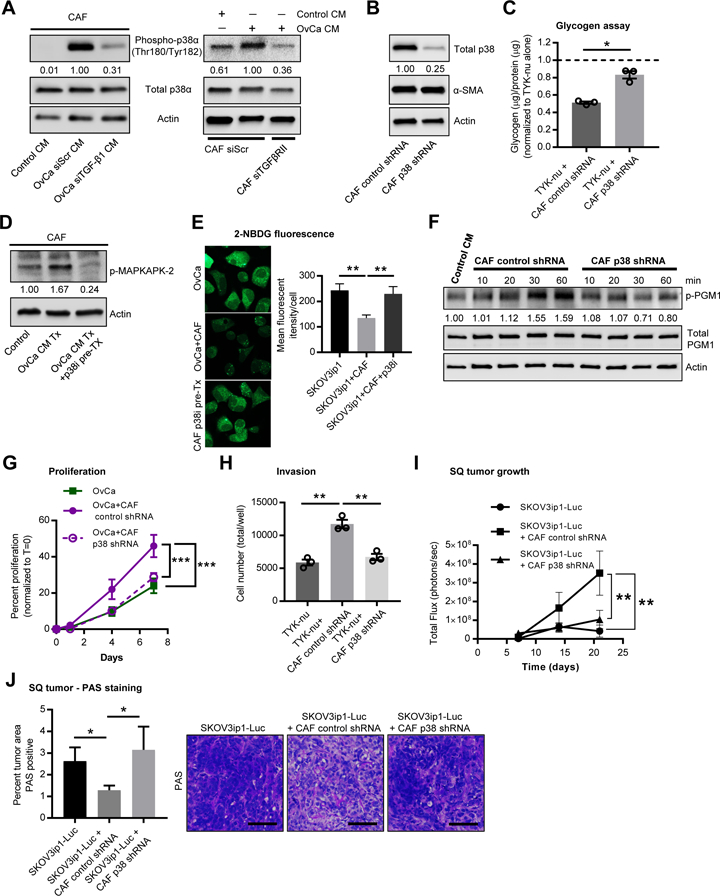
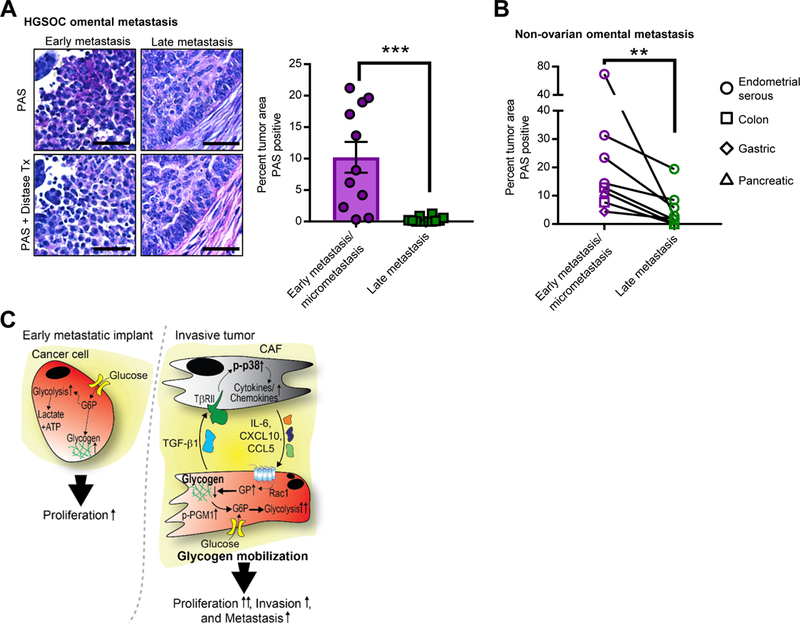
Successful metastasis requires the co-evolution of stromal and cancer cells. We used stable isotope labeling of amino acids in cell culture coupled with quantitative, label-free phosphoproteomics to study the bidirectional signaling in ovarian cancer cells and human-derived, cancer-associated fibroblasts (CAFs) after co-culture. In cancer cells, the interaction with CAFs supported glycogenolysis under normoxic conditions and induced phosphorylation and activation of phosphoglucomutase 1, an enzyme involved in glycogen metabolism. Glycogen was funneled into glycolysis, leading to increased proliferation, invasion, and metastasis of cancer cells co-cultured with human CAFs. Glycogen mobilization in cancer cells was dependent on p38α MAPK activation in CAFs. In vivo, deletion of p38α in CAFs and glycogen phosphorylase inhibition in cancer cells reduced metastasis, suggesting that glycogen is an energy source used by cancer cells to facilitate metastatic tumor growth.

Keywords: PGM1; cancer-associated fibroblast; glycogen; glycogen phosphorylase; metabolism; metastasis; omentum; ovarian cancer; p38-MAPK; phosphoproteomics.


Conflict of interest statement

Declaration of interests

The authors declare no competing interests.

Figures

Figure 1.
Figure 1.. Bidirectional signaling between cancer cells and CAFs mapped with quantitative phosphoproteomics.
(A) Experimental design. The OvCa cell line SKOV3ip1 was SILAC labeled with heavy arginine and lysine while CAFs were labeled with light Arg and Lys. Cells were co-cultured or cultured independently (control) for 4 hr prior to lysate collection (n=5/group). Control lysates were mixed together and then samples were digested with trypsin and phosphotyrosine containing peptides extracted using immunoprecipitation and identified by nano-LC/MS. For each identified peptide, the isotopic label was used to distinguish which cell population the peptide originated from. Intensity-based label-free quantification was used to determine relative levels of phosphorylated peptides in both cell types. (B) Scatter plot showing distribution of identified p-tyr proteins and their relative fold-change in both cancer cells and CAFs. Selection of significantly (Sig.) changed proteins from Table S3 are highlighted in either OvCa (green), CAF (blue), or in both cell types (red). (C) Schematic of selected significantly modified proteins highlighting key regulatory pathways. Phosphoproteins changed by co-culture are shown in color. Phosphotyrosine sites in red are increased and in green are decreased upon co-culture.
Figure 2.
Figure 2.. CAFs promote mobilization of glycogen stores in cancer cells.
(A) Western blot detecting phosphorylated phosphoglucomutase 1 (PGM1) at Y353 in SKOV3ip1 and TYK-nu cells co-cultured with primary human CAFs separated by a transwell cell culture insert. Values below p-PGM1 indicate the relative band intensity normalized to total PGM1 and fold change compared to the control. Images are representative of three biological repeats. (B) PGM1 enzyme activity assay of PGM1 immunoprecipitated from TYK-nu cells stably expressing the WT or Y353F mutant constructs (inset) and analyzed for PGM1 activity using glucose-1-phosphate as the substrate. Right panel, activity of PGM1 (***p< 0.001). Background (BKGD). (C) PGM1 enzyme activity assay and (D) glycogen phosphorylase (GP) activity in TYK-nu cells co-cultured with primary human CAFs (3 hr) separated by a transwell cell culture insert. Values are normalized to enzyme activity in TYK-nu cells cultured alone as indicated by the dotted line. Values are mean + SEM from 4 independent experiments (n=6/group/experiment) *p<0.05, **p< 0.01. (E) Glycogen stores were visualized by 2-NBDG fluorescence, PAS staining and transmission electron microscopy (TEM) in SKOV3ip1 cells co-cultured with or without CAFs (4 hr). In the TEM images, glycogen pools are identified by a “G”. (F) Glycogen assay on SKOV3ip1, TYK-nu, and SNU119 cells with and without CAF conditioned media (CM) after 4 hr. *p<0.05, **p< 0.01. Values are mean + SEM n=3. Data is representative of two biological repeats with CAF CM from two different patient-derived CAFs. (G) Glycogen content in SKOV3ip1 cells transfected with PGM1 siRNA or scramble control (siScr) visualized by 2-NBDG fluorescence. Values are mean + SEM from 3 independent experiments (n=50 cells/group). (H) Glycogen assay on TYK-nu cells expressing either wild-type (WT) PGM1 or the Y353F PGM1 mutant and co-cultured with primary human CAFs in a transwell cell culture insert. Values are mean + SEM from 3 independent experiments. **p<0.01.
Figure 3.
Figure 3.. Glycogen fuels glycolysis to promote proliferation and invasion.
(A) TYK-nu cells were pretreated (1 hr) with the glycogen phosphorylase inhibitor CP-91149 followed by stimulation with conditioned media (CM) from primary human CAFs for 16 hr. Glycolysis was measured using the Seahorse SF96 Extracellular Flux Analyzer. Left, extracellular acidification rates (ECAR) are shown normalized to cell number. ‘a’, ba sal glycolysis (no glucose); ‘b’, glycolysis (stimulated with glucose); ‘c’, glycolytic capacity (stimulated with oligomycin). Right panel shows the average of the 3 glycolysis time points for each group. Values are from 4 independent experiments (n=15/group). Comparisons were made to CAF CM using a paired, two-tailed t test (*p<0.05, **p<0.01). (B) ATP/ADP ratios in TYK-nu cells treated with CAF or control CM pretreated with or without CP-91149, an inhibitor of glycogen phosphorylase. Values are mean + SEM from 3 independent experiments (n=4/group). Comparisons were made to CAF CM using a paired, two-tailed t test (*p<0.05). (C) Steady state 12C metabolites in TYK-nu cells stimulated with control CM or CAF CM for 6 hr (n=3/group). Key metabolites are shown along with a schematic depicting the central pathways (* p<0.05, **p<0.01, ***p<0.001). (D) ROS level in GFP-labeled SKOV3ip1 cancer cells with or without CAF co-culture and CP-91149. Left, representative images of ROS staining (red). Right, quantification of 3 independent experiments. Values are mean + SEM. Samples were compared to OvCa-GFP+CAF using an unpaired, two-tailed t test (* p<0.05, **p<0.01). (E) Proliferation of TYK-nu cells exposed to CAF CM with or without the glycogen phosphorylase inhibitor CP-91149. Values are mean + SEM from 4 independent experiments (n=6/group). Comparisons were made to CAF CM using a Two-way ANOVA (* p<0.05, **p<0.01). (F) Invasion of TYK-nu cells exposed to CAF CM with or without the glycogen phosphorylase inhibitor CP-91149. Data is representative of 3 independent experiments. Values are mean + SEM (n=3/group). ***p<0.001.
Figure 4.
Figure 4.. Glycogen-derived metabolites feed glycolysis.
(A) Percent of glycogen labeled with U-13C-glucose tracer at 24 and 48hr. 13C-glucose (m+6) was measured using mass spectrometry following hydrolysis of U-13C-glycogen to glucose. TYK-nu cells were cultured in U-13C-glucose containing DMEM for 24hr or 48hr to synthesize U-13C-glycogen. (B) Glycogen tracing analysis. 13C metabolite tracing analysis of TYK-nu cells cultured with or without CAFs in a transwell insert for 30 min (n=4/group). Prior to the experiment, TYK-nu cells were cultured for 48hr in media containing 13C-glucose (to label glycogen), followed by culture in 12C-glucose for 1 hr to label pathway intermediates 12C, leaving U-13C-glycogen as the only 13C source for glycolysis. Peak intensities of the 13C metabolites are shown, along with a schematic depicting the pathways. (* p<0.05). G-1-P, glucose-1-phosphate; G-6-P, glucose-6-phosphate; F-6-P, fructose-6-phosphate; F-1,6-P, fructose-1,6-bisphosphate; DHAP, dihydroxyacetone phosphate; G-3-P, glyceraldehyde-3-phosphate; 3-PG, 3-phosphoglycerate; 2-PG, 2-phosphoglycerate.
Figure 5.
Figure 5.. Glycogen utilization is dependent on p38α MAPK activity in cancer associated fibroblasts.
(A) Western blot for p38α phosphorylation in CAFs. Left, CAFs treated with conditioned media (CM) from SKOV3ip1 cells transfected with either TGF-β1 or scrambled (siScr) siRNA. Right, CAFs transfected with either TGF-βRII or scrambled (siScr) siRNA were stimulated with control or SKOV3ip1 CM for 4 hr. Values represent relative band intensity of p-p38 expression normalized to total p38 and fold change relative to the OvCa stimulated sample. Images are representative of three biological repeats. (B) Validation of p38 knockdown in primary CAFs. α-SMA (smooth muscle actin) is unchanged with p38 knockdown. Values represent relative band intensity of total p38 expression normalized to actin and fold change relative to the control shRNA sample. Images are representative of three biological repeats with primary CAFs from three patients. (C) Glycogen assay on TYK-nu cells stimulated with CM collected from CAFs expressing a control shRNA or a p38α shRNA. Values are normalized to TYK-nu alone shown by the dotted line and represent 3 biological repeats. Values are mean + SEM (*p< 0.05). (D) Western blot for phospho-MAPKAPK-2, a downstream effector of the p38 MAPK pathway, in CAFs treated with and without PH-797804, a p38α MAPK inhibitor. Values represent relative band intensity of p-p38 normalized to actin. (E) Glycogen storage (left) was visualized by 2-NBDG fluorescence in SKOV3ip1 cancer cells after 4 hr of co-culture with CAFs. CAFs were pretreated with 2 µM of PH-797804 for 1 hr prior to co-culture. Right, quantification of 2-NBDG fluorescence. (F) Western blot for p-PGM1 at Y353, total PGM1 and actin in TYK-nu cells following stimulation by CM collected from CAFs expressing a control shRNA or a p38α shRNA for the indicated time. Values represent relative band intensity of p-PGM1 normalized to total PGM1 and fold change relative to the control CM sample. Images are representative of 4 biological replicates. (G) Proliferation of TYK-nu cells exposed to CM from primary CAFs expressing a control shRNA versus CAFs expressing a p38α shRNA. Data is representative of 2 independent experiments. Values are mean + SEM (n=6/group), ***p<0.001. (H) Boyden chamber invasion assay of TYK-nu treated with CM from either primary CAFs expressing a control shRNA or p38α shRNA. Values are mean + SEM from 3 independent experiments (n=3/group/experiment), **p< 0.01. (I) In vivo tumor growth of SKOV3ip1-Luc cells injected alone (n=6) or co-mixed with either primary CAFs expressing a control shRNA (n=8) or a p38α shRNA (n=8) and then injected subcutaneously into the flanks of female athymic nude mice. Bioluminescence imaging is shown over time. Comparisons were made using a repeated measure Two-way ANOVA (**p<0.01 for matching across groups) and Tukey’s multiple comparisons post-test was used to compare each group at day 21, **p< 0.01. (J) PAS staining of sub-cutaneous (SQ) tumors from experiments in Figure 5I. Left, quantification of percent of tumor area staining positive for PAS with background staining (distase insensitive areas, see methods) removed. Values are mean + SEM (n=6–8/group), *p< 0.05. Right, representative images of PAS staining in tumors from each group. Scale bar = 100µm.
Figure 6.
Figure 6.. p38α MAPK activity in CAFs regulates cytokines that induce ovarian cancer glycogen release and stimulate metastasis.
(A) Left, schematic of treatments for cytokine and chemokine array analysis (center) of conditioned media (CM) from CAFs stimulated with control CM (Control), or TYK-nu CM (OvCa Tx CM) either with or without pre-treatment with 2μM of the p38 M APK inhibitor PH-797804 (OvCa Tx+p38i pre-Tx). Following pre-stimulation, media was removed and replaced with serum-free media. CAF CM was collected 48 hr later. Right, Quantification of selected cytokine signals normalized to control CM. Values represent the average of the two technical replicates on the same membrane (**p< 0.01, **p< 0.001). Membrane images are representative images of two biological replicates with primary CAFs from two patients. (B) Western blot of glycogen synthase. SKOV3ip1 and OVKATE ovarian cancer cells were stimulated with CAF conditioned media (OvCa Tx CAF CM) or CM from CAFs pre-treated with the p38α inhibitor PH-797804 (OvCa Tx CAF CM +p38i pre-Tx). CM was generated as shown in Figure 6A and OvCa cells were incubated for 4 h. Values below glycogen synthase represent relative band intensity normalized to actin and fold change relative to the control sample. (C) Glycogen assay of SKOV3ip1 cells treated with CAF CM obtained as shown in the schematic in Figure 6A. ***p<0.001. Result is representative of 3 biological repeats. (D) Migration of SKOV3ip1 cells towards CAF CM generated as shown in Figure 6A. **p<0.01. Result is representative of 3 biological repeats. (E, F). Short term in vivo metastasis assay to the omentum. CM was generated as shown in the schematic in Figure 6A. Images below show GFP fluorescent SKOV3ip1 cells attached to the omentum in PBS. (E) SKOV3ip1-GFP-Luc OvCa cells were treated with Control CM, with CAF CM (OvCa Tx CAF CM), or CAF CM from CAFs pretreated with a p38 inhibitor (OvCa Tx CAF CM + p38 pre Tx). n=5/group. Luminescence was quantified by a luciferase assay on the isolated omentum. (F) SKOV3ip1-GFP-Luc OvCa cells were treated with Control CM (n=3), with CAF CM (OvCa Tx CAF CM) (n=5), or CAF CM plus a glycogen phosphorylase inhibitor (OvCa Tx CAF CM + CP-91149) (n=5). Luminescence was quantified by live animal imaging using the Xenogen IVIS Spectrum Imaging System after 24hr. Comparisons between control CM and OvCa Tx CAF CM + CP-91149 were not significant. *p< 0.05, **p<0.01. (G) Glycogen assay of TYK-nu cells stimulated with recombinant cytokines CCL5 (CXCL10 (50ng/ml), ng/ml), IL-6 (100ng/ml), or IL-8 (100ng/ml) after 6hr. Values are normalized to TYK-nu alone and represent 3 biological replicates. Values are mean + SEM (*p< 0.05). (H) Glycogen assay of TYK-nu cells with CAF co-culture and the indicated inhibitors (i): STAT3 inhibitor (Stattic, 10μM), MEK1/2 inhibitor (Tramet inib, 10μM), RAC1 inhibitor (NSC23766, 50μM), PKA inhibitor-1 (H-89, 10μM), or PKA inhibitor-2 (14–22 amide, 10μM) after 1hr. Cancer cells were pretreated with the compounds or vehicle control for 30 min and then co-cultured with CAFs for 1hr prior to the assay. Values are normalized to TYK-nu alone and represent 3–6 biological replicates. Values are mean + SEM (*p< 0.05, **p< 0.01).
Figure 7.
Figure 7.. Glycogen utilization fuels early metastasis.
(A) PAS Staining of human OvCa tissue Left, representative images of PAS staining indicating glycogen storage (deep purple stain) in early, microscopic omental implants (FIGO IIIA disease) and late, advanced metastasis (FIG IIIC) of high grade serous OvCa. Distase treatment (Tx) was used to specifically digest glycogen from the tissue prior to PAS staining. PAS positive, distase sensitive areas of tumor were quantified in early implants (n=11) and invasive tumor (n=12). Scale bar = 50μm. Right, the average percent PAS positive tumor area from 5 fields. Comparisons were made using an unpaired, one-way, Mann Whitney test, ***p< 0.001. (B) Glycogen content in early and late metastasis in colon, gastric, pancreatic, and serous endometrial cancer. Quantification of PAS staining comparing paired samples of early metastasis/micrometastases to large metastatic lesions (late metastasis) in the omentum from the same patient (n=7). Samples quantified as in Fig. 7A. Comparisons were made using a Wilcoxon matched-pairs signed rank test, **p< 0.01. (C) Model of CAF-mediated glycogen hydrolysis in cancer cells. OvCa cells store glycogen when excess glucose is available. During early metastasis, as the tumor takes hold, stromal changes occur, including the generation and recruitment of CAFs through TGF-β1. The tumor cells and CAFs then engage in bidirectional signaling: p38α MAPK is activated in CAFs resulting in CAF production of chemokines and cytokines that initiate the mobilization of glycogen stores in cancer cells through activation of glycogen phosphorylase. This burst of additional energy allows the cancer cells to begin high energy tasks such as migration, invasion and further metastasis.

References

    1. Alspach E, Flanagan KC, Luo X, Ruhland MK, Huang H, Pazolli E, Donlin MJ, Marsh T, Piwnica-Worms D, Monahan J , et al. (2014). p38MAPK plays a crucial role in stromal-mediated tumorigenesis. Cancer Discov 4, 716–729. - PMC - PubMed
    1. Arrizabalaga O, Lacerda HM, Zubiaga AM, and Zugaza JL (2012). Rac1 protein regulates glycogen phosphorylase activation and controls interleukin (IL)-2-dependent T cell proliferation. J Biol Chem 287, 11878–11890. - PMC - PubMed
    1. Bae E, Kim HE, Koh E, and Kim KS (2014). Phosphoglucomutase1 is necessary for sustained cell growth under repetitive glucose depletion. FEBS Lett 588, 3074–3080. - PubMed
    1. Beausoleil SA, Villen J, Gerber SA, Rush J, and Gygi SP (2006). A probability-based approach for high-throughput protein phosphorylation analysis and site localization. Nat Biotechnol 24, 1285–1292. - PubMed
    1. Bhowmick NA, Neilson EG, and Moses HL (2004). Stromal fibroblasts in cancer initiation and progression. Nature 432, 332–337. - PMC - PubMed

Publication types