. 2018 Aug 10;9(62):31985-31998.
doi: 10.18632/oncotarget.25868.

Metabolomic analysis of uterine serous carcinoma with acquired resistance to paclitaxel

Affiliations

Metabolomic analysis of uterine serous carcinoma with acquired resistance to paclitaxel

Manabu Seino et al. Oncotarget. .

Erratum in

Abstract

Introduction: Uterine serous carcinoma (USC) is more aggressive than other subtypes of endometrial carcinoma and is associated with a poor prognosis. We analyzed the metabolomic profile of USC with acquired resistance to paclitaxel.

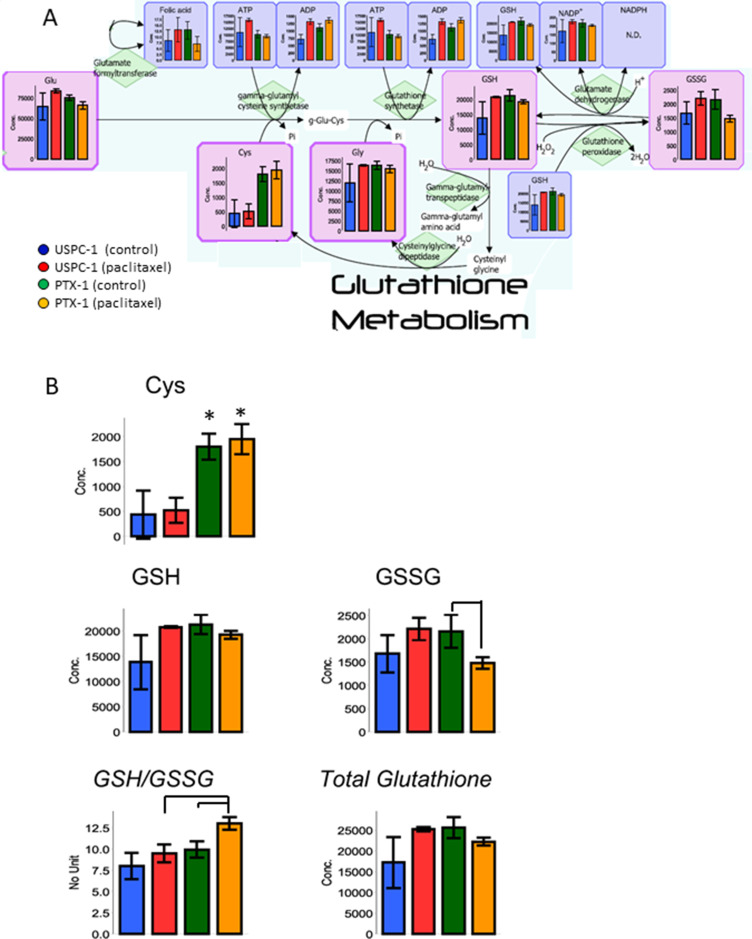
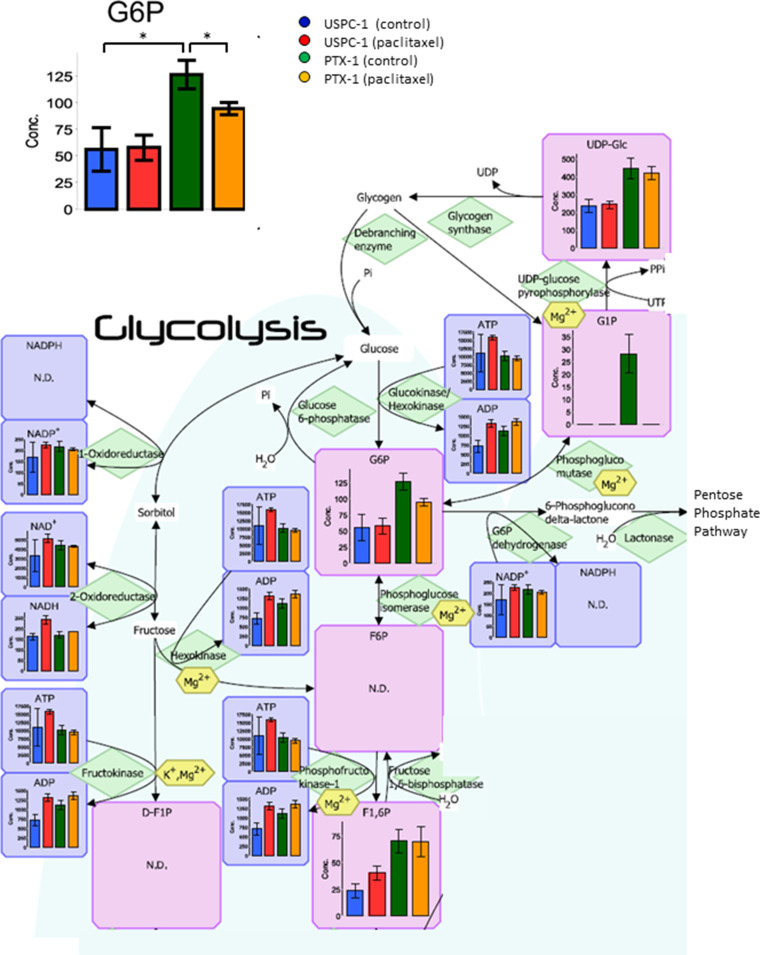
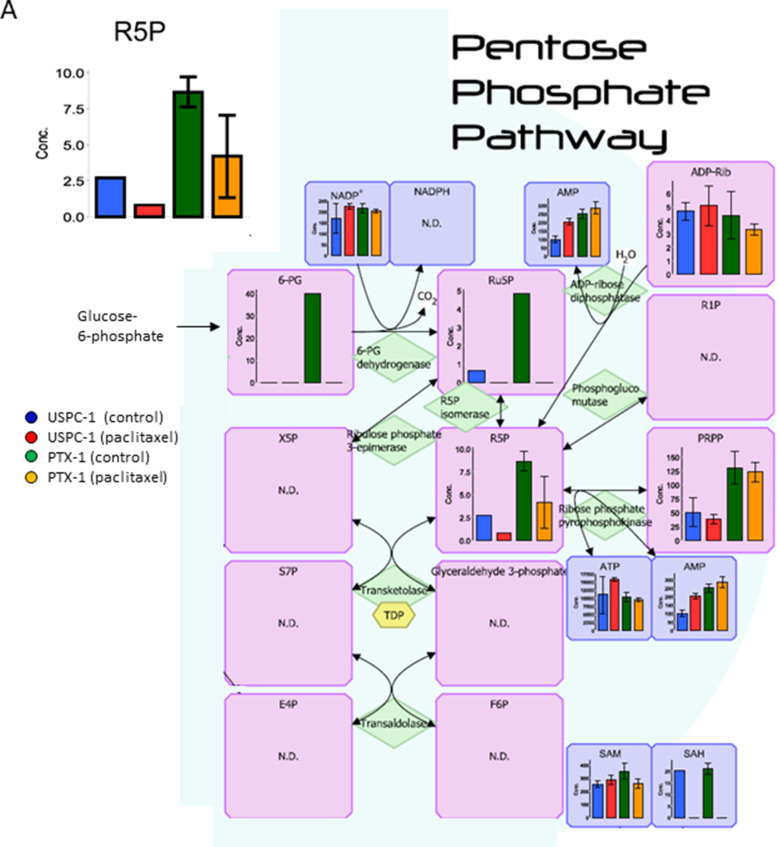
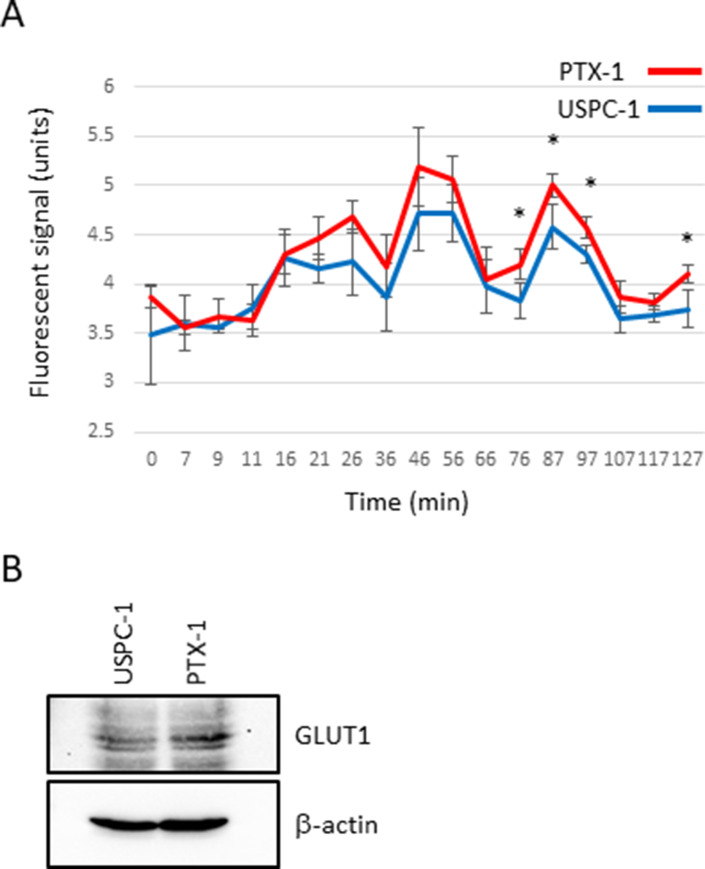
Results: Glutathione (GSH) concentration in PTX-1 cells was higher than in USPC-1 cells. In addition, GSH concentration in the USPC-1 cells increased after treatment with paclitaxel but was unchanged in PTX-1 cells. Glucose-6-phosphate (G6P) and ribose-5-phosphate (R5P) concentrations in PTX-1 cells were higher than those in USPC-1 cells. G6P concentration in the USPC-1 cells was unchanged after treatment with paclitaxel, while it decreased in PTX-1 cells.

Conclusion: Our results indicate that increased GSH and glucose metabolism may be related to acquiring resistance to paclitaxel in USC and thus may be targets for anti-USC therapy.

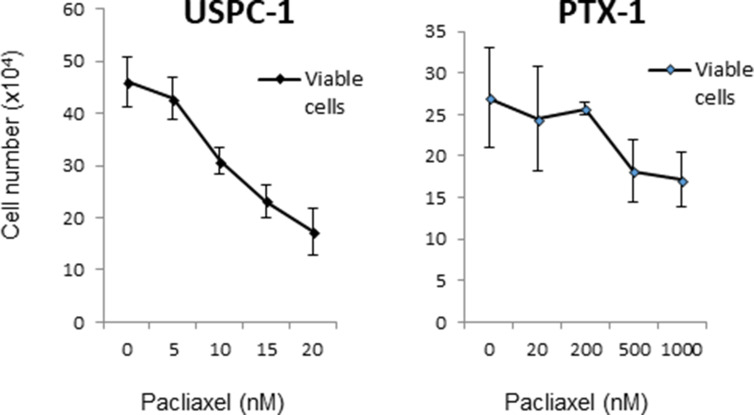
Materials and methods: We compared metabolic profiles and reactions to paclitaxel in both a wild type USC cell line (USPC-1) and PTX-1, a cell line derived from USPC-1 which acquired paclitaxel resistance, using a capillary electrophoresis CE-MS/MS system.

Keywords: endometrial cancer; metabolomic analysis; paclitaxel; uterine serous carcinoma.


Conflict of interest statement

CONFLICTS OF INTEREST The Authors declare no conflicts of interest.

Figures

Figure 1
Figure 1. Growth inhibition of uterine serous carcinoma cells after treatment with paclitaxel
USPC-1 and PTX-1 cells were treated with the indicated concentrations of paclitaxel for 24 h. Then the number of viable cells was determined for each cell line. The IC50 concentration was calculated using the formula described in Materials and Methods. Values in the graphs represent the means ± SD of three independent experiments.
Figure 2
Figure 2. Lipid metabolism analysis after treatment with paclitaxel in uterine serous carcinoma cells
Each cell line was treated with 15 nM paclitaxel or control vehicle for 24 h. Blue bars represent USPC-1 cells (control), red bars represent USPC-1 cells treated with paclitaxel, green bars represent PTX-1 cells (control) and yellow bars represent PTX-1 cells treated with paclitaxel. Values in the graphs represent the means ± SD of three independent experiments. *P < 0.05. N.D.: not detected.
Figure 3
Figure 3. Creatine metabolism analysis after treatment with paclitaxel in uterine serous carcinoma cells
Each cell line was treated with 15 nM paclitaxel or control vehicle for 24 h. Blue bars represent USPC-1 cells (control), red bars represent USPC-1 cells treated with paclitaxel, green bars represent PTX-1 cells (control) and yellow bars represent PTX-1 cells treated with paclitaxel. Values in the graphs represent the means ± SD of three independent experiments. *P < 0.05.
Figure 4
Figure 4. Methionine metabolism analysis after treatment with paclitaxel in uterine serous carcinoma cells
Each cell line was treated with 15 nM paclitaxel or control vehicle for 24 h. Blue bars represent USPC-1 cells (control), red bars represent USPC-1 cells treated with paclitaxel, green bars represent PTX-1 cells (control) and yellow bars represent PTX-1 cells treated with paclitaxel. Values in the graphs represent the means ± SD of three independent experiments. *P < 0.05. N.D.: not detected.
Figure 5
Figure 5. Glutathione (GSH) metabolism analysis after treatment with paclitaxel in uterine serous carcinoma cells
(A) Each cell line was treated with 15 nM paclitaxel or control vehicle for 24 h. Blue bars represent USPC-1 cells (control), red bars represent USPC-1 cells treated with paclitaxel, green bars represent PTX-1 cells (control) and yellow bars represent PTX-1 cells treated with paclitaxel. Values in the graphs represent the means ± SD of three independent experiments. (B) Concentrations of cysteine, GSH, GSSG and total glutathione in USC cells after treatment with paclitaxel. GSH/GSSG (glutathione redox ratio) = [GSH]/[GSSG]. Total glutathione = [GSH] + 2 × [GSSG], *P < 0.05. N.D.: not detected.
Figure 6
Figure 6. Analysis of the glycolytic pathway after treatment with paclitaxel in uterine serous carcinoma cells
Each cell line was treated with 15 nM paclitaxel or control vehicle for 24 h. Blue bars represent USPC-1 cells (control), red bars represent USPC-1 cells treated with paclitaxel, green bars represent PTX-1 cells (control) and yellow bars represent PTX-1 cells treated with paclitaxel. Values in the graphs represent the means ± SD of three independent experiments. *P < 0.05. N.D.: not detected.
Figure 7
Figure 7. Analysis of the pentose phosphate pathway after treatment with paclitaxel in uterine serous carcinoma cells
Each cell line was treated with 15 nM paclitaxel or control vehicle for 24 h. Blue bars represent USPC-1 cells (control), red bars represent USPC-1 cells treated with paclitaxel, green bars represent PTX-1 cells (control) and yellow bars represent PTX-1 cells treated with paclitaxel. Values in the graphs represent the means ± SD of three independent experiments. *P < 0.05. N.D.: not detected.
Figure 8
Figure 8. Concentration of 2-oxoglutarate (2-OG) and glutamic acid (Glu) after treatment with paclitaxel in uterine serous carcinoma cells
Each cell line was treated with 15 nM paclitaxel or control vehicle for 24 h. Blue bars represent USPC-1 cells (control), red bars represent USPC-1 cells treated with paclitaxel, green bars represent PTX-1 cells (control) and yellow bars represent PTX-1 cells treated with paclitaxel. Values in the graphs represent the means ± SD of three independent experiments. *P < 0.05.
Figure 9
Figure 9. Glucose consumption and glucose transporter expression in uterine serous carcinoma cells
(A) Oxygen consumption assay. USPC-1 and PTX-1 cells were seeded in a 96-well plate at density of 8.0 × 10⁴ cells. The plate was read using a fluorescence plate reader. The excitation and emission spectra were 380 nm and 650 nm, respectively. The values in the graphs represent means ± SD of three independent experiments. *P < 0.05. (B) USPC-1 and PTX-1 cells were subjected to immunoblot analysis of GLUT1 and β-actin.

References

    1. Morice P, Leary A, Creutzberg C, Abu-Rustum N, Darai E. Endometrial cancer. The Lancet. 2016;387:1094–108. doi: 10.1016/s0140-6736(15)00130-0. - DOI - PubMed
    1. Tropé C, Kristensen GB, Abeler VM. Clear-cell and papillary serous cancer: treatment options. Best Pract Res Clin Obstet Gynaecol. 2001;15:433–46. - PubMed
    1. Matthews RP, Hutchinson-Colas J, Maiman M, Fruchter RG, Gates EJ, Gibbon D, Remy JC, Sedlis A. Papillary serous and clear cell type lead to poor prognosis of endometrial carcinoma in black women. Gynecol Oncol. 1997;65:206–12. - PubMed
    1. Slomovitz BM, Burke TW, Eifel PJ, Ramondetta LM, Silva EG, Jhingran A, Oh JC, Atkinson EN, Broaddus RR, Gershenson DM, Lu KH. Uterine papillary serous carcinoma (UPSC): a single institution review of 129 cases. Gynecol Oncol. 2003;91:463–69. - PubMed
    1. Podratz KC, Mariani A. Uterine papillary serous carcinomas: the exigency for clinical trials. Gynecol Oncol. 2003;91:461–62. - PubMed