. 2018 Aug 28;3(4):e00084-18.
doi: 10.1128/mSystems.00084-18. eCollection 2018 Jul-Aug.

Limitations of Correlation-Based Inference in Complex Virus-Microbe Communities

Affiliations

Limitations of Correlation-Based Inference in Complex Virus-Microbe Communities

Ashley R Coenen et al. mSystems. .

Abstract

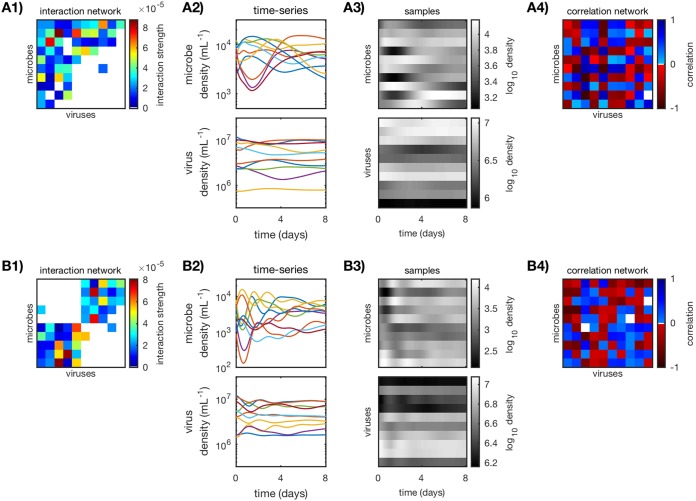
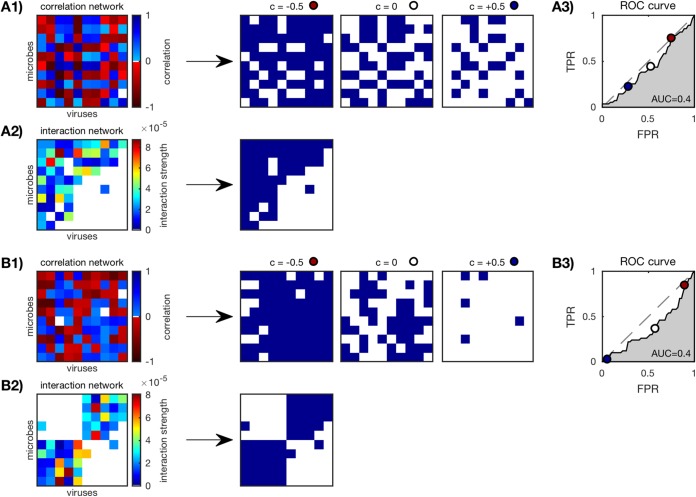
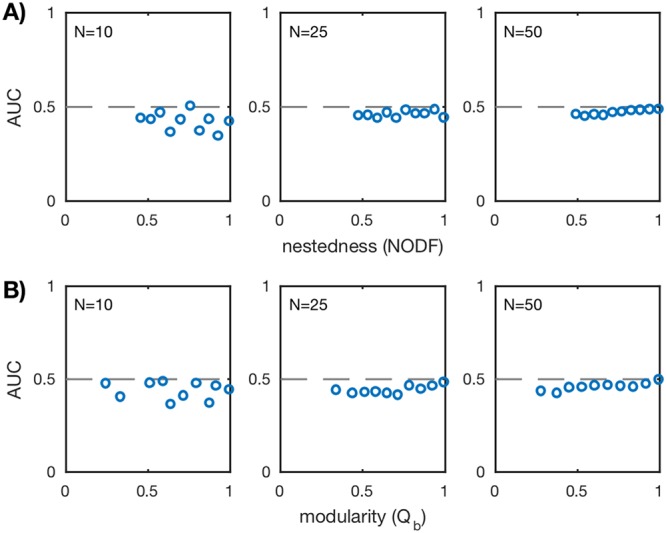
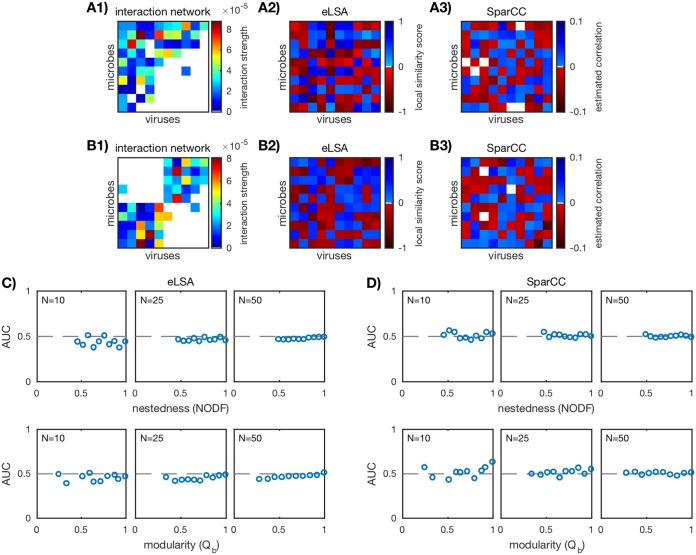
Microbes are present in high abundances in the environment and in human-associated microbiomes, often exceeding 1 million per ml. Viruses of microbes are present in even higher abundances and are important in shaping microbial populations, communities, and ecosystems. Given the relative specificity of viral infection, it is essential to identify the functional linkages between viruses and their microbial hosts, particularly given dynamic changes in virus and host abundances. Multiple approaches have been proposed to infer infection networks from time series of in situ communities, among which correlation-based approaches have emerged as the de facto standard. In this work, we evaluate the accuracy of correlation-based inference methods using an in silico approach. In doing so, we compare predicted networks to actual networks to assess the self-consistency of correlation-based inference. At odds with assumptions underlying its widespread use, we find that correlation is a poor predictor of interactions in the context of viral infection and lysis of microbial hosts. The failure to predict interactions holds for methods that leverage product-moment, time-lagged, and relative-abundance-based correlations. In closing, we discuss alternative inference methods, particularly model-based methods, as a means to infer interactions in complex microbial communities with viruses. IMPORTANCE Inferring interactions from population time series is an active and ongoing area of research. It is relevant across many biological systems-particularly in virus-microbe communities, but also in gene regulatory networks, neural networks, and ecological communities broadly. Correlation-based inference-using correlations to predict interactions-is widespread. However, it is well-known that "correlation does not imply causation." Despite this, many studies apply correlation-based inference methods to experimental time series without first assessing the potential scope for accurate inference. Here, we find that several correlation-based inference methods fail to recover interactions within in silico virus-microbe communities, raising questions on their relevance when applied in situ.

Keywords: correlation; inference; interaction network; microbial ecology; viral ecology.


Figures

FIG 1
FIG 1
Calculating standard Pearson correlation networks for an in silico nested (A) and a modular (B) community (N = 10). (A1 and B1) Original weighted interaction networks, generated as described in “Generating interaction networks and characterizing network structure” and “Choosing life history traits for coexistence” in Materials and Methods. (A2 and B2) Simulated time series of the virus-microbe dynamic system as described in “Simulating and sampling time series” (δ = 0.3). (A3 and B3) Log-transformed samples, sampled every 2 h for 200 h from the simulated time series. (A4 and B4) Pearson correlation networks, calculated from log-transformed samples as described in “Standard and time-delayed Pearson correlation networks.”
FIG 2
FIG 2
Scoring correlation network accuracy of an in silico nested (A) and a modular (B) community (N = 10; see Fig. 1) as described in “Scoring correlation network accuracy” in Materials and Methods. (A1 and B1) Correlation networks are binarized according to thresholds c between −1 and +1, three of which are shown here (c = −0.5, 0, and 0.5). (A2 and B2) Original interaction networks are also binarized. (A3 and B3) True-positive rate (TPR) versus false-positive rate (FPR) of the binarized correlation networks for each threshold c. Three example thresholds (c = −0.5, 0, and 0.5) are marked (red, white, and dark blue circles). The “nondiscrimination” line (gray dashed line) is where TPR = FPR. The AUC or area under the ROC is a measure of relative TPR to FPR over all thresholds; AUC = 1 is a perfect result.
FIG 3
FIG 3
AUC values for standard Pearson correlation for the ensemble of nested (A) and modular (B) communities over three network sizes N = 10, 25, 50 (20 communities for each network size). AUC is computed as described in “Scoring correlation network accuracy” in Materials and Methods. Each plotted point corresponds to a unique in silico community. The dashed lines mark AUC = 1/2 and imply that the predicted network did no better than random guessing.
FIG 4
FIG 4
Performance of time-delayed Pearson correlation. (A1 and B1) Two examples of in silico interaction networks (N = 10). (A2 and B2) Time delays τij for each virus-host pair, chosen so that the absolute value of the correlation is maximized. (A3 and B3) Time-delayed Pearson correlation networks calculated as described in “Standard and time-delayed Pearson correlation networks” in Materials and Methods. (C) AUC values for the ensemble of nested (top row) and modular (bottom row) communities over three network sizes N = 10, 25, 50 (20 communities for each network size). Each plotted point corresponds to a unique in silico community. The dashed lines mark AUC = 1/2 and imply that the predicted network did no better than random guessing.
FIG 5
FIG 5
Performance of correlation-based inference methods eLSA and SparCC. (A1 and B1) Two examples of in silico interaction networks (N = 10). (A2 and B2) eLSA-predicted network computed as described in “eLSA networks” in Materials and Methods. (A3 and B3) SparCC-predicted network computed as described in “SparCC networks” (color bar adjusted for visibility). (C and D) AUC values for the ensemble of nested (top row) and modular (bottom row) communities over three network sizes N = 10, 25, 50 (20 communities for each network size). Each plotted point corresponds to a unique in silico community. The dashed lines mark AUC = 1/2 and imply that the predicted network did no better than random guessing.
FIG 6
FIG 6
Examples of interaction networks characterized by nestedness (A) and modularity (B). The networks shown here have size N = 10 and fill F = 0.55 (A) and F = 0.5 (B). Within each network, rows represent microbe populations and columns represent virus populations, while navy squares indicate interaction (Mij = 1). Networks were generated as described in “Generating interaction networks and characterizing network structure” in Materials and Methods. Nestedness (NODF) and modularity (Qb) were measured with the BiMat package and are arranged in their most nested or most modular forms (48).

References

    1. Rohwer F, Thurber RV. 2009. Viruses manipulate the marine environment. Nature 459:207–212. doi:10.1038/nature08060. - DOI - PubMed
    1. McDaniel LD, Young E, Delaney J, Ruhnau F, Ritchie KB, Paul JH. 2010. High frequency of horizontal gene transfer in the oceans. Science 330:50. doi:10.1126/science.1192243. - DOI - PubMed
    1. Bidle KD, Vardi A. 2011. A chemical arms race at sea mediates algal host-virus interactions. Curr Opin Microbiol 14:449–457. doi:10.1016/j.mib.2011.07.013. - DOI - PubMed
    1. Lindell D, Sullivan MB, Johnson ZI, Tolonen AC, Rohwer F, Chisholm SW. 2004. Transfer of photosynthesis genes to and from Prochlorococcus viruses. Proc Natl Acad Sci U S A 101:11013–11018. doi:10.1073/pnas.0401526101. - DOI - PMC - PubMed
    1. Weitz JS, Wilhelm SW. 2012. Ocean viruses and their effects on microbial communities and biogeochemical cycles. F1000 Biol Rep 4:17. doi:10.3410/B4-17. - DOI - PMC - PubMed

LinkOut - more resources