. 2018:1:96.
doi: 10.1038/s42003-018-0099-2. Epub 2018 Jul 19.

Nav1.2 haplodeficiency in excitatory neurons causes absence-like seizures in mice

Affiliations

Nav1.2 haplodeficiency in excitatory neurons causes absence-like seizures in mice

Ikuo Ogiwara et al. Commun Biol. 2018.

Abstract

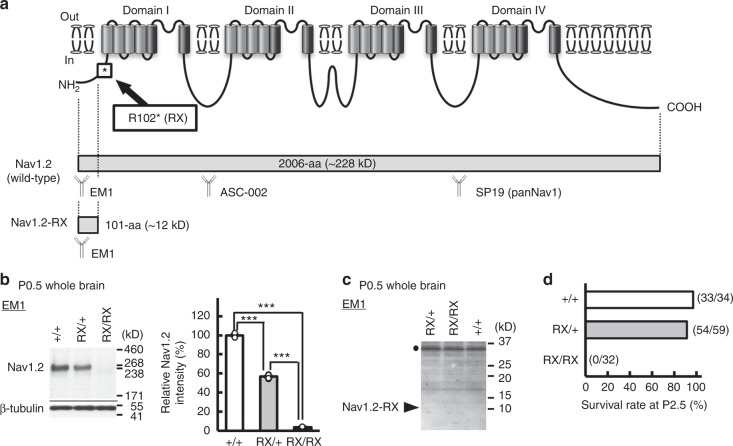
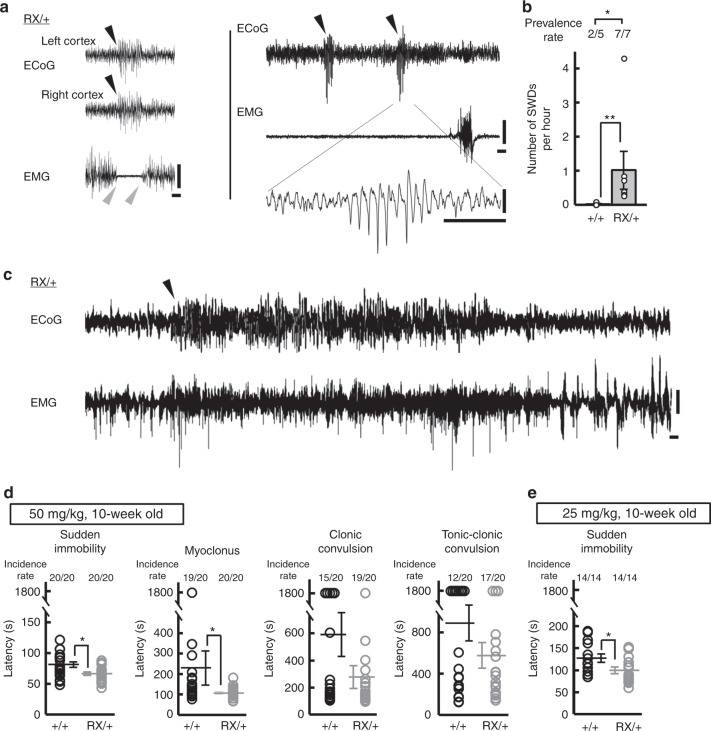
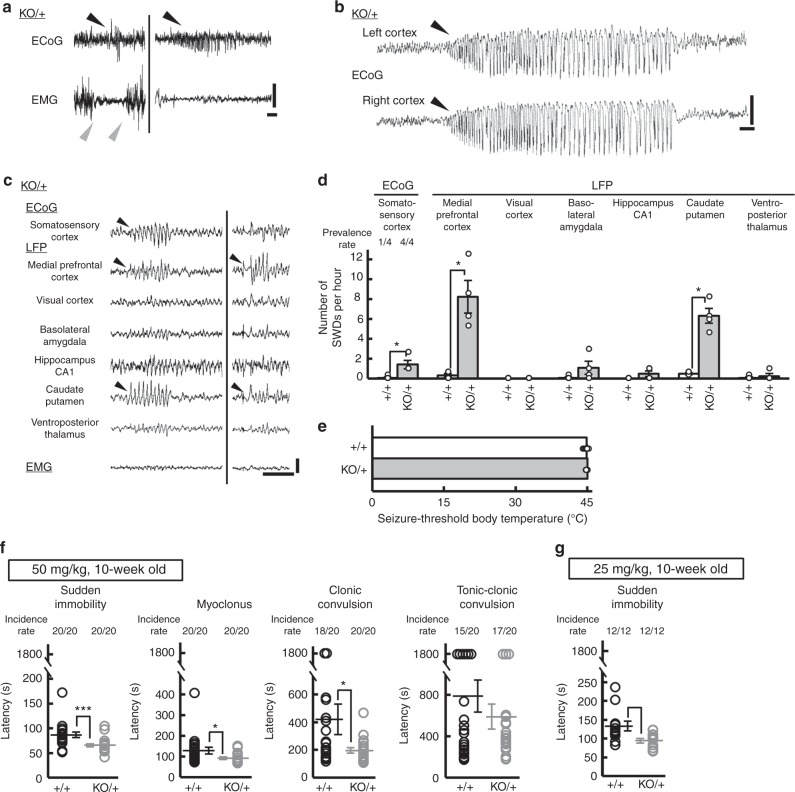
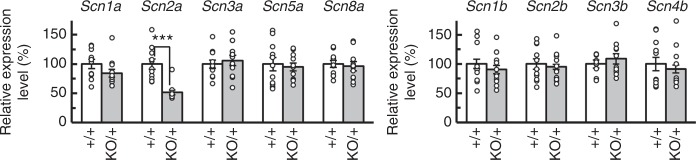
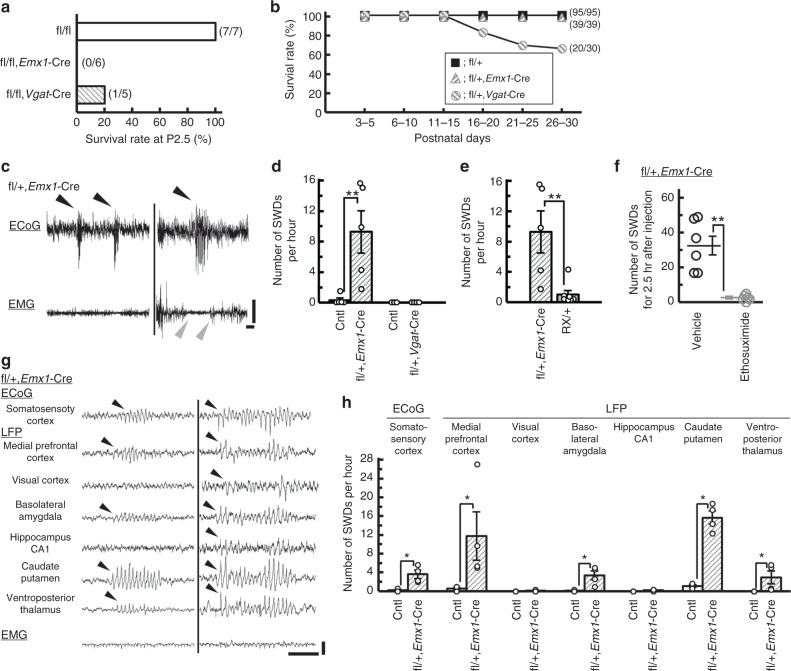
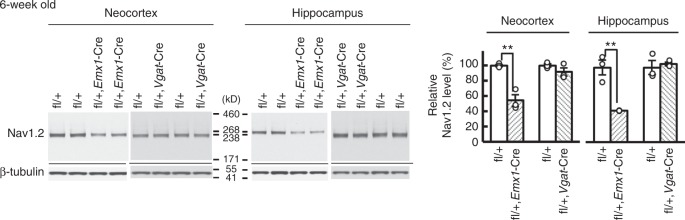
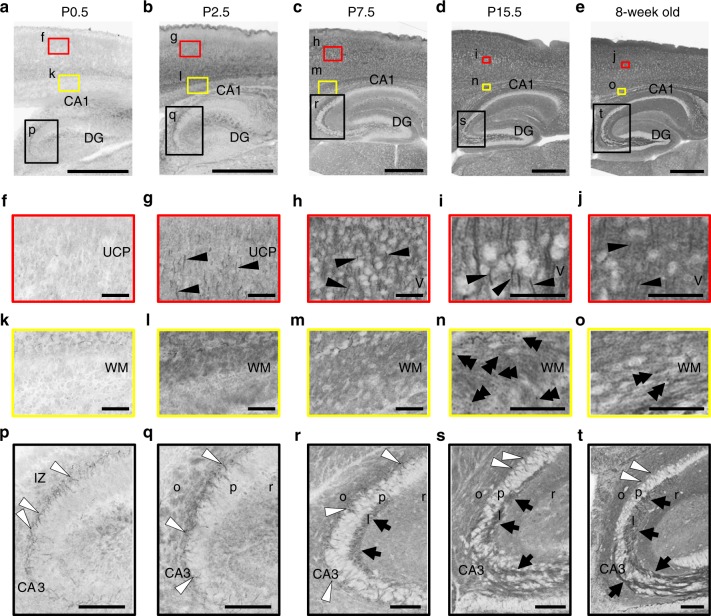
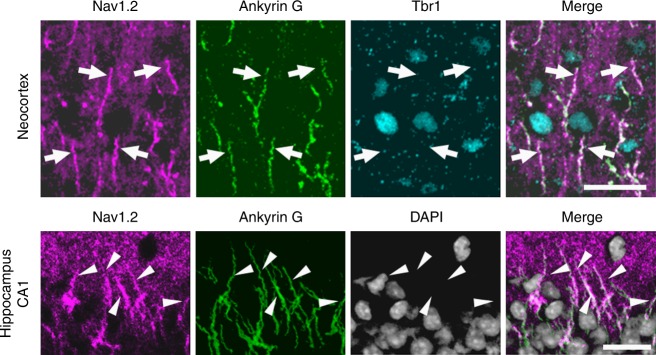
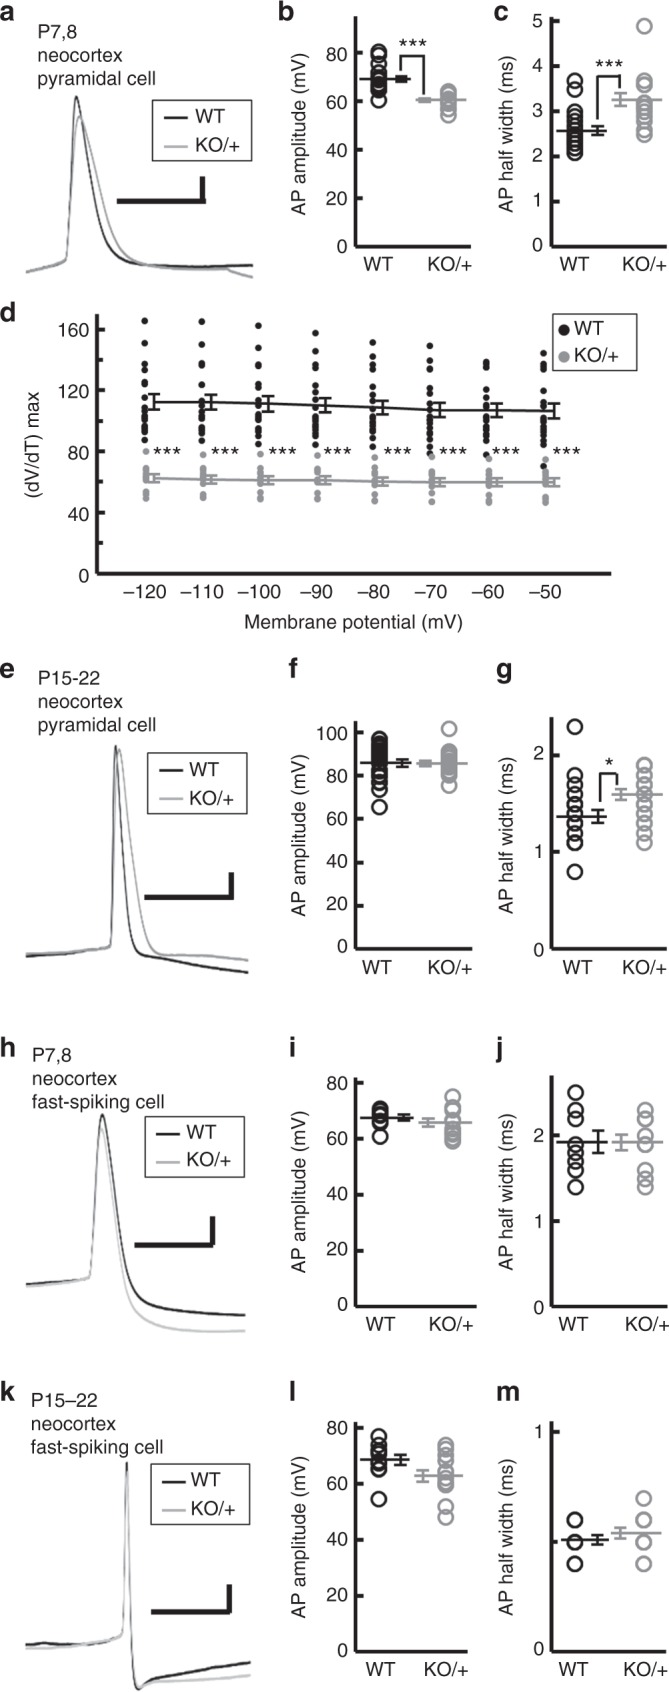
Mutations in the SCN2A gene encoding a voltage-gated sodium channel Nav1.2 are associated with epilepsies, intellectual disability, and autism. SCN2A gain-of-function mutations cause early-onset severe epilepsies, while loss-of-function mutations cause autism with milder and/or later-onset epilepsies. Here we show that both heterozygous Scn2a-knockout and knock-in mice harboring a patient-derived nonsense mutation exhibit ethosuximide-sensitive absence-like seizures associated with spike-and-wave discharges at adult stages. Unexpectedly, identical seizures are reproduced and even more prominent in mice with heterozygous Scn2a deletion specifically in dorsal-telencephalic (e.g., neocortical and hippocampal) excitatory neurons, but are undetected in mice with selective Scn2a deletion in inhibitory neurons. In adult cerebral cortex of wild-type mice, most Nav1.2 is expressed in excitatory neurons with a steady increase and redistribution from proximal (i.e., axon initial segments) to distal axons. These results indicate a pivotal role of Nav1.2 haplodeficiency in excitatory neurons in epilepsies of patients with SCN2A loss-of-function mutations.


Conflict of interest statement

Competing interests: The authors declare no competing interests.

Figures

Fig. 1
Fig. 1
A pathogenic Scn2a nonsense mutation inactivated the mutated allele. a Schematic of the voltage-gated sodium channel Nav1.2, showing the location of R102* (RX) nonsense mutation. Full-length wild type Nav1.2 is composed of 2006-amino acid (aa) residues with the predicted molecular weight of ~228 kD. The RX mutation can cause a truncated peptides, Nav1.2-RX, consisting of the first 101-aa residues of Nav1.2 with the theoretical molecular weight of ~12 kD. Epitope locations for the anti-Nav1.2 (EM-1, ASC-002) and anti-pan Nav1 (SP19) antibodies are indicated. b, c The RX allele was effectively inactivated in Scn2a knock-in mice. Western blot analyses of P0.5 whole brain membrane (b) and cytosolic (c) fractions were performed using EM-1. b Full-length Nav1.2 was moderate and negligible in Scn2aRX/+ (RX/+, N = 4) and Scn2aRX/RX (RX/RX, N = 3) mice, respectively, compared with that in Scn2a+/+ mice (+/+, N = 3) [one-way analysis of variance; genotype: F (2, 7) = 1737, ***P = 0.00000000036, Tukey’s test; Scn2a+/+ vs. Scn2aRX/+ ***P < 0.0001: Scn2a+/+ vs. Scn2aRX/RX, ***P < 0.0001: Scn2aRX/+ vs. Scn2aRX/RX, ***P < 0.0001]. Full-length Nav1.2 ran slower than its predicated molecular weight. Mean Nav1.2 signal intensities are represented as percentages relative to that of Scn2a+/+ littermates (100%). β-tubulin was used as internal control. c No bands appeared at expected size of ~12 kD (arrowhead) for Nav1.2-RX in any genotypes. The bands at ~36 kD (black dot) were non-specific. d Survival rates at P2.5 of Scn2a+/+ (N = 34), Scn2aRX/+ (N = 59) and Scn2aRX/RX mice (N = 32). All RX/RX mice died before P2.5. Data represent means ± SEM, ***P < 0.001
Fig. 2
Fig. 2
The pathogenic Scn2a nonsense mutation caused absence-like seizures with SWDs in mice. a Representative traces of somatosensory ECoG/EMG recordings in 6–11 weeks-old Scn2aRX/+ mice (N = 7). Behavioral arrest during waking state associated with ECoG epileptiform SWDs (left). Black arrowheads indicate the onset of SWD. Gray arrowheads indicate the onset and end of EMG suppression. Positivity was plotted up. b Frequencies of SWDs during a 24 h ECoG recording period in Scn2a+/+ (N = 5) and Scn2aRX/+ (N = 7) mice. c An episode of non-convulsive epileptiform discharges detected in 1 out of 7 Scn2aRX/+ mice. An arrowhead indicates the onset of epileptiform discharge. Positivity was plotted up. d, e Seizure susceptibility to PTZ in Scn2aRX/+ and Scn2a+/+ mice (10 weeks of age). The latencies to the first appearance of absence seizure-like sudden immobility, myoclonus, clonic convulsion and tonic-clonic convulsion after intraperitoneal administration of PTZ at dose of 50 (d, N = 20, each genotype) and 25 (e, N = 14, each genotype) mg per kg body weight. Scn2aRX/+ mice had significantly shorter latencies to absence-like sudden immobility (Mann-Whitney test, 50 mg per kg, sudden immobility, U = 106, *P = 0.0100, myoclonus, U = 116.5, *P = 0.0231, clonic convulsion, U = 162, P = 0.3098, tonic-clonic convulsion, U = 175, P = 0.5023; 25 mg per kg, sudden immobility, U = 53, *P = 0.0383). Data represent means ± SEM, *P < 0.05, **P < 0.01. Scale bars: a, c vertical 0.5 mV; horizontal 1 s
Fig. 3
Fig. 3
Heterozygous Scn2a knockout mice showed absence-like seizures with SWDs. a Representative traces of ECoG/EMG recordings from 10–27 weeks-old Scn2aKO/+ (KO/+) mice (N = 6). Black arrowheads indicate the onset of SWD. Gray arrowheads indicate the onset and end of EMG suppression. b A representative trace of prolonged non-convulsive seizure. ECoG recordings detected 2 episodes of prolonged non-convulsive seizure with duration of 30–45 s in 2 out of 6 Scn2aKO/+ mice, which were neither accompanied by convulsions, nor followed by post-ictal depression. c Representative ECoG/EMG/LFP recordings during an SWD episode in Scn2aKO/+ mice. Epileptiform discharges with large amplitudes are seen in mPFC and CPu. Positivity was plotted up (a, b, c). d Quantification of ECoG SWDs and LFP epileptiform discharges [3-hour recording, light period, Scn2a+/+, Scn2aKO/+ (N = 4, each genotype)]. Mann–Whitney test, medial prefrontal cortex: U = 0, *P = 0.0286; visual cortex: U = 8, P > 0.9999; basolateral amygdala: U = 3, P = 0.2571; hippocampus CA1: U = 4, P = 0.4286; caudate putamen: U = 0, *P = 0.0286; ventroposterior thalamus: U = 7.5, P > 0.9999. e Thresholds of body temperature for hyperthermia-induced seizures did not differ between Scn2aKO/+ and Scn2a+/+ mice (4-week-old, N = 10, each genotype) [unpaired t-test, t(18) = 1.149, P = 0.2658]. f, g Increased seizure susceptibility to PTZ in 10-week-old Scn2aKO/+ mice. Latencies to the first appearance of sudden immobility, myoclonus, clonic convulsion, and tonic-clonic convulsion after administrating of PTZ at doses of 50 (f, N = 20, each genotype) or 25 (g, N = 12, each genotype) mg per kg body weight. The latencies to the appearance of sudden immobility, myoclonus and clonic convulsion were shorter in Scn2aKO/+ than in Scn2a+/+ mice (Mann-Whitney test, 50 mg per kg, sudden immobility, U = 69.5, ***P = 0.0002, myoclonus, U = 110.5, *P = 0.0145, clonic convulsion, U = 119, *P = 0.0278, tonic-clonic convulsion, U = 188.5, P = 0.7624; 25 mg per kg, sudden immobility, U = 26.5, **P = 0.0071). Data represent means ± SEM, *P < 0.05, **P < 0.01, ***P < 0.001. Scale bars: (ac) vertical 0.5 mV; horizontal 1 s
Fig. 4
Fig. 4
Scn2a haplodeficiency did not alter expression levels of other sodium channel subunits. Quantitative RT-PCR analyses of brain mRNAs prepared from P14.5 Scn2a+/+ and Scn2aKO/+ mice (N = 11, each genotype). Scn2a mRNA expression in Scn2aKO/+ whole brain was reduced to about 50% level of that in Scn2a+/+ mice while there were no significant changes in Scn1a, Scn3a, Scn5a, Scn8a, Scn1b, Scn2b, Scn3b, and Scn4b mRNA expression levels in Scn2aKO/+, compared with those in Scn2a+/+ mice [unpaired t-test, Scn1a; t(20) = 1.461, P = 0.1595, Scn2a; t(20) = 5.250, ***P = 0.000039, Scn3a; t(20) = 0.5066, P = 0.6180, Scn5a; t(20) = 0.4223, P = 0.6773, Scn8a; t(20) = 0.3952, P = 0.6969, Scn1b; t(20) = 0.7407, P = 0.4675, Scn2b; t(20) = 0.4259, P = 0.6747, Scn3b; t(20) = 0.8664, P = 0.3965, Scn4b; t(20) = 0.5273, P = 0.6038]. White and gray bars represent Scn2a+/+ and Scn2aKO/+ mice, respectively. Data represent means ± SEM, ***P < 0.001
Fig. 5
Fig. 5
Scn2a deletion in dorsal telencephalic excitatory but not global inhibitory neurons triggered SWDs in mice. a Survival rates at P2.5 of Scn2afl/fl (N = 7), Scn2afl/fl/Emx1-Cre (N = 6) and Scn2afl/fl/Vgat-Cre mice (N = 5). All Scn2afl/fl/Emx1-Cre and all but one Scn2afl/fl/Vgat-Cre mice died before P2.5. One Scn2afl/fl/Vgat-Cre survivor died at P8.5. b Survival curves during P3–30 of Scn2afl/+/Emx1-Cre (N = 39), Scn2afl/+/Vgat-Cre (N = 30) and Scn2afl/+ mice (N = 95). About 30% of Scn2afl/+/Vgat-Cre mice suffered premature death between P16 and P25. c Representative ECoG/EMG traces in Scn2afl/+/Emx1-Cre mice. SWDs during waking were often associated with behavioral arrest (right). Black arrowheads indicate the onsets of SWDs. Gray arrowheads indicate the onset and end of behavioral arrest. d, e Frequencies of SWDs during 24 h ECoG recordings in Scn2afl/+/Emx1-Cre (N = 5) and littermate controls (Cntl) (2 Scn2afl/+, 3 Scn2a+/+/Emx1-Cre, N = 5), Scn2afl/+/Vgat-Cre (N = 4) and littermate Cntl (2 Scn2afl/+, 1 Scn2a+/+/Vgat-Cre, N = 3), and Scn2aRX/+ mice (N = 7). All recorded mice were over 8 weeks of age. f Ethosuximide (33.3 mg mL−1 in saline, 200 mg per kg, i.p.) efficiently suppressed SWDs in Scn2afl/+/Emx1-Cre mice (N = 6). g, h LFP recordings from 3–6-month-old Scn2afl/+/Emx1-Cre (N = 4) and littermate Cntl (2 Scn2a+/+, 2 Scn2afl/+, 3 Scn2a+/+/Emx1-Cre, N = 7). g Representative ECoG/EMG/LFPs traces in Scn2afl/+/Emx1-Cre mice. h Epileptiform discharges were predominantly detected in medial prefrontal cortex and caudate putamen of Scn2afl/+/Emx1-Cre mice (Mann–Whitney test, ECoG, somatosensory cortex: U = 0, *P = 0.0286; LFP, medial prefrontal cortex: U = 0, *P = 0.0286; visual cortex: U = 6, P > 0.999; basolateral amygdala: U = 0, *P = 0.0268; hippocampus CA1: U = 4, P = 0.4286; caudate putamen: U = 0, *P = 0.0268; ventroposterior thalamus: U = 0, *P = 0.0286). Data represent means ± SEM, *P < 0.05, **P < 0.01. Scale bars: (c, g) vertical 0.5 mV; horizontal 1 s
Fig. 6
Fig. 6
Scn2a haplodeficiency in dorsal telencephalic excitatory but in those in global inhibitory neurons reduced neocortical and hippocampal Nav1.2 expression levels. Western blot analyses of 6-weeks neocortex or hippocampus for Scn2afl/+/Emx1-Cre, Scn2afl/+/Vgat-Cre and Scn2afl/+ controls (N = 3, each genotype). Unpaired t-test, Scn2afl/+ vs. Scn2afl/+/Emx1-Cre, neocortex: t(4) = 5.91, **P = 0.0041; hippocampus: t(4) = 5.74, **P = 0.0046; Scn2afl/+ vs. Scn2afl/+/Vgat-Cre, neocortex: t(4) = 1.413, P = 0.2305; hippocampus: t(4) = 0.489, P = 0.6503. Nav1.2 protein was normalized by β-tubulin. Mean Nav1.2 expression levels are represented as percentages relative to the level of Scn2afl/+ control littermates (100%). Data represent means ± SEM, **P < 0.01
Fig. 7
Fig. 7
Developmental changes of Nav1.2 distribution in mouse brain. Brain sections of wild-type mice at P0.5 (a, f, k, p), P2.5 (b, g, l, q), P7.5 (c, h, m, r), P15.5 (d, i, n, s), and 8-week-old (e, j, o, t) were stained with anti-Nav1.2 (G-20, red). Higher-magnified images outlined in ae are shown in ft. Nav1.2 immunoreactivities were observed at AISs of neocortical neurons (single black arrowheads), nodes of Ranvier within white matter (double black arrowheads), AISs of hippocampal pyramidal neurons (white arrowheads), mossy fibers of dentate granule cells (black arrows), etc. Note that, while Nav1.2 at AISs and nodes of Ranvier peaked at P15.5 and became less at 8-weeks, diffused Nav1.2 signals in neocortex continued to become dense until 8-weeks-old. The brain slices were processed in parallel. Representative images of four or more slices per stage are shown. MZ marginal zone, UCP upper cortical plate, LCP lower cortical plate, DG dentate gyrus, WM white matter, IZ intermediate zone, o stratum oriens, p stratum pyramidale, l stratum lucidum, r stratum radiatum. Scale bars: ae 500 µm; fo 50 µm; pt 100 µm
Fig. 8
Fig. 8
Nav1.2 expressions at AISs of excitatory neurons in neocortex and hippocampus. Immunofluorescence histochemistry of P15.5 wild-type neocortices and hippocampi stained with anti-Nav1.2 (G-20, magenta), anti-ankyrin G (green), and anti-Tbr1 (cyan) antibodies, and counterstained with 4′-6-diamidino-2-phenylindole (DAPI, gray) and their merged images. Arrows indicate Nav1.2 and ankyrin G-double immunoreactive AISs of Tbr1-expressing neocortical pyramidal cells. Arrowheads indicate Nav1.2 and ankyrin G-double immunoreactive AISs of hippocampal pyramidal cells. Representative images of four or more slices are shown. o stratum oriens, p stratum pyramidale. Scale bars: 20 µm
Fig. 9
Fig. 9
Altered action potentials of Scn2a KO excitatory neurons. Responses of neocortical pyramidal excitatory neurons and fast-spiking inhibitory neurons from Vgat-Venus/Scn2a+/+ (WT) mice (n = 19 pyramidal and 8 fast-spiking neurons, P7–8; n = 22 pyramidal and 11 fast-spiking neurons, P15–22) and Vgat-Venus/Scn2aKO/+ (KO/ + ) mice (n = 16 pyramidal and 11 fast-spiking neurons, P7–8; n = 22 pyramidal and 13 fast-spiking neurons, P15–22) to current injections. Representative action potential traces (a, e, h, k), peak amplitudes (b, f, i, l), half widths (c, g, j, m) and maximum rates of rise (d) were shown. bg Peak amplitudes of P7–8 pyramidal cells are smaller in Scn2aKO/+ than in WT mice, while half widths of P7–8 and P15–22 pyramidal cells were broader in Scn2aKO/+ than in WT mice. Unpaired t-test, peak amplitudes, P7–8, t(33) = 6.0638, ***P = 0.0000008, P15–22, t(42) = 0.0791, P = 0.9373; half widths, P7–8, t(33) = −4.0342, ***P = 0.00031, P15–22, t(42) = −3.6442, *P = 0.0109. d Maximum rates of rise for action potential of P7–8 hippocampal pyramidal cells (n = 19 WT neurons, n = 11 KO/ + neurons) were lower in Scn2aKO/+ than in WT mice. Unpaired t-test, −120mV, t(28) = 7.3005, ***P = 0.00000006, −110mV, t(28) = 7.3572, ***P = 0.00000005, −100mV, t(28) = 7.3237, ***P = 0.00000006, −90mV, t(28) = 7.4814, ***P = 0.00000004, −80mV, t(28) = 7.6586, ***P = 0.00000002, −70mV, t(28) = 7.2738, ***P = 0.00000006, −60mV, t(28) = 7.8954, ***P = 0.00000001, −50mV, t(27) = 7.1199, ***P = 0.00000012. There were no significant differences between WT and Scn2aKO/+ fast-spiking neurons. Unpaired t-test, peak amplitudes, P7–8, t(17) = 0.8793, P = 0.3915, P15–22, t(22) = 2.0676, P = 0.0506; half widths, P7–8, t(17) = 0.0435, P = 0.9658, P15–22, t(22) = −0.8992, P = 0.3783. Details of the results and statistical tests are reported in Supplementary Tables 1 and 2. Black filled circles and gray filled circles represent WT and Scn2aKO/+ neurons, respectively. Data represent means ± SEM, *P < 0.01, ***P < 0.001. Scale bars: (a, e, h, k) vertical 10 mV; horizontal 10 milliseconds

Similar articles

Cited by

References

    1. Sugawara T, et al. A missense mutation of the Na+ channel aII subunit gene Nav1.2 in a patient with febrile and afebrile seizures causes channel dysfunction. Proceedings of the National Academy of Science USA. 2001;98:6384–6389. doi: 10.1073/pnas.111065098. - DOI - PMC - PubMed
    1. Heron SE, et al. Sodium-channel defects in benign familial neonatal-infantile seizures. Lancet. 2002;360:851–852. doi: 10.1016/S0140-6736(02)09968-3. - DOI - PubMed
    1. Berkovic SF, et al. Benign familial neonatal-infantile seizures: characterization of a new sodium channelopathy. Annals of Neurology. 2004;55:550–557. doi: 10.1002/ana.20029. - DOI - PubMed
    1. Kamiya K, et al. A nonsense mutation of the sodium channel gene SCN2A in a patient with intractable epilepsy and mental decline. The Journal of Neuroscience. 2004;24:2690–2698. doi: 10.1523/JNEUROSCI.3089-03.2004. - DOI - PMC - PubMed
    1. Ogiwara I, et al. De novo mutations of voltage-gated sodium channel alphaII gene SCN2A in intractable epilepsies. Neurology. 2009;73:1046–1053. doi: 10.1212/WNL.0b013e3181b9cebc. - DOI - PMC - PubMed

LinkOut - more resources