Review
. 2018 Aug;24(4):406-419.
doi: 10.1017/S1431927618012382.

Biological Applications at the Cutting Edge of Cryo-Electron Microscopy

Affiliations
Review

Biological Applications at the Cutting Edge of Cryo-Electron Microscopy

Rebecca S Dillard et al. Microsc Microanal. 2018 Aug.

Abstract

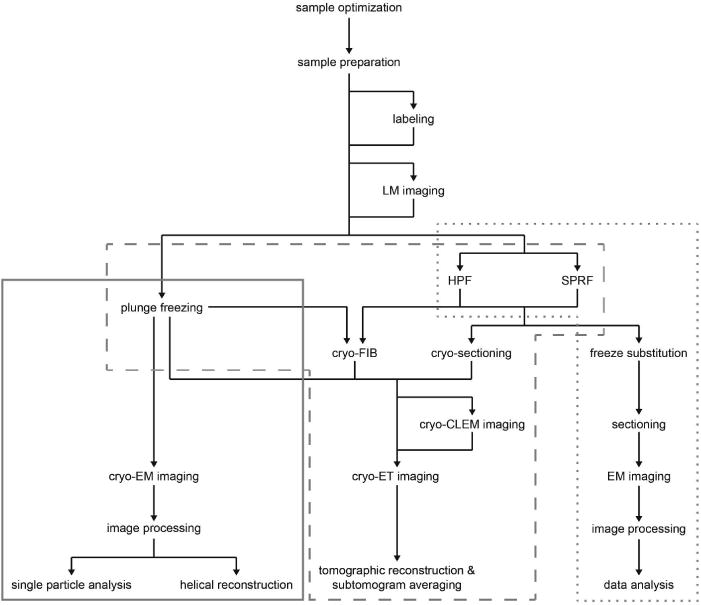
Cryo-electron microscopy (cryo-EM) is a powerful tool for macromolecular to near-atomic resolution structure determination in the biological sciences. The specimen is maintained in a near-native environment within a thin film of vitreous ice and imaged in a transmission electron microscope. The images can then be processed by a number of computational methods to produce three-dimensional information. Recent advances in sample preparation, imaging, and data processing have led to tremendous growth in the field of cryo-EM by providing higher resolution structures and the ability to investigate macromolecules within the context of the cell. Here, we review developments in sample preparation methods and substrates, detectors, phase plates, and cryo-correlative light and electron microscopy that have contributed to this expansion. We also have included specific biological applications.

Keywords: cryo-correlative light and electron microscopy (cryo-CLEM); cryo-electron microscopy (cryo-EM); cryo-electron tomography (cryo-ET); direct electron detectors; phase plates; transmission electron microscopy (TEM); vitrification.


Figures

Figure 1
Figure 1. Cryo-EM workflow
Schematic illustration of options for cryo-EM sample preparation, imaging, and data processing. Solid gray box indicates methods typically used for single particle analysis; dashed gray box indicates methods typically used for cryo-ET; dotted gray box indicates methods typically used for conventional EM sectioning. LM, light microscopy; HPF, high pressure freezing; SPRF, self-pressurized rapid freezing; FIB, focused ion beam; CLEM, correlated light and electron microscopy; EM, electron microscopy.
Figure 2
Figure 2. Affinity grid designed to selectively capture virus-like particles (VLPs)
Cryo-EM images of HIV CD84 VLPs applied to an untreated grid (A) and a 20% Ni-NTA cryo-affinity grid with His-tagged Protein A and anti-Env polyclonal antibody (B). Use of the affinity capture method leads to increased VLP concentration and improved particle distribution on the grid. See Kiss et al. (Kiss, et al., 2014) for experimental detail. Scale bars, 1 μm.
Figure 3
Figure 3. Motion correction of data recorded on a Direct Electron DE-20 direct electron detection device significantly improves image quality
2D projection cryo-EM image of coliphage BA14 particles before (A) and after (B) motion correction using Direct Electron, LP scripts and the corresponding power spectra (insets). The image was recorded at a frame rate of 12 frames per second with an exposure time of 5 seconds. Scale bars, 50 nm.
Figure 4
Figure 4. Zernike phase plate imaging of a phage-lysed bacterial cell provides contrast, revealing internal features
Cryo-ET slices of ϕCbK phage-lysed Caulobacter crescentus cell using ZPC at zero defocus. (A) A top slice of the tomogram illustrating the hexagonal surface layer (SL), (B) a central slice revealing newly assembled phages within the lysing cell, and (C) a central slice showing an assembled phage capsid in the process of genome packaging. Fringing artifacts are evident, particularly at the edge of the cell. (D) Corresponding 3D segmentation showing surface layer, SL, green; outer membrane, OM, gold; inner membrane, IM, red; and ϕCbK, magenta. Scale bars, 200 nm.
Figure 5
Figure 5. Hole-free phase plate (HFPP) imaging provides enhanced contrast without strong fringing artifacts
Cryo-EM images of reovirus T1L particles using HFPP slightly underfocus. (A and B) reovirus T1L particles displaying attachment fibers as indicated by white arrowheads. The black arrow points to a released viral genome in (B). Scale bars, 50 nm.
Figure 6
Figure 6. CLEM imaging of transfected mammalian cells provides multi-scale information
HT1080 cells grown on a gold London Finder grid and transfected with EGFP-tetherin (green) and mCherry-Gag (red) were imaged by live cell fluorescence microscopy (A and B), then plunge frozen and imaged by cryo-EM montaging (C and D), and cryo-ET (E and F). The mCherry-Gag (red) signal in (A) and (B) corresponds to electron density of a thin cellular extension in (C) and (D). The black arrowheads in (E) and (F) indicate a tether attaching 2 VLPs. Dashed boxes correspond to the enlarged image in the next panel. Adapted from Strauss et al. (Strauss, et al., 2016). Scale bars, (A and B) 25 μm, (C) 10 μm, (D) 500 nm, (E) 100 nm, and (F) 50 nm.
Figure 7
Figure 7. Cryo-CLEM imaging of transfected mammalian cells
HT1080 cells transfected with EGFP-tetherin (green) and mCherry-Gag (red) imaged by cryo-fluorescence microscopy (A), cryo-EM montaging (B), and cryo-ET (C). Dashed boxes correspond to the enlarged image in the next panel. The yellow signal in (A) (inset) indicates colocalization of EGFP-tetherin (green) and mCherry-Gag (red) signal and corresponds to a cluster of HIV-1 VLPs tethered to a cellular extension in (B) and (C). Adapted from Hampton et al. (Hampton, et al., 2017). Scale bars, (A) 50 μm, inset is 3X, (B) 2 μm, (C) 200 nm.

References

    1. Adrian M, Dubochet J, Lepault J, McDowall AW. Cryo-electron microscopy of viruses. Nature. 1984;308(5954):32–36. - PubMed
    1. Agafonov DE, Kastner B, Dybkov O, Hofele RV, Liu WT, Urlaub H, Luhrmann R, Stark H. Molecular architecture of the human U4/U6.U5 tri-snRNP. Science. 2016;351(6280):1416–1420. - PubMed
    1. Agronskaia AV, Valentijn JA, van Driel LF, Schneijdenberg CT, Humbel BM, van Bergen en Henegouwen PM, Verklejj AJ, Koster AJ, Gerritsen HC. Integrated fluorescence and transmission electron microscopy. J Struct Biol. 2008;164(2):183–189. - PubMed
    1. Al-Amoudi A, Chang JJ, Leforestier A, McDowall A, Salamin LM, Norlen LP, Richter K, Blanc NS, Studer D, Dubochet J. Cryo-electron microscopy of vitreous sections. EMBO J. 2004;23(18):3583–3588. - PMC - PubMed
    1. Althoff T, Mills DJ, Popot J-L, Kühlbrandt W. Arrangement of electron transport chain components in bovine mitochondrial supercomplex I(1)III(2)IV(1) EMBO J. 2011;30(22):4652–4664. - PMC - PubMed

Publication types

MeSH terms

Substances