. 2018 Sep 3:7:e36520.
doi: 10.7554/eLife.36520.

In vivo detection of optically-evoked opioid peptide release

Affiliations

In vivo detection of optically-evoked opioid peptide release

Ream Al-Hasani et al. Elife. .

Abstract

Though the last decade has seen accelerated advances in techniques and technologies to perturb neuronal circuitry in the brain, we are still poorly equipped to adequately dissect endogenous peptide release in vivo. To this end we developed a system that combines in vivo optogenetics with microdialysis and a highly sensitive mass spectrometry-based assay to measure opioid peptide release in freely moving rodents.

Keywords: mass spectrometry; microdialysis; mouse; neuroscience; nucleus accembens; opioids peptides; optogenetics.


Conflict of interest statement

RA, JW, OM, JM, GS, KP, BA, RK No competing interests declared, MB Co-founder of Neurolux, Inc, a company that is making wireless optogenetic probes. None of the work in this manuscript used these devices or is related to any of the company's activities, but we list this information here in full disclosure

Figures

Figure 1.
Figure 1.. Optimization of opioid peptide detection parameters.
(a) Chemical structures of Dynorphin A 1–8, Met-Enkephalin and Leu-Enkephalin (b) Isotopically labeled dynorphin as an internal standard for quantitative analysis. High concentration injections of DYN* did not show significant traces of endogenous dyn (inset trace). A 500 pM sample of DYN* was injected while monitoring both the endogenous dyn (491 → 435 m/z) and isotopically labeled DYN* (495 → 438 m/z) mass-to-charge transitions. (c) Nano LC-MS chromatograms of 100 pM standards. Reconstructed ion chromatogram of ME, dyn, DYN*, and LE. (d) Addition of isotopically labeled DYN* results in better quantification of dyn A1-8, (e) Leu-Enkephalin and (f) Met-Enkephalin. (g–j) No effect of ionization suppression from the matrix, as shown for DYN*, Dyn A1-8, Leu-Enkephalin and Met-Enkephalin, respectively. Bulk dialysate was collected and spiked with known amounts of standard. This resulted in a linear response that corresponded with the signal increase from the original sample analyte plus the additional analyte, showing no effect of ionization suppression from the matrix. Four replicates per sample; data shown as average ± SD.
Figure 2.
Figure 2.. Design and function of opto-dialysis probe.
(a) Images of the optodialysis probe. (b) Trace of an in vitro step change from 100 pM of DYN, LE, and ME stock solution to a solution of 1 nM Dyn and 400 pM LE and ME. The arrow indicates the first fraction in which the peptide was expected to change. Data were normalized to fraction 4, the fraction expected to reflect elevated concentration stock change. Data shown as average ± SD, n = 4 probes.
Figure 2—figure supplement 1.
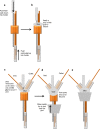
Figure 2—figure supplement 1.. Step-by-step illustration of the custom-made integrated optogenetic-dialysis probes measure peptides and small molecules in freely moving animals.
Also see supplementary file 1.
Figure 3.
Figure 3.. In vivo changes in opioid peptide release following photostimulation of dynorphin cells.
(a) Timeline of experimental procedure outlining viral injection, probe implantation and dialysate collection. (b) Extracellular opioid peptide release shown as % baseline in vNAcSh dyn1-8, (left panel, n = 8), dNAcSh dyn1-8 (right panel, n = 6). (c) vNAcSh Leu-Enkephalin (left panel, n = 4), dNAcSh Leu-Enkephalin (right panel, n = 6). (d) vNAcSh Met-Enkephalin (left panel, n = 7) and dNAcSh Met-Enkephalin (right panel, n = 7). (e) Small molecules simultaneously collected and shown as % baseline in vNAcSh Dopamine (left panel, n = 7), dNAcSh Dopamine (right panel, n = 7).
Figure 3—figure supplement 1.
Figure 3—figure supplement 1.. In vivo K + depolarization.
Reliable depolarisation following K + was detected for (a) vNAcSh dyn1-8, (left panel, n = 8), dNAcSh dyn1-8 (right panel, n = 6). (b) vNAcSh Leu-Enkephalin (left panel, n = 4), dNAcSh Leu-Enkephalin (right panel, n = 6). (c) vNAcSh Met-Enkephalin (left panel, n = 7) and dNAcSh Met-Enkephalin (right panel, n = 7). Data show as mean ± SEM.
Figure 3—figure supplement 2.
Figure 3—figure supplement 2.. Hits maps showing placement of opto-dialysis probes (a) vNAcSh, closed purple circles represent correct hits, open circles represent misses.
(b) dNAcSh, closed green circles represent correct hits, open circles represent misses.
Figure 3—figure supplement 3.
Figure 3—figure supplement 3.. Small molecules simultaneously collected and shown as % baseline in (a) vNAcSh GABA (left panel, n = 6), dNAcSh GABA (right panel, n = 6).
(b) vNAcSh Glutamate (left panel, n = 7) and dNAcSh Glutamate (right panel, n = 7).
Author response image 1.

References

    1. Al-Hasani R, McCall JG, Shin G, Gomez AM, Schmitz GP, Bernardi JM, Pyo CO, Park SI, Marcinkiewcz CM, Crowley NA, Krashes MJ, Lowell BB, Kash TL, Rogers JA, Bruchas MR. Distinct subpopulations of nucleus accumbens dynorphin neurons drive aversion and reward. Neuron. 2015;87:1063–1077. doi: 10.1016/j.neuron.2015.08.019. - DOI - PMC - PubMed
    1. Bals-Kubik R, Ableitner A, Herz A, Shippenberg TS. Neuroanatomical sites mediating the motivational effects of opioids as mapped by the conditioned place preference paradigm in rats. The Journal of Pharmacology and Experimental Therapeutics. 1993;264:489–495. - PubMed
    1. Bruijnzeel AW. kappa-Opioid receptor signaling and brain reward function. Brain Research Reviews. 2009;62:127–146. doi: 10.1016/j.brainresrev.2009.09.008. - DOI - PMC - PubMed
    1. Castro DC, Berridge KC. Opioid hedonic hotspot in nucleus accumbens shell: mu, Delta, and kappa maps for enhancement of sweetness "liking" and "wanting". Journal of Neuroscience. 2014;34:4239–4250. doi: 10.1523/JNEUROSCI.4458-13.2014. - DOI - PMC - PubMed
    1. DiFeliceantonio AG, Mabrouk OS, Kennedy RT, Berridge KC. Enkephalin surges in dorsal neostriatum as a signal to eat. Current Biology. 2012;22:1918–1924. doi: 10.1016/j.cub.2012.08.014. - DOI - PMC - PubMed

Publication types

Substances

LinkOut - more resources