. 2019 Feb;15(2):259-279.
doi: 10.1080/15548627.2018.1515609. Epub 2018 Sep 25.

Parallel damage in mitochondria and lysosomes is an efficient way to photoinduce cell death

Affiliations

Parallel damage in mitochondria and lysosomes is an efficient way to photoinduce cell death

Waleska K Martins et al. Autophagy. 2019 Feb.

Abstract

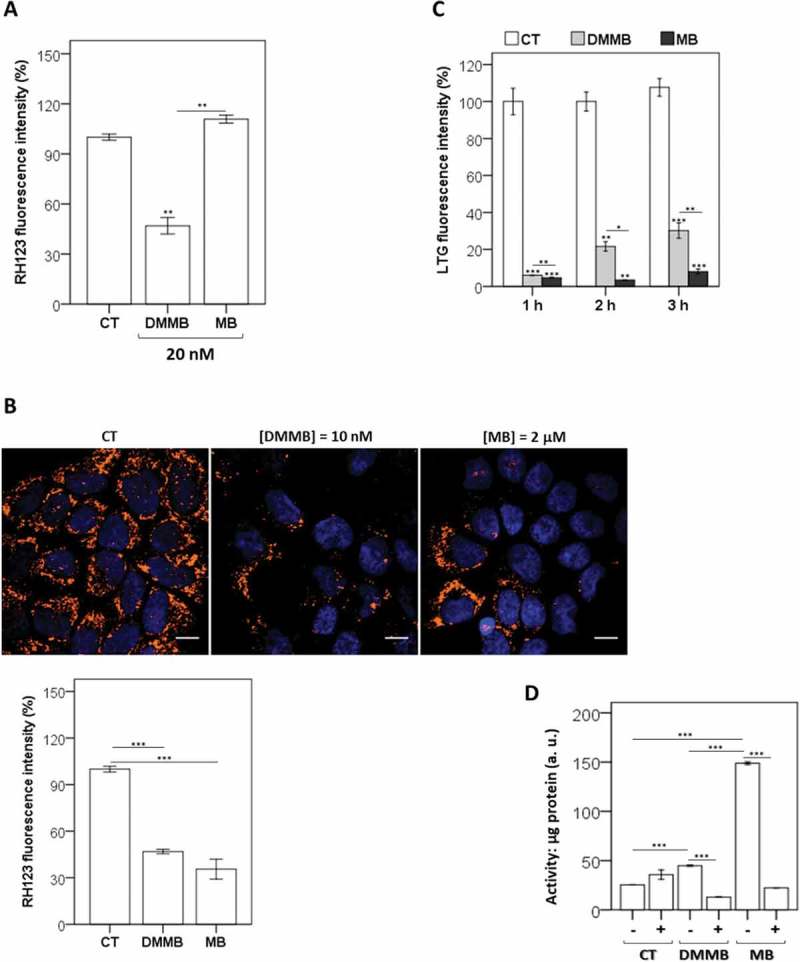
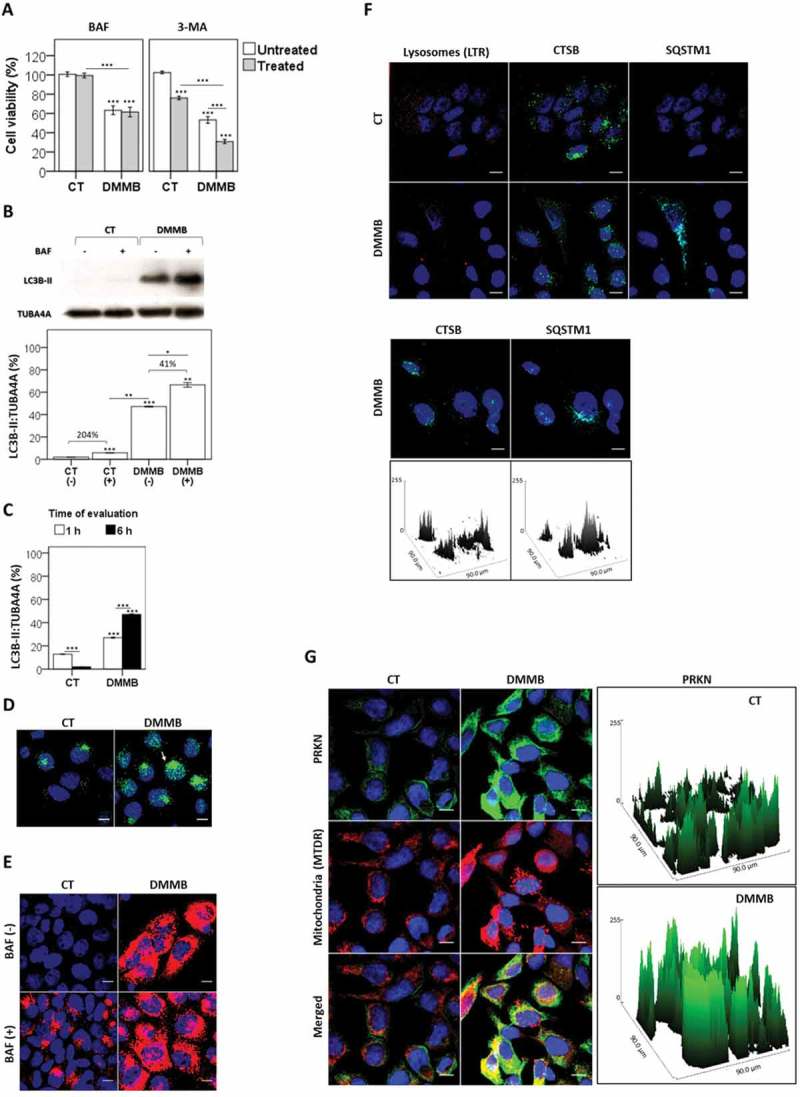
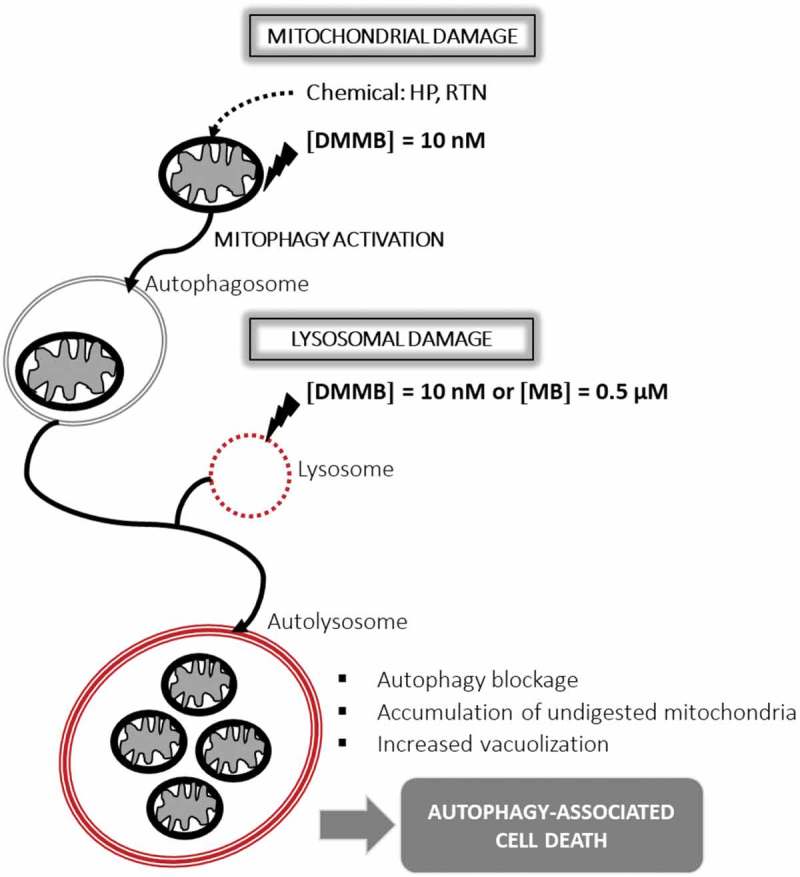
Cells challenged by photosensitized oxidations face strong redox stresses and rely on autophagy to either survive or die. However, the use of macroautophagy/autophagy to improve the efficiency of photosensitizers, in terms of inducing cell death, remains unexplored. Here, we addressed the concept that a parallel damage in the membranes of mitochondria and lysosomes leads to a scenario of autophagy malfunction that can greatly improve the efficiency of the photosensitizer to cause cell death. Specific damage to these organelles was induced by irradiation of cells pretreated with 2 phenothiazinium salts, methylene blue (MB) and 1,9-dimethyl methylene blue (DMMB). At a low concentration level (10 nM), only DMMB could induce mitochondrial damage, leading to mitophagy activation, which did not progress to completion because of the parallel damage in lysosome, triggering cell death. MB-induced photodamage was perceived almost instantaneously after irradiation, in response to a massive and nonspecific oxidative stress at a higher concentration range (2 µM). We showed that the parallel damage in mitochondria and lysosomes activates and inhibits mitophagy, leading to a late and more efficient cell death, offering significant advantage (2 orders of magnitude) over photosensitizers that cause unspecific oxidative stress. We are confident that this concept can be used to develop better light-activated drugs. Abbreviations: ΔΨm: mitochondrial transmembrane inner potential; AAU: autophagy arbitrary units; ATG5, autophagy related 5; ATG7: autophagy related 7; BAF: bafilomycin A1; BSA: bovine serum albumin; CASP3: caspase 3; CF: carboxyfluorescein; CTSB: cathepsin B; CVS: crystal violet staining; DCF: dichlorofluorescein; DCFH2: 2',7'-dichlorodihydrofluorescein; DMMB: 1,9-dimethyl methylene blue; ER: endoplasmic reticulum; HaCaT: non-malignant immortal keratinocyte cell line from adult human skin; HP: hydrogen peroxide; LC3B-II: microtubule associated protein 1 light chain 3 beta-II; LMP: lysosomal membrane permeabilization; LTG: LysoTracker™ Green DND-26; LTR: LysoTracker™ Red DND-99; 3-MA: 3-methyladenine; MB: methylene blue; mtDNA: mitochondrial DNA; MitoSOX™: red mitochondrial superoxide probe; MTDR: MitoTracker™ Deep Red FM; MTO: MitoTracker™ Orange CMTMRos; MT-ND1: mitochondrially encoded NADH:ubiquinone oxidoreductase core subunit 1; MTT: methylthiazolyldiphenyl-tetrazolium bromide; 1O2: singlet oxygen; OH. hydroxil radical; PRKN/parkin: parkin RBR E3 ubiquitin protein ligase; PBS: phosphate-buffered saline; PI: propidium iodide; PDT: photodynamic therapy; PS: photosensitizer; QPCR: gene-specific quantitative PCR-based; Rh123: rhodamine 123; ROS: reactive oxygen species RTN: rotenone; SQSTM1/p62: sequestosome 1; SUVs: small unilamellar vesicles; TBS: Tris-buffered saline.

Keywords: Cell death; membrane damage; methylene blue; mitophagy; phenothiazines; photodynamic efficiency.


Figures

Figure 1.
Figure 1.
The capability of interacting and damage membranes. (a) Chemical structure of MB and DMMB cations. (b) Simplified Jablonski diagram of photosensitization. At right, table with relevant properties: 1O2 and log Po/w. (c) Membrane permeabilization assay using DOPC:CL liposomes (15% CL) with entrapped CF. Samples contained 15 μM MB or DMMB and were irradiated with a 631 nm LED, with 72 W m−2 irradiance. The average emission intensity at 517 nm (excitation at 480 nm, for CF fluorescence), accompanied by standard deviation, is plotted as a function of irradiation time. (d) Colocalization of DMMB and MB with mitochondria stained by Rh123. At the indicated concentrations, DMMB and MB accumulated at same level in mitochondria (33.4 ± 11% and 44.5 ± 4%), respectively. Scales bar MB (0.2 µM): 20 µm; MB (2 µM) or DMMB (0.2 µM): 10 µm.
Figure 2.
Figure 2.
Analysis of biological effects after irradiation using HaCaT cells. (a) Cellular survival 48 h after irradiation with a 633 nm LED (46 W m−2 irradiance) as a function of DMMB and MB concentrations, as measured by CVS and MTT assays. (b) DCFH oxidation 3 h after irradiation using DMMB and MB as indicated. (c) DCFH oxidation and cell survival measured by CVS assay 3 h after irradiation using DMMB (0 to 20 nM) and MB (0 to 3 µM). (d) Analysis of amplified long mitochondrial DNA target (mtDNA) and short mtDNA target (MT-ND1) after photosensitization of HaCaT cells preloaded with 20 nM DMMB and MB. Relative amplification was determined by the ratio between long mitochondrial DNA target (mtDNA) and short mtDNA target (MT-ND1). Mean ± standard error of 3 independent experiments are shown. The significance levels are indicated as *0.05, **< 0.01, ***< 0.001.
Figure 3.
Figure 3.
Analysis of biological effects after irradiation using HaCaT cells. (a) Mitochondrial inner transmembrane potential (ΔΨm), measured by Rh123 fluorescence intensity relative to control (100%), using cytofluorometric analysis 30 min after photosensitization with DMMB and MB (20 nM). (b) ΔΨm determined by fluorescence microscopy and cytofluorometric analysis after photosensitization with DMMB (10 nM) and MB (2 µM). The decrease in ΔΨm was measured in terms of Rh123 fluorescence intensity relative to control (100%). All next analyses were performed in HaCaT cells pretreated with DMMB (10 nM) and MB (2 µM) and irradiated with a 633 nm LED (46 W m−2 irradiance), as done for control cells without photosensitizer. (c) After the indicated times, cytofluorometric analysis of cells stained with LysoTracker™ Green DND-26 (LTG). The decrease in lysosomal stability was measured in terms of LTG fluorescence intensity relative to control (100%). (d) 3 h after irradiation, the CTSB activity from cytosol fraction was measured in presence (+) or absence (-) of CA-074 (10 µM). Mean ± standard error of 3 independent experiments are shown. The significance levels were indicated as *< 0.05, **< 0.01, ***< 0.001. Scale bars: 10 µm.
Figure 4.
Figure 4.
Cell death efficiency and organelle specific photodamage. All analyses were performed in HaCaT cells pretreated with DMMB (10 nM) and MB (2 µM) and irradiated with a 633 nm LED (46 W m−2 irradiance), as done for control cells without photosensitizer. (a) FACS scatter plots gating cells according to 2 parameters (ΔΨm and cell death), for cells stained with Rhodamine 123 (Rh123) and PI right after irradiation. Right: bars show the mean values of cell subpopulations. (b) FACS scatter plots gating cells according to 2 parameters (LMP and cell death), for cells stained with LysoTracker™ Green DND-26 (LTG) and PI right after irradiation. Right: bars show the mean values of cell subpopulations. (c) Fluorometric analysis of CASP3 activity from cytosol fraction 1, 3, 5, and 24 h after irradiation. The CASP3 activity was compared to a control following normalization by total protein concentration and expressed as arbitrary units (a. u.). Mean ± standard error of 3 independent experiments are shown. The significance levels were indicated as *< 0.05, **< 0.01, ***< 0.001.
Figure 5.
Figure 5.
Long-term evaluation of cell death. For analysis performed in A to D, HaCaT cells were pretreated with DMMB (10 nM) and MB (2 µM) and irradiated with a 633 nm LED (46 W m−2 irradiance), as done for control cells without photosensitizer. (a) Cytometry analysis for cells stained with PI 24 h and 48 h after irradiation. Bars show the ponderation of PI fluorescence compared to control and are represented as arbitrary units. (b). Fluorescence microscopy images for cells stained with acridine orange 48 h after irradiation. (c) Fluorescence microscopy images for cells double-stained with LysoTracker™ Red DND-99 (lysosomes, red) and MitoTracker™ Deep Red FM (mitochondrial mass, green) 24 h after irradiation. Below: profile plots showing colocalization of mitochondria and lysosome staining. Right: surface plots of mitochondria and lysosome staining. (d) Fluorescence microscopy images for cells double-stained with LysoTracker™ Red DND-99 (lysosomes, red) 120 h after irradiation. (e) MTT response and lysosomal accumulation determined by AAU 48 h after irradiation. For the human tumor cells HepG2, SKMEL-25 2 µM MB and 10 nM DMMB were employed, while for HeLa and SKMEL-28 2 µM MB and 20 nM DMMB were employed instead. Mean ± standard error of 3 independent experiments are shown. The significance levels were indicated as *< 0.05, **< 0.01, ***< 0.001. Scale bars: 10 µm.
Figure 6.
Figure 6.
Autophagy modulation after photosensitization. For all analyses performed, HaCaT cells were pretreated with DMMB (10 nM) and irradiated with a 633 nm LED (46 W m−2 irradiance), as done for control cells without photosensitizer. (a) Analysis of cell survival regarding autophagy inhibition. After pretreatment for 24 h in presence (+) or absence (-) of BAF (2 nM) and 3-methyladenine, 3-MA (5 mM), cells were washed, treated with DMMB (10 nM) and irradiated. Cell viability was determined by MTT assay 48 h after irradiation. (b) Autophagy inhibition upon treatment in presence (+) or absence (−) of BAF (20 nM), as determined by immunoblotting of LC3B-II 6 h after irradiation. (c) Expression profile of LC3B-II 1 and 6 h after irradiation. (d) Fluorescence microscopy images of cells immunoassayed for LC3B-II (green) 1 h after photosensitization. (e) Fluorescence microscopy images for cells immunoassayed for SQSTM1 (red) 48 h after irradiation. Autophagy inhibition upon treatment in presence (+) or absence (-) of BAF (20 nM). (f) Fluorescence microscopy images immunoassayed for CTSB (green) and SQSTM1 (cyan) just after photosensitization. Bottom: surface plots for CTSB and SQSTM1 fluorescence of DMMB-treated cells. (g) Fluorescence microscopy images for cells stained with MitoTracker™ Deep Red FM (mitochondrial mass, red) following immunoassay for PRKN (green), just after photosensitization. Right: surface plots for parkin fluorescence. Mean ± standard error of 3 independent experiments are shown. The significance levels were indicated as *< 0.05, **< 0.01, ***< 0.001. Scale bars: 10 µm.
Figure 7.
Figure 7.
Testing the work main hypothesis. (a) Fluorescence microscopy images of cells stained with LysoTracker™ Red DND-99 of lysosomes (LTR, red), followed by immunoassay for CTSB (green) just after irradiation. Cells sensitized with a noncytotoxic dose of MB (0.5 µM) were irradiated with a 633-nm LED (46 W m−2 irradiance), as done for control cells without photosensitizer. Prior chemical damage in mitochondria triggered by 3 mM hydrogen peroxide (HP) and 1.0 μM rotenone (RTN) for 15 min was followed by irradiation with a 633-nm LED (46 W m−2 irradiance) in the presence (+) or absence (-) of a low dose of MB (0.5 µM): (b) cell viability, as determined by MTT reduction assay; (c) microscopy analysis of acidic vacuoles, as performed by acridine orange staining 48 h after irradiation and (d) autophagy levels, as determined by AAU. Treatment with 60 µM chloroquine (CQ) for 24 h and with 10 nM DMMB were used as positive controls for impaired autophagy condition. (e) Microscopy of cells double-stained with LysoTracker™ Red DND-99 for lysosomes (LTR, red) and MitoTracker™ Deep Red FM for mitochondria (MTDR, green). Prior chemical damage in mitochondria triggered by 3 mM hydrogen peroxide (HP) for 15 min was followed by irradiation with a 633-nm LED (46 W m−2 irradiance) in the presence (+) or absence (−) of a low dose of MB (0.5 µM). (f) FACS analysis of cells double-stained with LysoTracker™ Green DND-26 (LTG) and PI 48 h after irradiation with red light. Representative scatter-plots showing cells gated according to the parameters LTG (FL1) and PI (FL3). Right: bars show the mean values of gated cell subpopulations (Q2 and Q3). Mean ± standard error of 3 independent experiments are shown. The significance levels were indicated as *< 0.05 **< 0.01, ***< 0.001, ****< 0.0001. Scale bars: 10 µm.
Figure 8.
Figure 8.
Scheme of working hypothesis using HaCaT keratinocytes. Parallel damage to mitochondrial and lysosomal membranes leads to autophagy-associated cell death. This figure was drawn by W. K. M.

Similar articles

Cited by

References

    1. Rubinsztein DC. Levine PC and B. Autophagy modulation as a potential therapeutic target for diverse diseases. Nat Rev Drug Discov. 2012;29:709–730. - PMC - PubMed
    1. Glick D, Barth S, Macleod KF.. Autophagy: cellular and molecular mechanisms. J Pathol. 2010;221:3–12. - PMC - PubMed
    1. Ding W-X, Yin X-M.. Mitophagy: mechanisms, pathophysiological roles, and analysis. Biol Chem. 2012;393:547–564. - PMC - PubMed
    1. Lemasters JJ, Autophagy, or mitophagy, as a targeted defense against oxidative stress, mitochondrial dysfunction, and aging. Rejuvenation Res. 2005;8:3–5. - PubMed
    1. Reggiori F, Komatsu M, Finley K, et al. Selective types of autophagy. Int J Cell Biol. 2012;2012:156272. - PMC - PubMed

Publication types

MeSH terms