

Deficiency in the nuclear long noncoding RNA Charme causes myogenic defects and heart remodeling in mice
- PMID: 30177572
- PMCID: PMC6138438
- DOI: 10.15252/embj.201899697
Deficiency in the nuclear long noncoding RNA Charme causes myogenic defects and heart remodeling in mice
Abstract
Myogenesis is a highly regulated process that involves the conversion of progenitor cells into multinucleated myofibers. Besides proteins and miRNAs, long noncoding RNAs (lncRNAs) have been shown to participate in myogenic regulatory circuitries. Here, we characterize a murine chromatin-associated muscle-specific lncRNA, Charme, which contributes to the robustness of the myogenic program in vitro and in vivo In myocytes, Charme depletion triggers the disassembly of a specific chromosomal domain and the downregulation of myogenic genes contained therein. Notably, several Charme-sensitive genes are associated with human cardiomyopathies and Charme depletion in mice results in a peculiar cardiac remodeling phenotype with changes in size, structure, and shape of the heart. Moreover, the existence of an orthologous transcript in human, regulating the same subset of target genes, suggests an important and evolutionarily conserved function for Charme Altogether, these data describe a new example of a chromatin-associated lncRNA regulating the robustness of skeletal and cardiac myogenesis.
Keywords: CRISPR/Cas9; epigenetic control; heart development; lncRNAs; myogenesis.
© 2018 The Authors. Published under the CC BY NC ND 4.0 license.
Figures
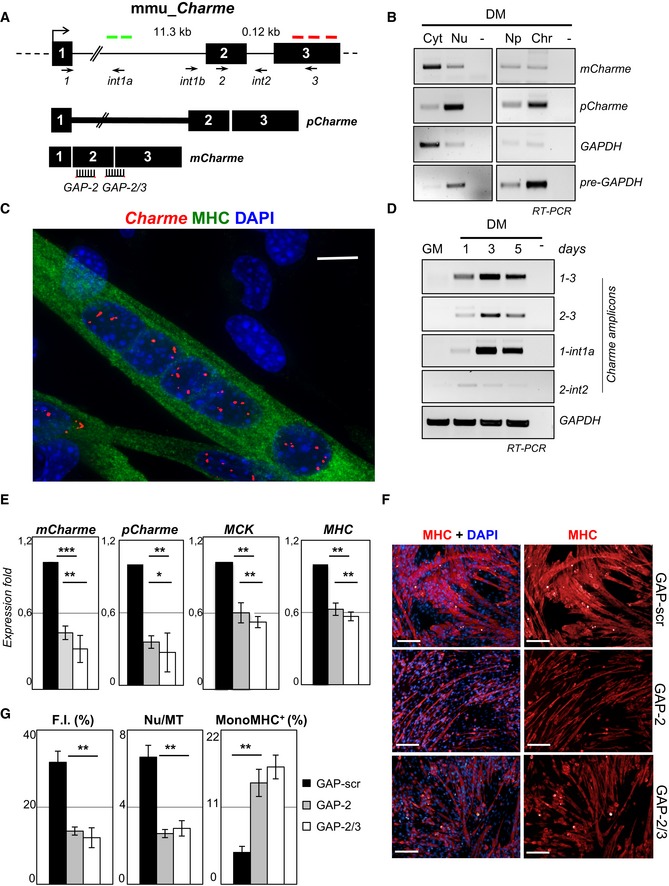
Genomic structure of the Charme locus. The position of PCR primers, LNA GAPmers (GAP‐2, GAP‐2/3), and in situ probes (green—intronic; or red—exonic) used in this study are shown together with the produced Charme isoforms.
Semiquantitative RT–PCR (sqRT–PCR) quantification of pCharme and mCharme in cytoplasmic (Cyt), nuclear (Nu), nucleoplasmic (Np), or chromatin (Chr) fractions from 2‐day differentiated myotubes. The quality of fractionation was tested with mature (GAPDH) and precursor (pre‐GAPDH) RNAs.
Co‐staining of MHC protein (green) and Charme RNA (red) in fully differentiated myotubes. DAPI, 4′,6‐diamidino‐2‐phenylindole. MHC, myosin heavy chain. Scale bar = 10 μm.
sqRT–PCR quantification of Charme amplicons in growth (GM) and differentiated (DM) conditions. GAPDH mRNA serves as control. −, RT‐minus control.
Real‐time RT–PCR (qRT–PCR) quantification of mCharme and pCharme, MCK, and MHC in differentiated myotubes treated with GAP‐2, GAP‐2/3, or GAP‐scr as negative control. Data were normalized to GAPDH mRNA and represent mean ± SD of triplicates.
Immunofluorescence staining for MHC on C2C12 cells treated with GAP‐scr, GAP‐2, or GAP‐2/3 (right) and merged with the DAPI staining (left). Scale bar = 100 μm.
Quantification of myotubes formation (F.I., Nu/MT, MonoMHC+) on cells treated with GAP‐2, GAP‐2/3, or GAP‐scr. Bars represent mean ± SD of triplicates of randomly chosen microscope fields.
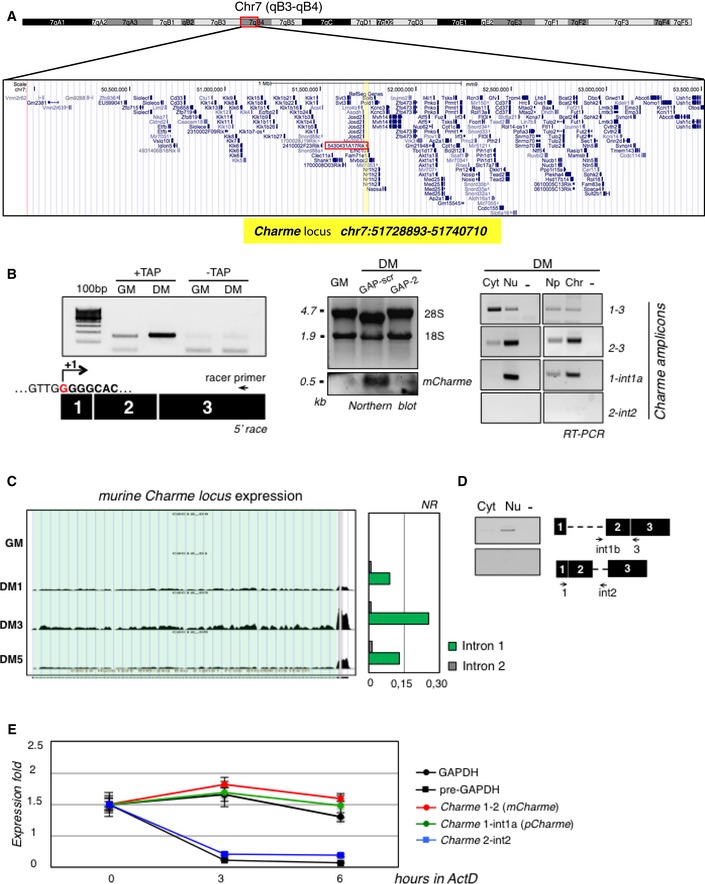
UCSC visualization showing the chromosome position and the genomic coordinates of Charme (highlighted in yellow) in the mm9 mouse genome. Red box indicates the genomic position of the previously annotated 5430431A17Rik transcript.
Left: 5′‐RACE analyses of Charme in proliferating (GM) and differentiating (DM) conditions. The position of the Racer primer is indicated. RNA treated to the same experimental regime, but with tobacco acid pyrophosphatase digestion omitted (−TAP), did not generate a product. The PCR products were sequenced, and the identified Charme transcription start site is reported (+1). Middle: Northern blot analysis of Charme on total RNA from proliferating (GM), differentiating (DM, GAP‐scr), and Charme‐depleted (DM, GAP‐2) myotubes. The reduced level of the signal upon Charme depletion confirms the specificity of the observed band. 18S rRNA and 28S rRNA serve as a loading control. Right: RT–PCR quantification of Charme in cytoplasmic (Cyt), nuclear (Nu), nucleoplasmic (Np), or chromatin (Chr) fractions from differentiated myotubes. The quality of fractionation is shown in Fig 1B. Three biological replicates were analyzed, and a representative experiment is shown. −, RT‐minus control.
RNA‐seq coverage visualization of Charme locus during the time‐course of C2C12 differentiation. A quantification of the intronic reads is represented in the histogram aside. Normalized reads (NR) were obtained by dividing the total number of intronic reads for their respective lengths.
RT–PCR validation of Charme intron 1 retention performed on RNA from cytoplasmic or nuclear samples.
Assessment of Charme isoform stability. RNA half‐lives were calculated upon 0, 3, and 6 h of actinomycin D (ActD) treatment; GAPDH and pre‐GAPDH serve as controls. Data represent the means ± SD from three independent experiments.
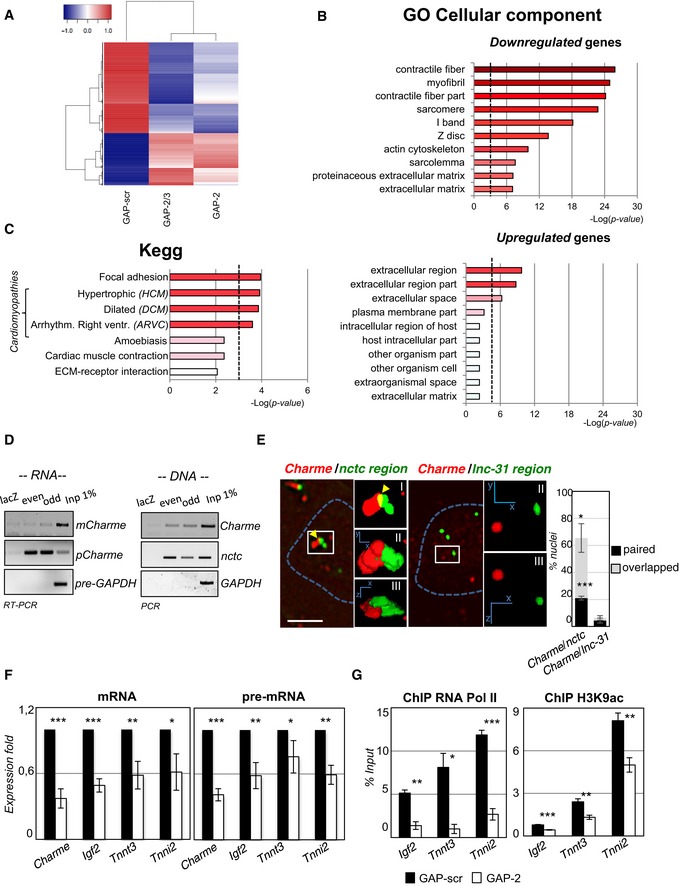
RNA‐seq analysis of transcriptome changes upon Charme depletion. Heatmap was drawn using the heatmap3 R package and represents hierarchical clustering of the common genes differentially expressed upon Charme depletion with both GAP‐2 and GAP‐2/3 GAPmers, compared to GAP‐scr control. The expression levels correspond to mean‐centered log2‐transformed FPKM values. See also Table EV1.
Gene Ontology (GO) term enrichment analyses performed by FIDEA (D'Andrea et al, 2013) on genes downregulated (top) or upregulated (bottom) upon Charme depletion. Bars indicate the top 10 categories of cellular components in decreasing order of significance. Threshold (P‐value < 0.01) is indicated by the dashed black line.
KEGG pathway enrichment analysis on genes downregulated by Charme depletion.
Quantification of recovered RNA (left) and DNA (right) upon Charme ChIRP with the pool of biotinylated probes reported in Table EV4.
RNA/DNA FISH for Charme RNA and nctc (left) or lnc‐31 (right) loci in 2‐day differentiated myotubes. Inserts show a magnification of the spots converted into binary images (I), 3D rendering (II), or rotated on Z‐axis (III). Yellow arrows indicate signals overlapping. Right histogram reports the mean ± SD percentage of nuclei with paired or overlapped spots from two biological replicates. Scale bar = 5 μm.
qRT–PCR quantification of Charme and Charme target genes in GAP‐scr‐ vs. GAP‐2‐transfected (2‐day differentiated) myotubes. PCR data were normalized to GAPDH and represent mean ± SD of triplicates.
RNA Pol II (left) and H3K9ac (right) ChIP performed in GAP‐scr‐ vs. GAP‐2‐transfected myotubes. The recovered chromatin was analyzed by qPCR in parallel with an intergenic region used to normalize the two (GAP‐scr vs. GAP‐2) conditions. Data were subtracted for background and are expressed as input percentage (% Input). Histograms represent the mean ± SEM of three biological replicates.
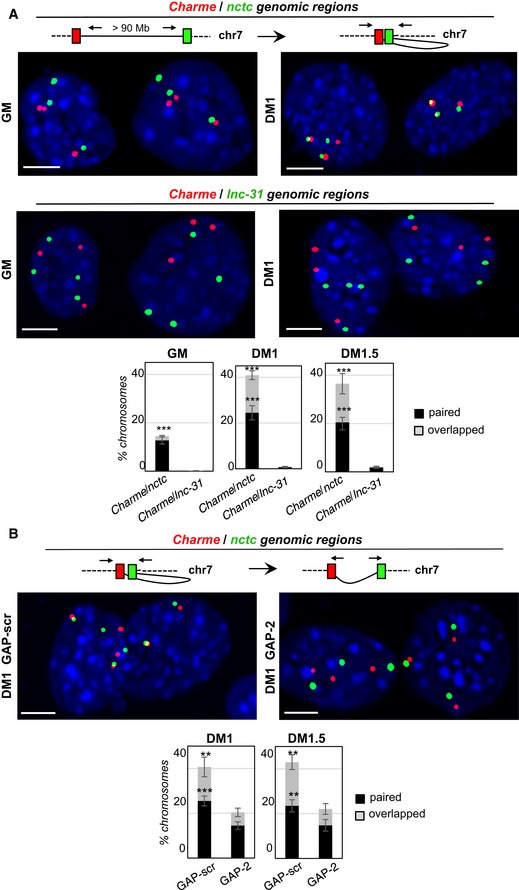
Double DNA FISH for Charme and nctc (top) or Charme and lnc‐31 (bottom) loci in growth (GM) and differentiated (DM1) conditions. Histograms represent the percentages ± SD of chromosome 7 showing paired and overlapped signals in GM, DM1, and DM1.5 days of differentiation from two biological replicates.
DNA/DNA FISH for Charme and nctc loci in GAP‐scr‐ vs. GAP‐2‐transfected myotubes (DM1). Percentage of Charme locus ± SD from three biological replicates showing paired and overlapped signals with nctc is indicated in the histograms below.
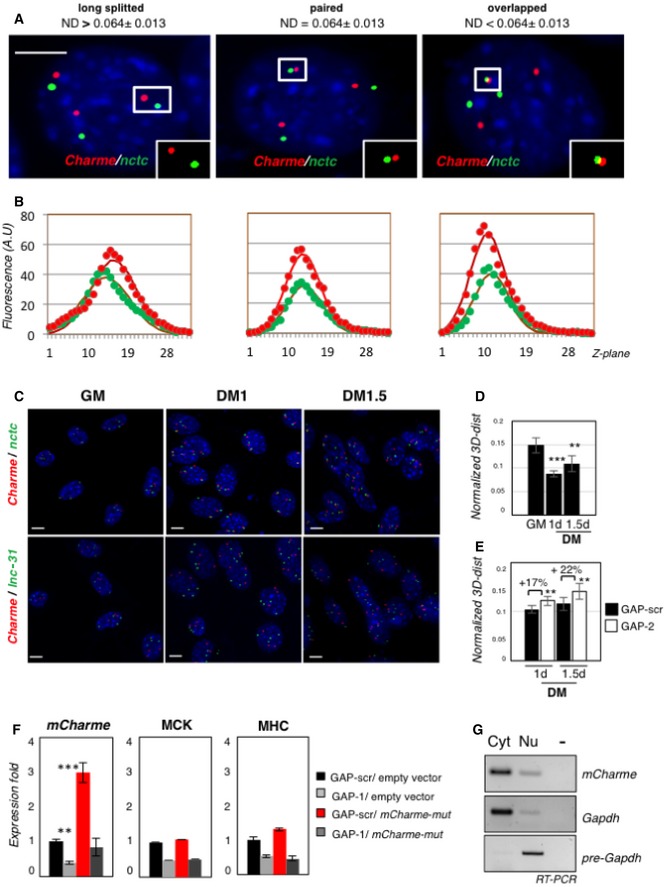
Examples of proximal Charme/nctc DNA FISH spots on the same Z‐section. Red and green signals correspond to Charme or nctc chromatin regions, respectively. White boxes show binarized images of single focal planes containing long‐splitted, paired, or overlapped patterns. On top of the panels, the 3D interallelic distance interval (ND) for each category is shown. ND values were obtained by normalization to the diameter of the nuclei. The number of green/red DNA spots per nucleus (n = 3) reflects the C2C12 aneuploidy with three copies of chromosome 7. Scale bar = 5 μm.
Plotting of Z‐stack intensity distribution for each spot in the insets of (A). Gaussian fit curve (full line) for the data of fluorescence intensity (filled circles) in each channel is plotted along Z‐planes (Z‐step = 200 nm). The strong correspondence of green and red channel distribution indicates near co‐localization and co‐planarity of the signals.
Full field view of the DNA FISH studies on the nuclear distribution of Charme and nctc (top) or Charme and lnc‐31 (bottom) loci. Scale bar = 5 μm.
Normalized 3D distances between Charme and nctc loci at the indicated time points (GM, DM 1–1.5 days). Interallelic distances were normalized to nuclei diameter.
Normalized 3D distances between Charme and nctc loci in GAP‐scr or GAP‐2 treated cells at the indicated differentiation times (DM 1–1.5 days). Interallelic distances were normalized to nuclei diameter. Mean ± SD ND values are shown. **P < 0.01, ***P < 0.001, unpaired Student's t‐test.
Quantitative real‐time RT–PCR analyses of mCharme, MHC, and MCK mRNAs in C2C12 cells transfected with GAP‐scr or GAP‐1 in combination with a mCharme mutant (mCharme‐mut) in the GAP‐1 targeting site. Transfections with the empty vector were used as negative control. PCR data were normalized to GAPDH mRNA.
sqRT–PCR quantification of mCharme in cytoplasmic (Cyt) and nuclear (Nu) fractions from C2C12 cells transfected with mCharme‐mut. The quality of fractionation was tested with mature (GAPDH) and precursor (pre‐GAPDH) RNAs. −, RT‐minus control.
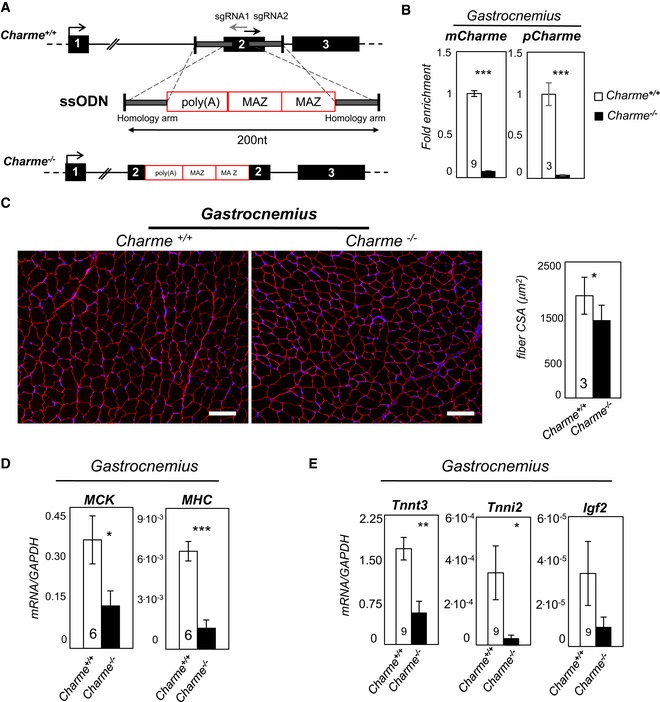
Top: Charme locus is shown together with the position of sgRNA1 and sgRNA2 divergent single guides. Bottom: design of the single‐stranded oligodeoxynucleotide (ssODN) containing the two homology arms (gray line) and the 100‐nt‐long poly(A)/2×MAZ cassette.
qRT–PCR quantification of mCharme and pCharme expression in skeletal homogenates from Charme +/+ and Charme −/− mice. The number of mice tested is the same for the two groups, and it is indicated in the white bars. Data were normalized to GAPDH mRNA and represent mean ± SEM.
Dystrophin staining analyzed by immunofluorescence on Charme +/+ and Charme −/− skeletal (gastrocnemius) biopsies. The mean ± SD of cross‐sectional area (μm2) is reported in the histograms besides. In total, N = 667 and 1,039 fibers per condition were analyzed. Original magnification = ×10. The number of mice tested is the same for the two groups, and it is indicated in the white bars. Scale bar = 100 μm.
qRT–PCR quantification of MHC and MCK transcripts in skeletal (gastrocnemius) homogenates from Charme +/+ and Charme −/− mice. The number of mice tested is the same for the two groups, and it is indicated in the white bars. Data were normalized to GAPDH mRNA and represent mean ± SEM.
qRT–PCR quantification of Tnnt3, Tnni2, and Igf2 transcripts in skeletal (gastrocnemius) homogenates from Charme +/+ and Charme −/− mice. Data were normalized to GAPDH mRNA and represent mean ± SEM. The number of mice tested is the same for the two groups, and it is indicated in the white bars.
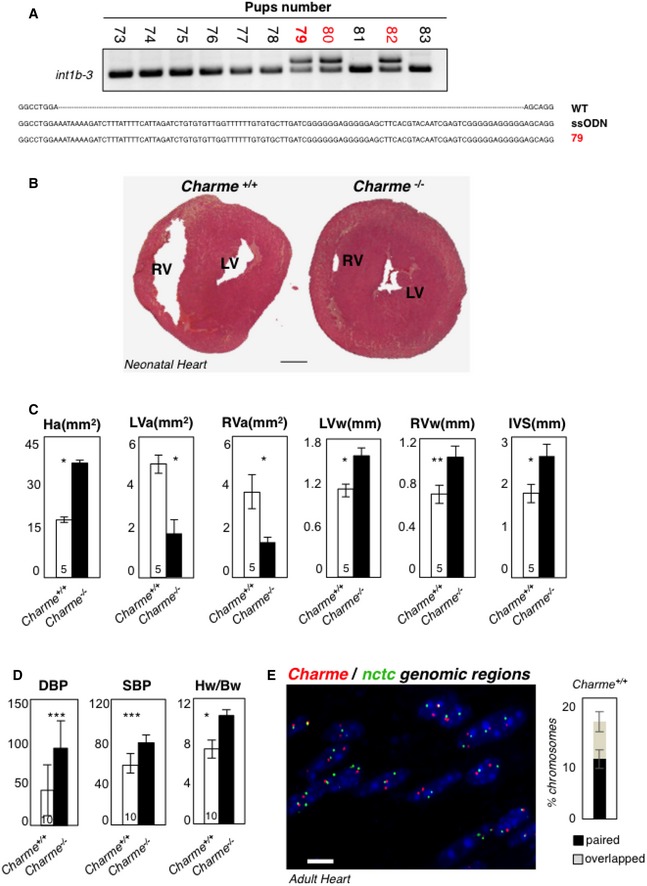
DNA extracted from F0‐generation mice was analyzed by PCR amplification for genotyping. The position of PCR primers is indicated in Fig 1A. Electrophoretic analyses of PCR products and multiple sequence alignment (performed by Muscle‐3.8) indicated the insertion of the entire poly(A)/2×MAZ cassette on a single allele in the #79, #80, and #82 pups (red). The #79 was selected as founder for successive breeding.
Hematoxylin and eosin staining of transverse sections of the myocardium in 2‐day‐old Charme +/+ (left) and Charme −/− (right) mice. Left (LV) and right (RV) ventricles are indicated. Scale bar = 0.5 mm.
Morphometric analyses of heart area (Ha), left and right ventricle areas (LVa and RVa), left and right ventricle walls (LVw and RVw), and interventricular septum (IVS) in Charme +/+ and Charme −/− mice.
Systolic (SBP) and diastolic (DBP) blood pressures and heart/body weight ratio (Hw/Bw) in Charme +/+ and Charme −/− mice. Values represent mean ± SEM of replicates. The numbers of mice tested for each group are indicated in the white bars. Mean ± SD ND values are shown. **P < 0.01, ***P < 0.001, unpaired Student's t‐test.
DNA/DNA FISH in adult cardiac tissues. Charme +/+ adult cardiac tissues exhibit spatial proximity of Charme and nctc genomic regions. The percentages of chromosome 7 showing paired and overlapped signals are 12% and 7%, respectively, in a total of 412 nuclei analyzed. Scale bar = 10 μm.
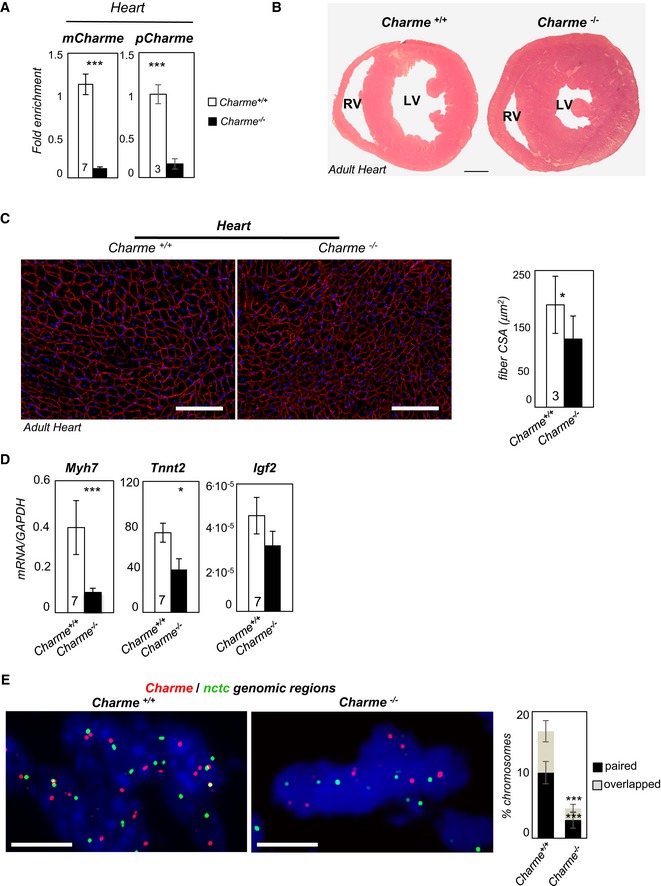
qRT–PCR quantification of mCharme and pCharme expression in cardiac homogenates from Charme +/+ and Charme −/− mice. The number of mice tested (the same for the two groups) is indicated in the white bars. Data were normalized to GAPDH mRNA and represent mean ± SEM.
Hematoxylin and eosin staining of transverse sections of the myocardium in 1‐month‐old Charme +/+ (left) and Charme −/− (right) mice. Left (LV) and right (RV) ventricles are indicated. Scale bar = 1 mm.
Dystrophin staining analyzed by immunofluorescence on Charme +/+ and Charme −/− cardiac tissues. The mean ± SD of cross‐sectional area (μm2) is reported in the histograms besides. In total, N = 1,491 and 1,724 fibers per condition were analyzed. Original magnification = ×20. The number of mice tested is the same for the two groups, and it is indicated in the white bars. Scale bar = 100 μm.
qRT–PCR quantification of Myh7, Tnnt2, and Igf2 transcripts in cardiac homogenates from 1‐month‐old Charme +/+ and Charme −/− mice. Data were normalized to GAPDH mRNA and represent mean ± SEM. The number of mice tested (the same for the two groups) is indicated in the white bars.
DNA/DNA FISH for Charme and nctc loci in Charme +/+ and Charme −/− neonatal (1 day old) cardiac tissues are shown. Percentage of Charme locus ± SD showing paired and overlapped signals with nctc is indicated in the histogram. N = 395 and 315 chromosome pairs per condition were analyzed. Scale bar = 5 μm.
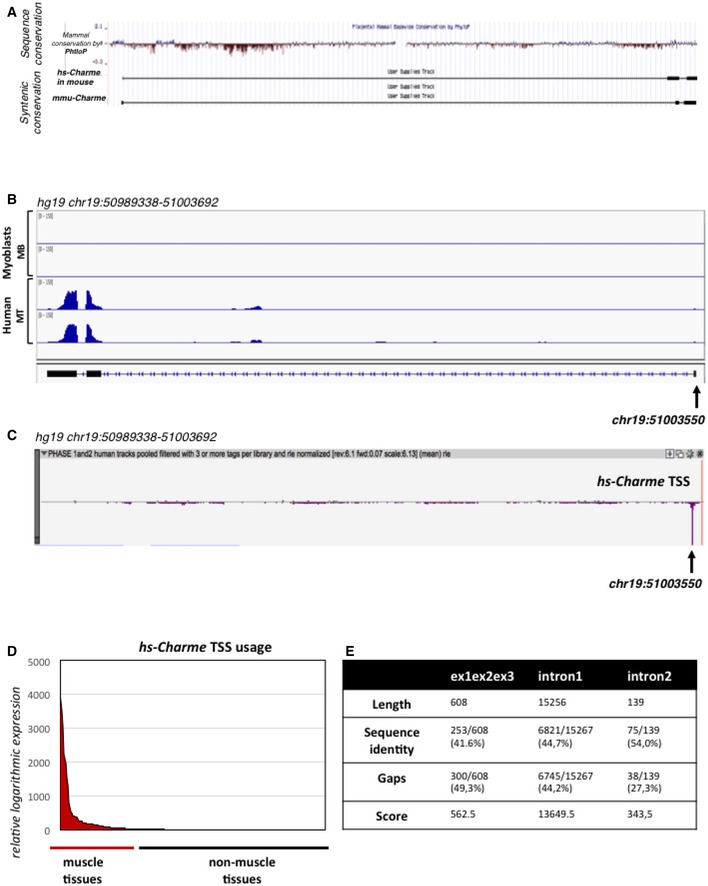
UCSC visualization of the merged between human (hg19, top) and mouse (mm9, bottom) Charme genomic coordinates in the mm9 mouse genome. The analysis shows the mammal genomic sequence conservation (PhyloP) and the Charme transcript synteny between mouse and human.
IGV (Robinson et al, 2011; Thorvaldsdóttir et al, 2013) visualization of the reads coverage from a RNA‐seq experiment performed in human myoblasts (Legnini et al, 2017; GSE70389) in proliferating (MB) and differentiating (MT) conditions; the arrow shows the TSS coordinate. The aligned reads were assembled into the transcript whose exon/intron structure is shown below.
Zenbu (Severin et al, 2014) visualization of the hs‐Charme TSS peak from FANTOM5 (Phase 1 and 2) CAGE datasets across 1,829 samples; the arrow shows the TSS coordinate which corresponds to the one identified by RNA‐seq as reported in (B). The genomic coordinates are reported below.
The diagram shows the hs‐Charme expression in muscle vs. non‐muscle tissues. The entire dataset was exported from FANTOM5 (Phase 1 and 2) CAGE datasets across 1,829 samples (see also Table EV3, sheet 1).
Table represents the values obtained by analyzing the local sequence alignment between the human and murine Charme transcripts. Data were produced by using the implementation of the Smith–Waterman algorithm available at
http://www.ebi.ac.uk/Tools/psa/emboss_water/ . See also Table EV4.
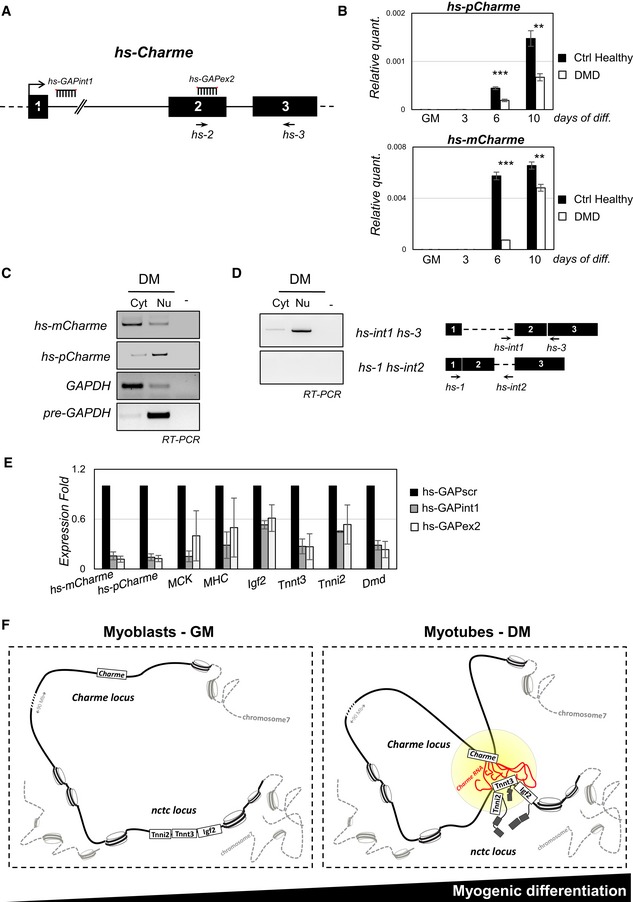
The human Charme genomic locus is indicated together with the position of PCR primers (hs‐2, hs‐3) and LNA GAPmers (hs‐GAP‐int1, hs‐GAP‐ex2) used in this study.
RT–PCR quantification of the human hs‐pCharme (upper panel) and hs‐mCharme (lower panel) in control healthy or dystrophic (DMD) primary myoblasts in proliferating (GM) and differentiating (3, 6, 10) conditions. Data were normalized to GAPDH mRNA and represent mean ± SD. Three biological replicates were analyzed.
sqRT–PCR quantification of hs‐pCharme and hs‐mCharme in cytoplasmic (Cyt) and nuclear (Nu) RNA fractions from differentiated myotubes. The quality of fractionation was tested with precursor (pre‐GAPDH) and mature (GAPDH) RNAs.
Analysis by PCR amplification of hs‐pCharme intron 1 retention. The position of the oligos used for the analyses is depicted aside.
qRT–PCR quantification of hs‐mCharme, hs‐pCharme, MCK, MHC, Igf2, Tnnt3, Tnni2, and Dmd mRNAs in primary cells treated with hs‐GAP‐int1, hs‐GAP‐ex2, or hs‐GAP‐scr GAPmers at day 5 of differentiation. PCR data were normalized to GAPDH mRNA and represent mean ± SD of duplicates.
Proposed model for pCharme mode of action: In proliferating myoblasts, Charme is not expressed and its chromatin locus is spatially distant from the nctc region; in differentiated myotubes, pCharme stabilizes the physical proximity of the two loci allowing their co‐regulated expression.
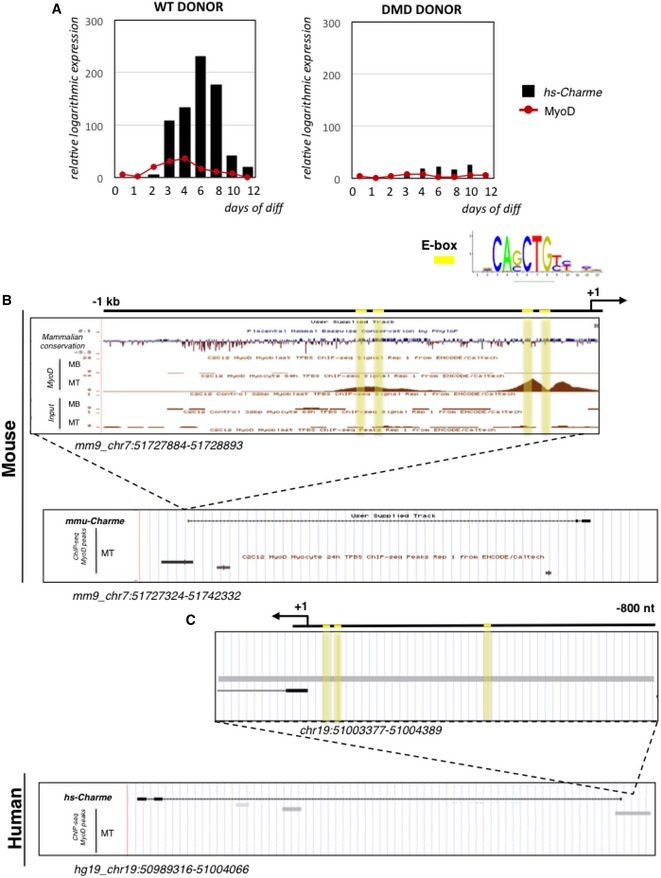
hs‐Charme and MyoD expression during a time‐course of in vitro differentiation of WT (left panel) and DMD (right panel) myoblast into myotubes. The expression values were exported from FANTOM5 (Phase 1 and 2) CAGE datasets and are reported in Table EV3 (sheet 2). Data represent the relative logarithmic expression (rle) of the tag‐per‐million (TPM) values of the TSS.
UCSC visualization of MyoD ChIP‐seq binding peaks in myoblast (MB) and myotubes (MT) from murine C2C12 cells.
UCSC visualization of MyoD ChIP‐seq binding peaks in human myotubes (MT). The identity of each track is indicated along the left side, while the genomic coordinates are indicated below. E‐boxes are highlighted in yellow.
References
-
- Ariel F, Jegu T, Latrasse D, Romero‐Barrios N, Christ A, Benhamed M, Crespi M (2014) Noncoding transcription by alternative RNA polymerases dynamically regulates an auxin‐driven chromatin loop. Mol Cell 55: 383–396 - PubMed
Publication types
MeSH terms
Substances
Grants and funding
LinkOut - more resources
Full Text Sources
Other Literature Sources
Molecular Biology Databases
