

Minimizing Structural Bias in Single-Molecule Super-Resolution Microscopy
- PMID: 30177692
- PMCID: PMC6120949
- DOI: 10.1038/s41598-018-31366-w
Minimizing Structural Bias in Single-Molecule Super-Resolution Microscopy
Abstract
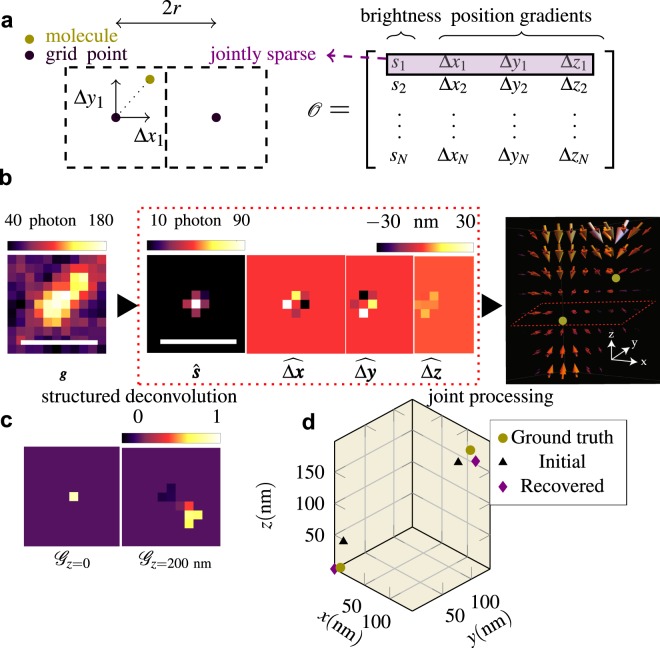
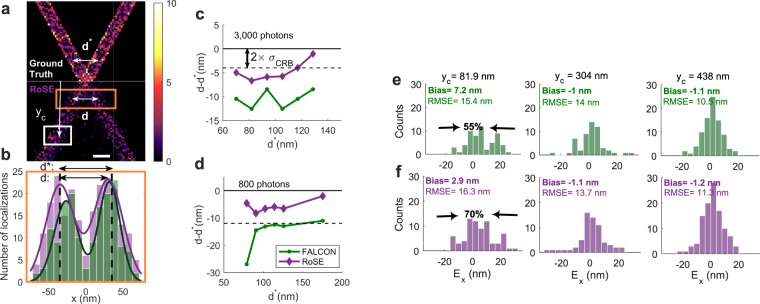
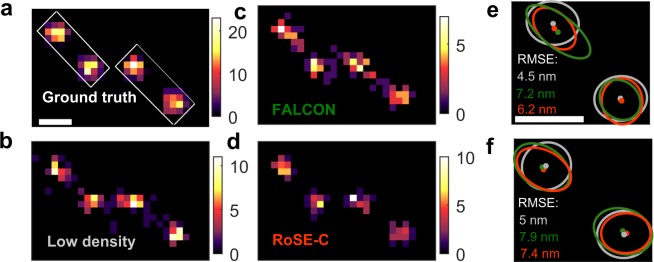
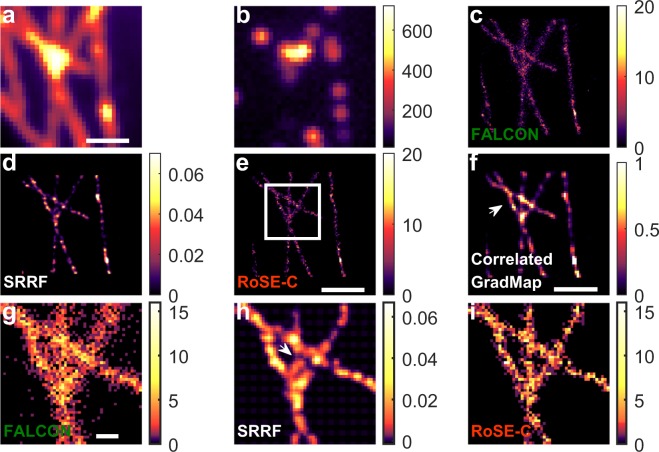
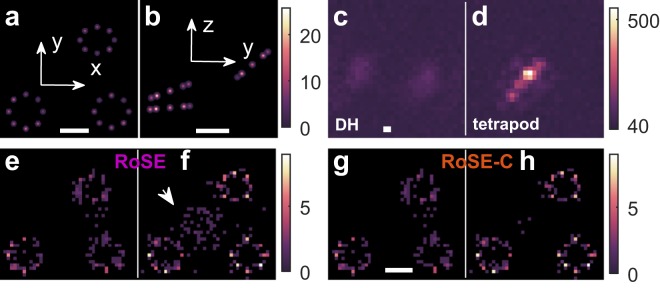
Single-molecule localization microscopy (SMLM) depends on sequential detection and localization of individual molecular blinking events. Due to the stochasticity of single-molecule blinking and the desire to improve SMLM's temporal resolution, algorithms capable of analyzing frames with a high density (HD) of active molecules, or molecules whose images overlap, are a prerequisite for accurate location measurements. Thus far, HD algorithms are evaluated using scalar metrics, such as root-mean-square error, that fail to quantify the structure of errors caused by the structure of the sample. Here, we show that the spatial distribution of localization errors within super-resolved images of biological structures are vectorial in nature, leading to systematic structural biases that severely degrade image resolution. We further demonstrate that the shape of the microscope's point-spread function (PSF) fundamentally affects the characteristics of imaging artifacts. We built a Robust Statistical Estimation algorithm (RoSE) to minimize these biases for arbitrary structures and PSFs. RoSE accomplishes this minimization by estimating the likelihood of blinking events to localize molecules more accurately and eliminate false localizations. Using RoSE, we measure the distance between crossing microtubules, quantify the morphology of and separation between vesicles, and obtain robust recovery using diverse 3D PSFs with unmatched accuracy compared to state-of-the-art algorithms.
Conflict of interest statement
The authors declare no competing interests.
Figures
Similar articles
-
Quantifying accuracy and heterogeneity in single-molecule super-resolution microscopy.Nat Commun. 2020 Dec 11;11(1):6353. doi: 10.1038/s41467-020-20056-9. Nat Commun. 2020. PMID: 33311471 Free PMC article.
-
A pairwise distance distribution correction (DDC) algorithm to eliminate blinking-caused artifacts in SMLM.Nat Methods. 2021 Jun;18(6):669-677. doi: 10.1038/s41592-021-01154-y. Epub 2021 May 31. Nat Methods. 2021. PMID: 34059826 Free PMC article.
-
Parameter-free rendering of single-molecule localization microscopy data for parameter-free resolution estimation.Commun Biol. 2021 May 11;4(1):550. doi: 10.1038/s42003-021-02086-1. Commun Biol. 2021. PMID: 33976358 Free PMC article.
-
Development of Deep-Learning-Based Single-Molecule Localization Image Analysis.Int J Mol Sci. 2022 Jun 21;23(13):6896. doi: 10.3390/ijms23136896. Int J Mol Sci. 2022. PMID: 35805897 Free PMC article. Review.
-
Analysis methods for interrogating spatial organisation of single molecule localisation microscopy data.Int J Biochem Cell Biol. 2020 Jun;123:105749. doi: 10.1016/j.biocel.2020.105749. Epub 2020 Apr 20. Int J Biochem Cell Biol. 2020. PMID: 32325279 Review.
Cited by
-
Single-fluorogen imaging reveals distinct environmental and structural features of biomolecular condensates.Nat Phys. 2025;21(5):778-786. doi: 10.1038/s41567-025-02827-7. Epub 2025 Mar 14. Nat Phys. 2025. PMID: 40386802 Free PMC article.
-
Towards a Quantitative Single Particle Characterization by Super Resolution Microscopy: From Virus Structures to Antivirals Design.Front Bioeng Biotechnol. 2021 Mar 26;9:647874. doi: 10.3389/fbioe.2021.647874. eCollection 2021. Front Bioeng Biotechnol. 2021. PMID: 33842446 Free PMC article. Review.
-
Potential quality improvement of stochastic optical localization nanoscopy images obtained by frame by frame localization algorithms.Sci Rep. 2020 Jul 16;10(1):11844. doi: 10.1038/s41598-020-68564-4. Sci Rep. 2020. PMID: 32678167 Free PMC article.
-
Quantifying accuracy and heterogeneity in single-molecule super-resolution microscopy.Nat Commun. 2020 Dec 11;11(1):6353. doi: 10.1038/s41467-020-20056-9. Nat Commun. 2020. PMID: 33311471 Free PMC article.
-
4polar-STORM polarized super-resolution imaging of actin filament organization in cells.Nat Commun. 2022 Jan 13;13(1):301. doi: 10.1038/s41467-022-27966-w. Nat Commun. 2022. PMID: 35027553 Free PMC article.
References
Publication types
MeSH terms
Grants and funding
LinkOut - more resources
Full Text Sources
Other Literature Sources
