

Influenza virus infection causes global RNAPII termination defects
- PMID: 30177761
- PMCID: PMC10754036
- DOI: 10.1038/s41594-018-0124-7
Influenza virus infection causes global RNAPII termination defects
Abstract
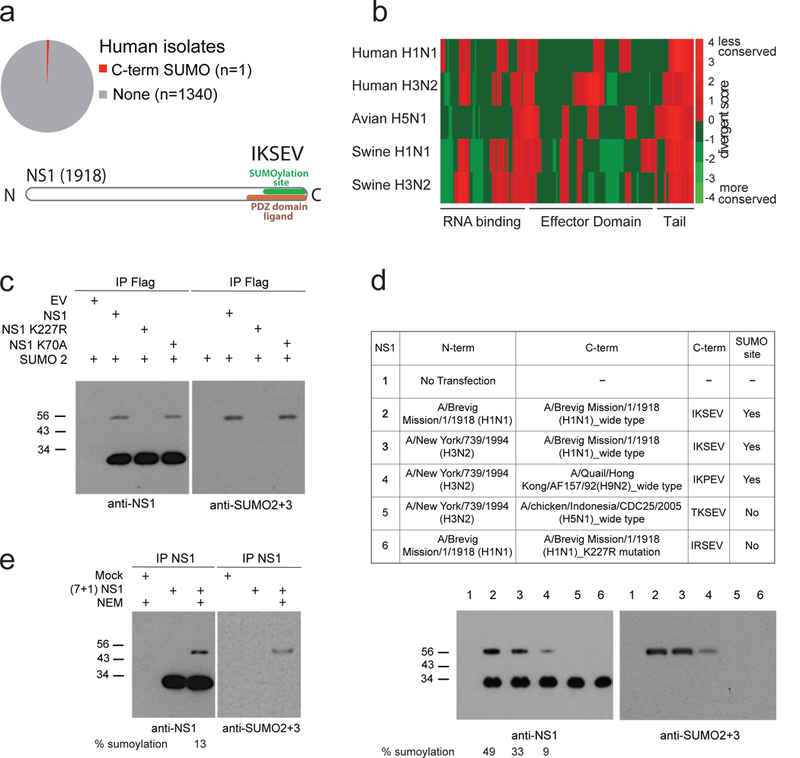
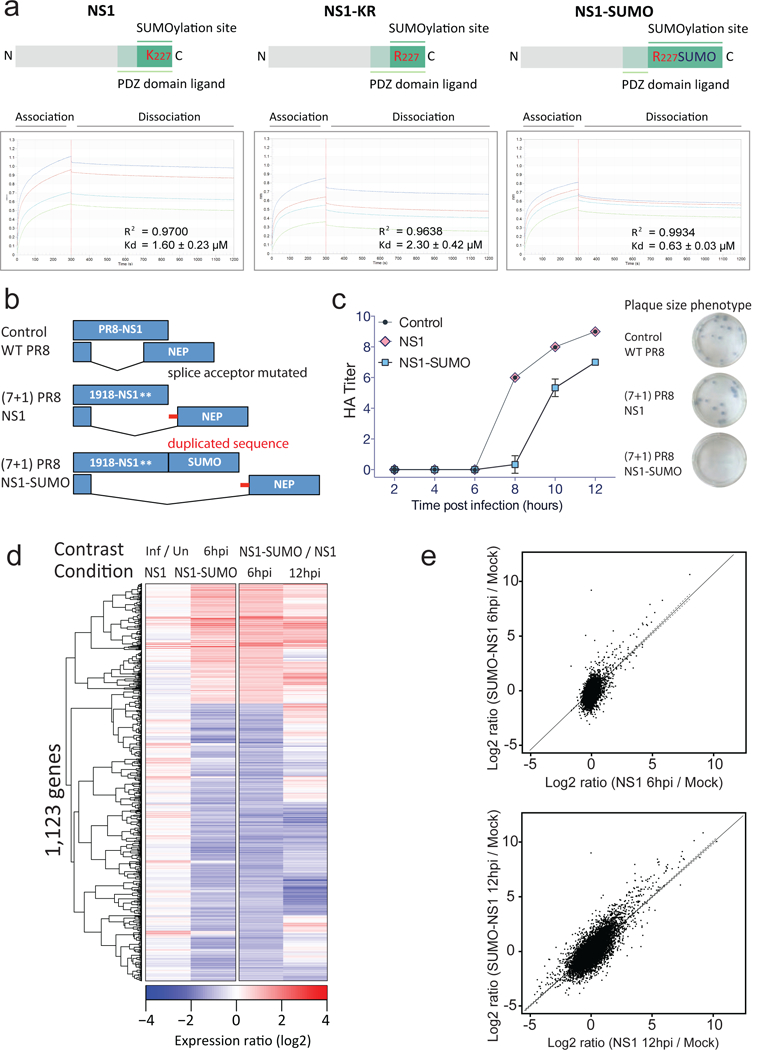
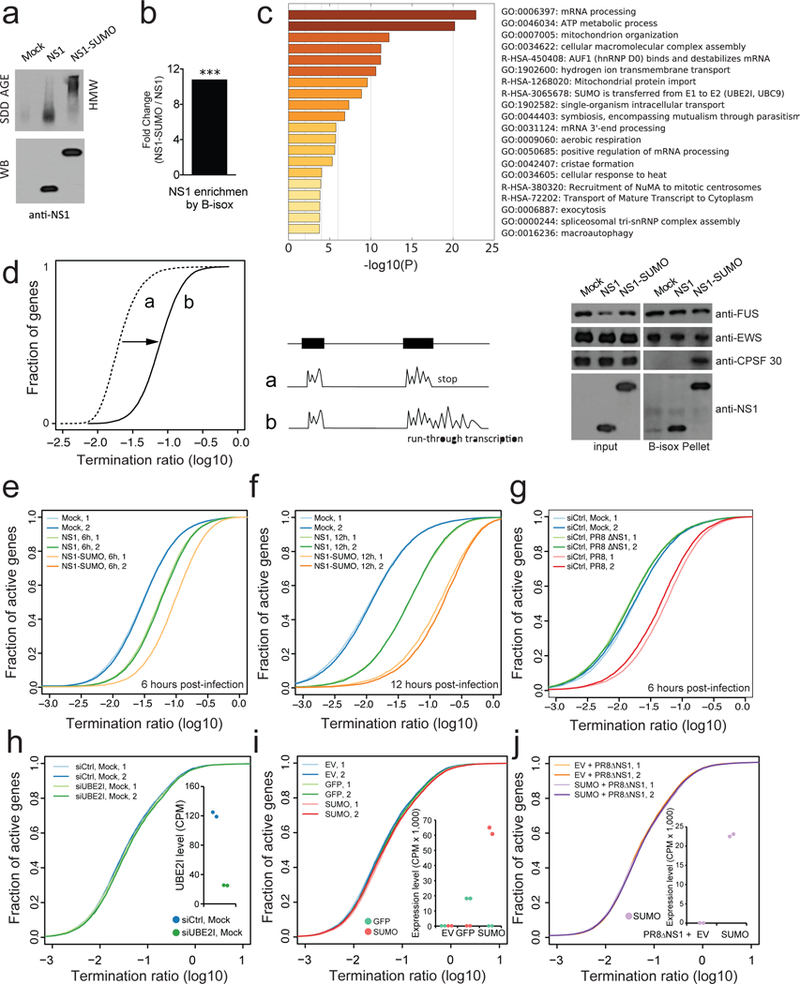
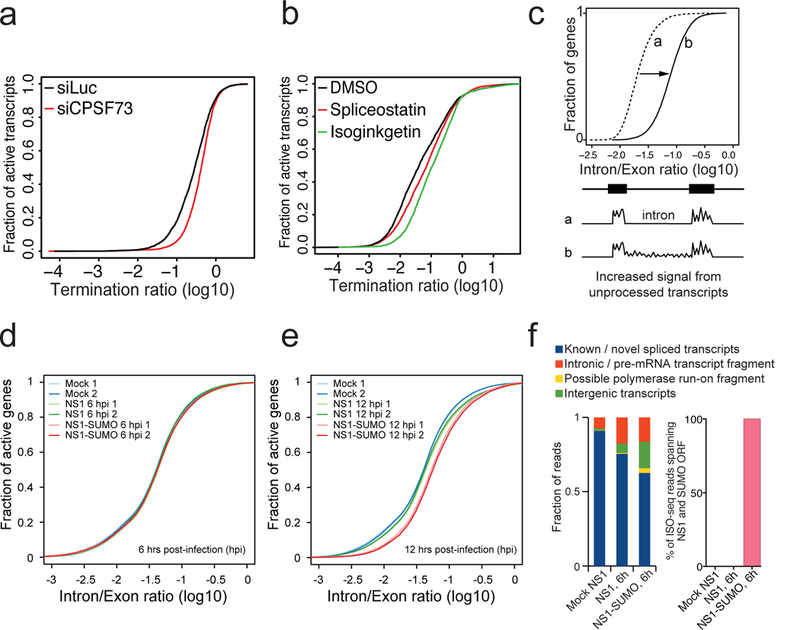
Viral infection perturbs host cells and can be used to uncover regulatory mechanisms controlling cellular responses and susceptibility to infections. Using cell biological, biochemical, and genetic tools, we reveal that influenza A virus (IAV) infection induces global transcriptional defects at the 3' ends of active host genes and RNA polymerase II (RNAPII) run-through into extragenic regions. Deregulated RNAPII leads to expression of aberrant RNAs (3' extensions and host-gene fusions) that ultimately cause global transcriptional downregulation of physiological transcripts, an effect influencing antiviral response and virulence. This phenomenon occurs with multiple strains of IAV, is dependent on influenza NS1 protein, and can be modulated by SUMOylation of an intrinsically disordered region (IDR) of NS1 expressed by the 1918 pandemic IAV strain. Our data identify a strategy used by IAV to suppress host gene expression and indicate that polymorphisms in IDRs of viral proteins can affect the outcome of an infection.
Figures
Similar articles
-
Efficacy and safety of onradivir in adults with acute uncomplicated influenza A infection in China: a multicentre, double-blind, randomised, placebo-controlled and oseltamivir-controlled, phase 3 trial.Lancet Respir Med. 2025 Jul;13(7):597-610. doi: 10.1016/S2213-2600(25)00046-3. Epub 2025 Jun 7. Lancet Respir Med. 2025. PMID: 40489986 Clinical Trial.
-
Comparative IP-MS Reveals HSPA5 and HSPA8 Interacting with Hemagglutinin Protein to Promote the Replication of Influenza A Virus.Pathogens. 2025 May 27;14(6):535. doi: 10.3390/pathogens14060535. Pathogens. 2025. PMID: 40559543 Free PMC article.
-
hnRNPM regulates influenza A virus replication through distinct mechanisms in human and avian cells: implications for cross-species transmission.J Virol. 2025 Jun 17;99(6):e0006725. doi: 10.1128/jvi.00067-25. Epub 2025 May 28. J Virol. 2025. PMID: 40434105 Free PMC article.
-
Physical interventions to interrupt or reduce the spread of respiratory viruses.Cochrane Database Syst Rev. 2023 Jan 30;1(1):CD006207. doi: 10.1002/14651858.CD006207.pub6. Cochrane Database Syst Rev. 2023. PMID: 36715243 Free PMC article.
-
The global burden of swine influenza and its mitigation.Open Vet J. 2025 May;15(5):1866-1879. doi: 10.5455/OVJ.2025.v15.i5.3. Epub 2025 May 31. Open Vet J. 2025. PMID: 40557091 Free PMC article. Review.
Cited by
-
Innate Immune Response to Influenza Virus at Single-Cell Resolution in Human Epithelial Cells Revealed Paracrine Induction of Interferon Lambda 1.J Virol. 2019 Sep 30;93(20):e00559-19. doi: 10.1128/JVI.00559-19. Print 2019 Oct 15. J Virol. 2019. PMID: 31375585 Free PMC article.
-
Herpes simplex virus blocks host transcription termination via the bimodal activities of ICP27.Nat Commun. 2020 Jan 15;11(1):293. doi: 10.1038/s41467-019-14109-x. Nat Commun. 2020. PMID: 31941886 Free PMC article.
-
The Effector Domain of the Influenza A Virus Nonstructural Protein NS1 Triggers Host Shutoff by Mediating Inhibition and Global Deregulation of Host Transcription When Associated with Specific Structures in the Nucleus.mBio. 2021 Oct 26;12(5):e0219621. doi: 10.1128/mBio.02196-21. Epub 2021 Sep 7. mBio. 2021. PMID: 34488451 Free PMC article.
-
Avian influenza viruses suppress innate immunity by inducing trans-transcriptional readthrough via SSU72.Cell Mol Immunol. 2022 Jun;19(6):702-714. doi: 10.1038/s41423-022-00843-8. Epub 2022 Mar 24. Cell Mol Immunol. 2022. PMID: 35332300 Free PMC article.
-
Influenza A virus replicates productively in primary human kidney cells and induces factors and mechanisms related to regulated cell death and renal pathology observed in virus-infected patients.Front Cell Infect Microbiol. 2024 Mar 25;14:1363407. doi: 10.3389/fcimb.2024.1363407. eCollection 2024. Front Cell Infect Microbiol. 2024. PMID: 38590437 Free PMC article.
References
-
- Rialdi A, Hultquist J, Jimenez-Morales D, Peralta Z, Campisi L, Fenouil R, Moshkina N, Wang ZZ, Laffleur B, Kaake RM, McGregor MJ, Haas K, Pefanis E, Albrecht RA, Pache L, Chanda S, Jen J, Ochando J, Byun M, Basu U, García-Sastre A, Krogan N, van Bakel H & Marazzi I The RNA exosome syncs IAV-RNAPII transcription to promote viral ribogenesis and infectivity. Cell 169, 679–692 (2017). - PMC - PubMed
-
- Ayllon J & García-Sastre A The NS1 protein: a multitasking virulence factor. Curr. Top Microbiol. Immunol. 386, 73–107 (2015). - PubMed
-
- Li S, Min JY, Krug RM & Sen GC Binding of the influenza A virus NS1 protein to PKR mediates the inhibition of its activation by either PACT or double-stranded RNA. Virology 349, 13–21 (2006). - PubMed
Publication types
MeSH terms
Substances
Grants and funding
LinkOut - more resources
Full Text Sources
Other Literature Sources
Medical
Molecular Biology Databases
