. 2018 Oct;20(10):1193-1202.
doi: 10.1038/s41556-018-0179-z. Epub 2018 Sep 3.

Stem cell functionality is microenvironmentally defined during tumour expansion and therapy response in colon cancer

Affiliations

Stem cell functionality is microenvironmentally defined during tumour expansion and therapy response in colon cancer

Kristiaan J Lenos et al. Nat Cell Biol. 2018 Oct.

Abstract

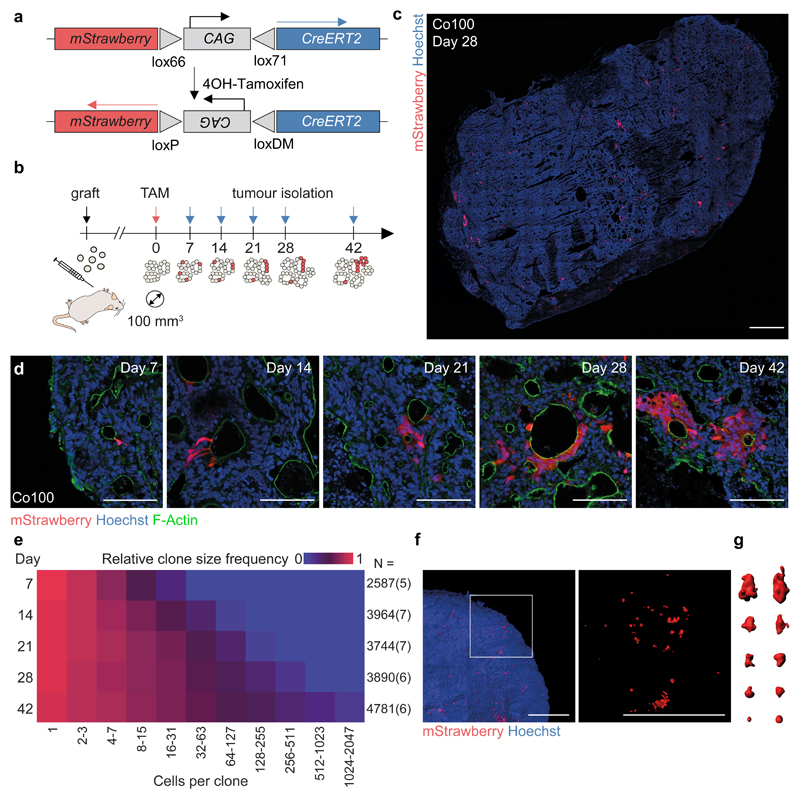
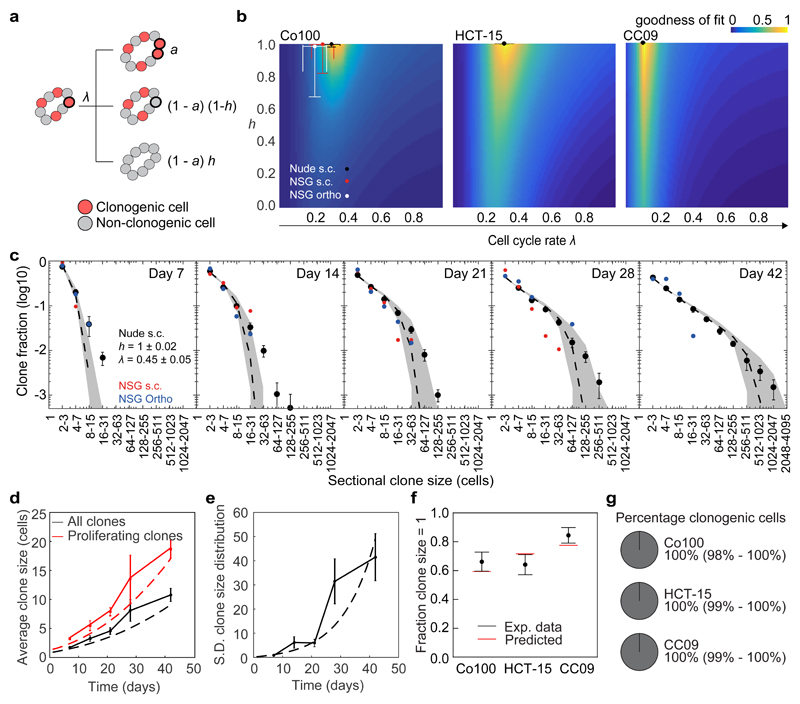
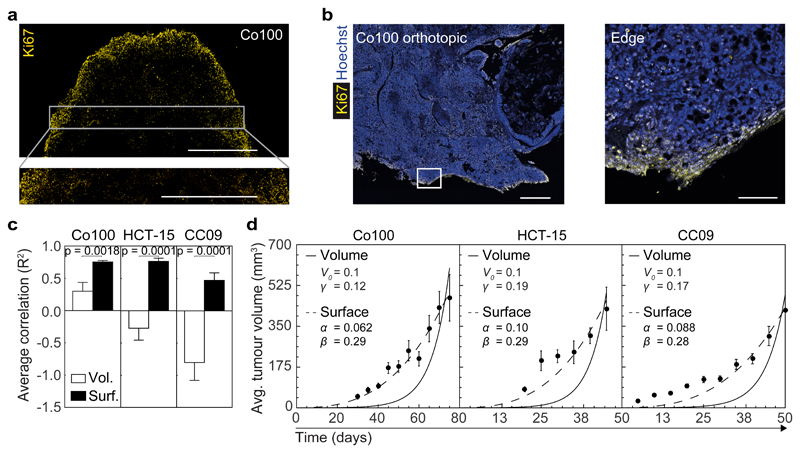
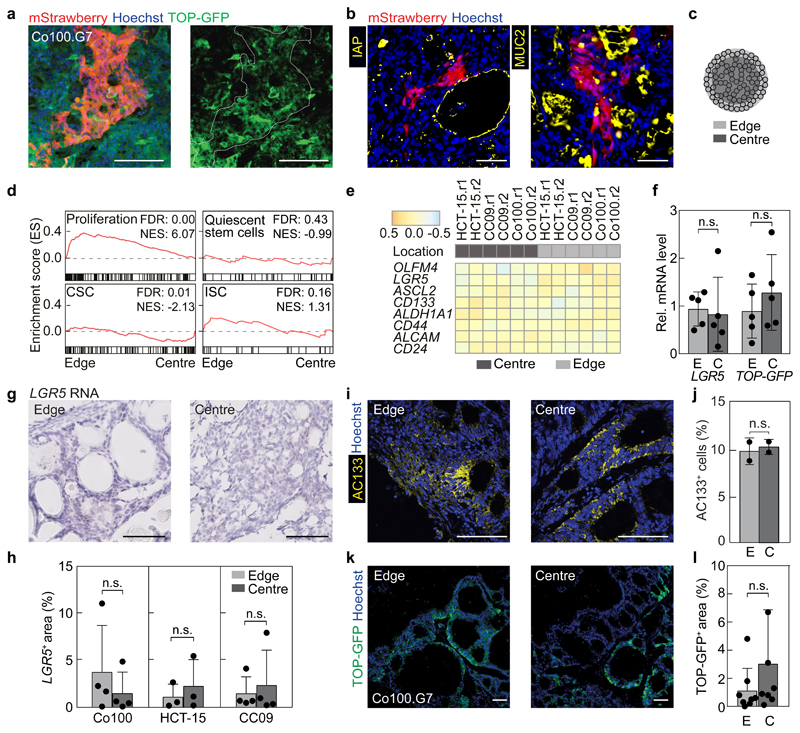
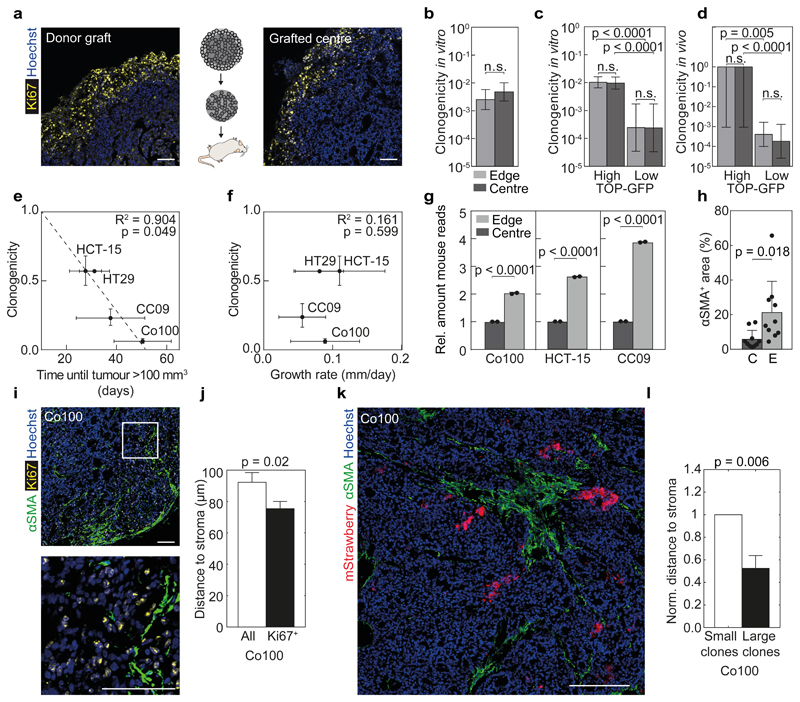
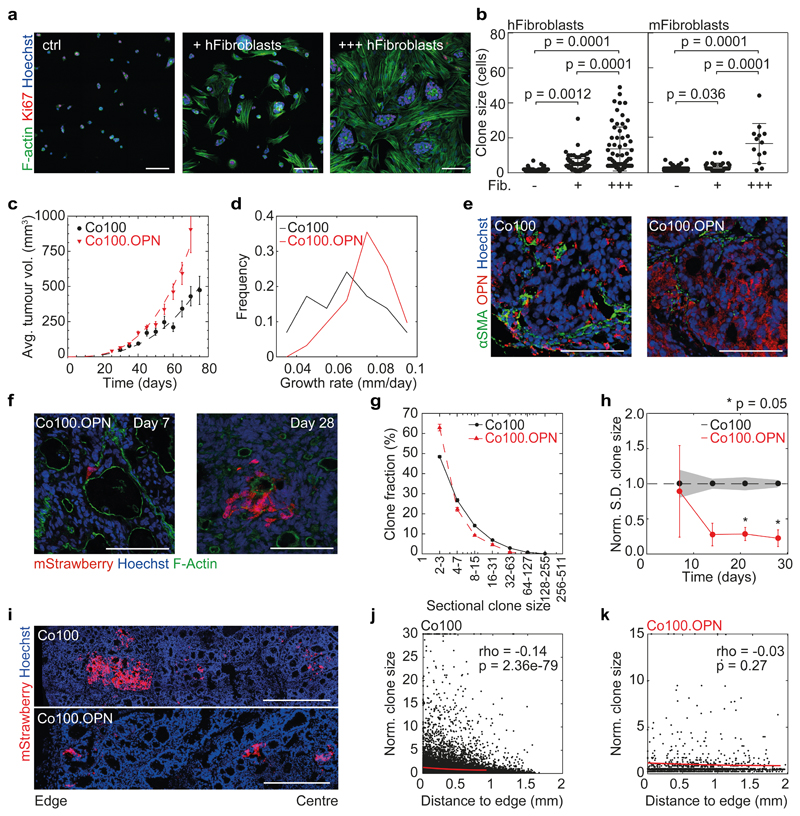
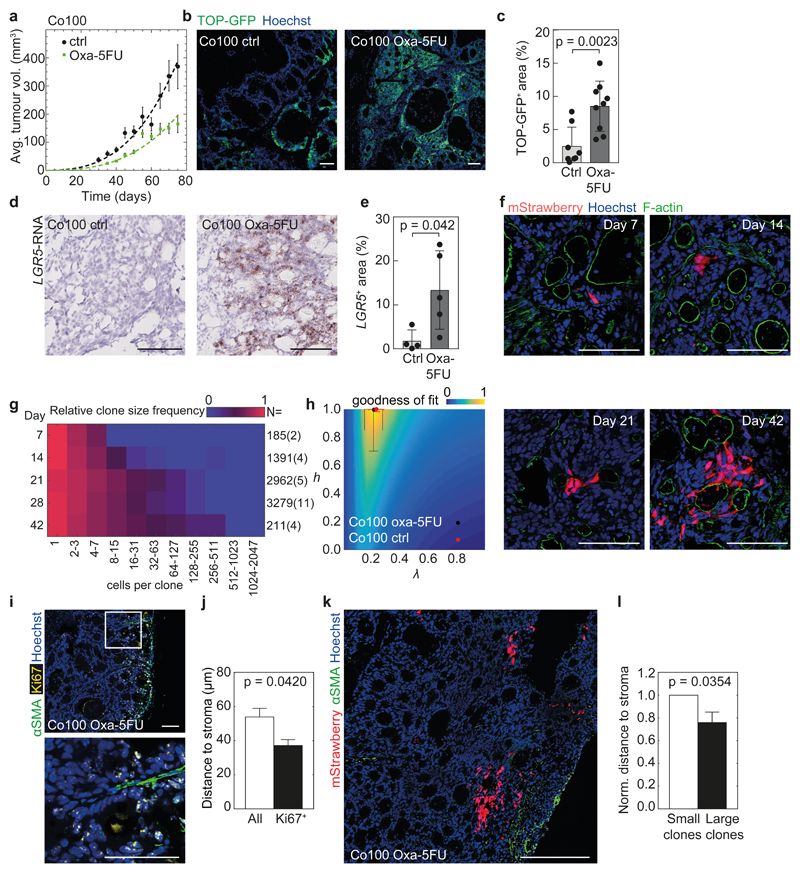
Solid malignancies have been speculated to depend on cancer stem cells (CSCs) for expansion and relapse after therapy. Here we report on quantitative analyses of lineage tracing data from primary colon cancer xenograft tissue to assess CSC functionality in a human solid malignancy. The temporally obtained clone size distribution data support a model in which stem cell function in established cancers is not intrinsically, but is entirely spatiotemporally orchestrated. Functional stem cells that drive tumour expansion predominantly reside at the tumour edge, close to cancer-associated fibroblasts. Hence, stem cell properties change in time depending on the cell location. Furthermore, although chemotherapy enriches for cells with a CSC phenotype, in this context functional stem cell properties are also fully defined by the microenvironment. To conclude, we identified osteopontin as a key cancer-associated fibroblast-produced factor that drives in situ clonogenicity in colon cancer.


Conflict of interest statement

Competing interests

The authors declare no financial interests in the content of this publication.

Figures

Figure 1
Figure 1. Marker free lineage tracing in established colon cancer tissue.
(a) Schematic of lentiviral vector LV-indLS2. 4-OH-Tamoxifen (TAM) dependent recombination of mutant loxP sites results in permanent mStrawberry expression and Cre-inactivation. (b) Strategy for sporadic random labelling of cells in established colon cancer tissue. Following subcutaneous tumour cell injections, TAM administration followed at time indicated by red arrow, and tumour isolation at time points corresponding to blue arrows. (c) Example tumour section of Co100 xenograft, 28 days post-induction, is shown. mStrawberry marker is shown in red, nuclear stain is Hoechst (blue). Scale bar, 1 mm. 31 independent tumours were analysed. (d) Representative images of labelled Co100 clones at indicated time points, as used in (e), mStrawberry (red), nuclear stain, Hoechst (blue). Scale bars, 100 µm. (e) Relative clone frequency (indicated by colour in heatmap) per binned clone size (in columns) in time (rows) for Co100 tumours. Number of clones and tumours (between parentheses) are depicted next to each time point. (f) 3D images of cleared xenograft tissue is shown, mStrawberry marker is shown in red. Scale bars, 1 mm. (g) 3D representations of example clones of various sizes. Two independent tumours were analysed (f, g). Source data are shown in Supplementary Table 1.
Figure 2
Figure 2. Stochastic modelling and data inference identify spatiotemporal regulation of stem cell function.
(a) Diagram explaining the stochastic model for tumour growth. With rate λ clonogenic cells stochastically divide with probability a. Cells become non-clonogenic with probability (1 - a)(1 - h), or all cells within a clone lose their clonogenicity with probability (1 - a)h. λ, effective proliferation rate (cell divisions/day); a, mode of tumour growth (a=12(1+2λt+10) for surface growth and 0.5 < a ≤ 1 for exponential growth); h, heterogeneity of growth between clones. See Supplementary Note 1 for details. (b) Heat maps depict goodness of fit (inverse and normalized least squares distance) as a function of λ and h on expanding clones (clone size > 1 cell) in Co100, HCT-15 and CC09 xenografts. Dots indicate optimal fit. Error bars represent S.D. (c) Sectional clone size distribution over time in Co100 xenografts. Experimentally determined- (shown as black dots), and model-predicted (dashed line) clone size distributions using best fit and 95% confidence interval (grey shade) as found in panel b. Red and blue dots represent experimental data obtained from subcutaneous and orthotopic xenografts in NSG mice, respectively. (d) Average measured (solid lines) and predicted (dashed lines) clone size in time of all (black lines) or proliferating clones (red lines) in Co100 tumours. (e) Measured (solid line) and predicted (dashed line) standard deviation of clone size in time. (c-e) Data is represented as mean ± S.E.M. (f) Experimentally measured fraction of single-cell clones, one week after clone induction are shown as black dots. Model prediction using the optimal fit parameters for indicated cell lines is shown as red lines. Data is represented as mean ± S.D. (g) The inferred percentage of clonogenic cells in the tumour edge is depicted in circle diagrams for Co100, HCT-15 and CC09. Source data are shown in Supplementary Table 1 (b-f).
Figure 3
Figure 3. The mode of growth predicted by clonal dynamics confirmed at the macroscopic scale.
(a) Ki67 staining of a subcutaneous grafted Co100 tumour is shown. A larger magnification of the indicated area in top panel is shown below. Scale bars, 1 mm. Representative of 5 tumours. (b) Ki67 staining (yellow) of Co100 orthotopically grafted xenograft. Right panel is a magnification of the indicated box in the left image. Scale bars, 500 µm in left panel, and 100 µm in right panel. Representative examples of 5 tumours are shown. (c) Average correlation (R2) of tumour size measurements of tumour xenografts of the indicated cell lines with either the exponential volume (white bar) or surface growth model (black bar). Average R2 of volume and surface growth were compared using two-tailed Student’s t-test. (d) Average tumour volumes are shown at 5 day intervals for Co100, HCT-15 and CC09 tumours. Best fit of volume growth (V(t′) = V0eγt′) is shown as solid line, and surface growth model (V(t)=4π3(αt+β)3) is indicated by dashed line. (c, d) Data is represented as mean ± S.E.M. Sample sizes are as follows; Co100 (n = 29 tumours), HCT-15 (n = 25 tumours) and CC09 (n = 23 tumours). Individual data points are shown in Supplementary Fig. 5a, b.
Figure 4
Figure 4. Stem cell markers do not identify clonogenic cells in vivo.
(a) An individual mStrawberry-positive clone in the edge of a Co100.G7 tumour is shown, revealing heterogeneous expression of TOP-GFP. mStrawberry marker is shown in red, TOP-GFP is shown in green. Scale bars, 100 μm. Outline of mStrawberry-positive clone is indicated by white dashed line in TOP-GFP image. Representative of 6 independent tumours. (b) Differentiation markers IAP and MUC2 are stained (both in yellow) within mStrawberry-labelled clones. Scale bars, 50 µm. Representative of 10 tumours. (c) Separation of tumour regions yielded cells from the edge (light grey) and centre (dark grey) of the xenografts. (d) Gene set enrichment analyses comparing edge to centre for all tumour models are shown using gene sets for proliferation genes, quiescent stem cells, cancer stem cells (CSC) and intestinal stem cells (ISC). FDR, false discovery rate, NES, normalized enrichment score, n = 2 independent tumours per group. (e) RNA sequencing profiles for CSC marker genes are shown to compare edge and centre regions, two replicates were included for each line (r1-r2). (f) qPCR for LGR5 and TOP-GFP on Co100.G7 edge (E) or centre (C) tissue is shown, n = 5 tumours. (g) Representative images of LGR5 RNA in situ hybridization on Co100 xenograft sections. (h) Quantification of LGR5 mRNA expression (LGR5+ area) in the edge and centre region of 3 different xenograft models is shown. Data in g, h are representative of 4 (Co100), 3 (HCT-15) or 4 (CC09) independent tumours. (i, j) AC133 expression was revealed by immunofluorescence, representative of 5 independent tumours (i), and flow cytometry, n = 2 independent tumours (j). Scale bars, 100 µm. (k) Images of edge and centre regions showing TOP-GFP (green) and nuclear stain, Hoechst (blue), representative of 8 independent tumours. (l) Quantification of TOP-GFP positive area in Co100.G7 xenografts is shown in edge or centre of Co100.G7 (n = 8) xenografts. (f, h, j, l) Two-tailed Paired Student’s t-test, n.s., not significant. All data is represented as mean ± S.D.
Figure 5
Figure 5. In situ clonogenicity is environmentally defined.
(a) Proliferative cells were identified by staining for Ki67 (yellow) in re-grafted tumour tissue from a Co100 xenograft centre. Scale bars, 100 µm. Examples represents 5 tumours per group. (b-d) Limiting dilution assays were used to compare in vitro (b, c) or in vivo (d) clonogenicity of either all cells (b), or TOP-GFPhigh and TOP-GFPlow fractions (c, d) from the edge and centre of the tumour, using the (ELDA) ‘limdil’ function, data is represented as mean ± 95% confidence intervals, n = 8 per dilution. (e-f) Mean clonogenic fraction of cell lines was correlated with time to tumour take in vivo (e), and with average growth rates of xenografts (size > 100 mm3), as inferred from surface growth model fits (f). Pearson correlation are shown for Co100 (n = 29), HCT-15 (n = 25), CC09 (n = 51) and HT29 (n = 10) xenografts. Error bars represent 95% confidence interval (y-axis) and S.D. (x-axis) (e, f). (g) Relative amount of mouse reads of tumour edge versus centre obtained from RNA sequencing data are shown, n = 2 tumours per cell line. (h) Presence of activated mouse fibroblasts (αSMA+) cells in edge (E) and centre (C) of Co100 xenografts (data is represented as mean ± S.D., n = 10 xenografts) was compared using paired two-tailed Student’s t-test, (g, h). (i) αSMA (green) and Ki67 (yellow) staining was performed on Co100 xenografts. Scale bars, 100 µm. Lower image is a magnification of the box in upper image. Representative of 8 tumours. (j) Average distance of either all or proliferating (Ki67+) cells to the nearest αSMA+ fibroblast in Co100 xenografts (n > 20.000 cells from 8 independent tumours). (k) Co100 tumour, 14 days after label activation, showing mStrawberry clones (red) and activated stromal cells (αSMA, green), representative of 5 independent tumours. Scale bar, 250 µm. (l) Average distance of either large clones (clone > 10 cells) or small clones to the nearest αSMA+ fibroblast in Co100 xenografts (n > 100 clones from 5 independent tumours). Error bars indicate S.D. (j, l).
Figure 6
Figure 6. Osteopontin drives clonogenicity in vivo.
Co100 tumour cells were adherently seeded as single cells, with or without human or mouse primary intestinal fibroblasts. 3 days after seeding, cells were stained for F-Actin (green), Ki67 (red) and nuclear stain Hoechst (blue), representative of 10 images per condition are shown. Scale bars, 100 µm. (b) Quantification of clone sizes as shown in panel a, n = 10 images per condition. OPN overexpressing Co100 tumour cells (Co100.OPN) were subcutaneously grafted into nude mice. (c) Growth curves of xenografts of Co100 (as shown in Fig. 3d) and Co100.OPN (red triangles). Data is represented as mean ± S.E.M. (d) Growth rates of Co100 and Co100.OPN xenografts as inferred from best growth fit for each individual tumour (n = 40 and 29 tumours, Co100.OPN and Co100 respectively (c, d)). (e) OPN expression was detected by a human-mouse bi-specific antibody (red) in Co100 xenografts (control and OPN overexpressing) and myofibroblasts were revealed by staining for αSMA (green). Scale bars, 100 µm. Representative images of 5 tumours per group are shown. (f) mStrawberry-positive clones in Co100.OPN xenografts are shown at the indicated time points, F-Actin is shown in green. Scale bars, 100 µm. Representative of 5 independent tumours per group. (g) Clone size distribution of Co100 (black dots) and Co100.OPN (red triangles) is shown at day 21. Data is represented as mean ± S.E.M. (h) Heterogeneity of clone sizes is reduced compared to Co100 control tumours. Depicted is the standard deviation of clones sizes found in Co100.OPN xenografts, normalized to Co100 control tumours. Error bars (Co100.OPN) and grey shade (Co100) indicate S.E.M., time points were compared using Wilcoxon signed-rank test. (i) Example images of clones in relation to tumour edge in both Co100 and Co100.OPN xenografts are shown. Scale bars, 500 µm. Representative of 5 independent tumours per group. (j, k) Spearman correlation analysis is shown (red line) of clone size and proximity to the tumour edge in Co100 (j) and Co100.OPN tumours (k). Source data for (g, h, j, k) are shown in Supplementary Table 1.
Figure 7
Figure 7. Chemotherapy does not fundamentally alter the growth dynamics of cancer.
(a) Co100 tumours were treated with a combination of Oxaliplatin (3 mg/kg, 1x/week) and 5-FU (15 mg/kg, 2x/week) and lineage tracing was performed. Viable tumour cell volume in time is shown, together with surface model fits (dashed lines). Control data is from Fig. 3d. N = 29 (control) and 26 (Oxa-5FU) tumours, data is represented as mean ± S.E.M. (b, c) Representative immunofluorescence images (b) and quantification (c) of TOP-GFP (green) expression in control or treated Co100 (n = 8 and 9) tumours. (d, e) Representative images (d) and quantification (e) of in situ hybridisation of LGR5 mRNA in control and treated Co100 tumours, n = 4 (control) or 5 (Oxa-5FU) tumours per group. (c, e) Data is represented as mean ± S.D. (f) Example images of clones detected in the presence of therapy are shown. Scale bars, 100 µm (b, d, f). (g) Relative clone frequency (heatmap colours) per binned size (in columns) and time (rows) for treated Co100 tumours is shown. Number of clones and tumours (parenthesized) are indicated next to each time point. (h) Inference of the temporally changing clone size distributions with the stochastic model. Dots indicate optimal fit (black, Oxa-5FU; red, Control) heatmap is shown in Fig. 2. Data is represented as mean ± S.D., source data for (f-h) are shown in Supplementary Table 1. (i) Ki67+ cells (yellow) are in proximity of stromal cells (αSMA, green). Scale bars, 100 µm. Representative of 7 independent tumours. (j) Average distance of either all or proliferating (Ki67+) cells to the nearest αSMA+ fibroblast in treated Co100 tumours (n = 20.000 cells from 7 tumours). (k) Image of a treated Co100 tumour, showing mStrawberry clones and αSMA+ cells (green). Scale bar, 500 µm, representative of 4 tumours. (l) Mean distance of either large clones (clone > 10 cells) or small clones to the nearest αSMA+ fibroblast in Co100 tumours treated with Oxaliplatin-5FU (n = 100 clones from 4 tumours, error bars represent S.E.M.). (c, e, j, l) Groups were compared using paired two-tailed Student’s t-test.

Comment in

  • Microenvironmental cues in cancer stemness.
    Flanagan DJ, Hodder MC, Sansom OJ. Flanagan DJ, et al. Nat Cell Biol. 2018 Oct;20(10):1102-1104. doi: 10.1038/s41556-018-0210-4. Nat Cell Biol. 2018. PMID: 30258126 No abstract available.

References

    1. Vermeulen L, et al. Defining stem cell dynamics in models of intestinal tumor initiation. Science. 2013;342:995–998. - PubMed
    1. Kozar S, et al. Continuous clonal labeling reveals small numbers of functional stem cells in intestinal crypts and adenomas. Cell stem cell. 2013;13:626–633. - PubMed
    1. Ritsma L, et al. Intestinal crypt homeostasis revealed at single-stem-cell level by in vivo live imaging. Nature. 2014;507:362–365. - PMC - PubMed
    1. Snippert HJ, et al. Intestinal crypt homeostasis results from neutral competition between symmetrically dividing Lgr5 stem cells. Cell. 2010;143:134–144. - PubMed
    1. Barker N, et al. Identification of stem cells in small intestine and colon by marker gene Lgr5. Nature. 2007;449:1003–1007. - PubMed

Publication types

MeSH terms