. 2018 Oct;2(10):1661-1672.
doi: 10.1038/s41559-018-0642-z. Epub 2018 Aug 31.

The evolutionary landscape of colorectal tumorigenesis

Collaborators, Affiliations

The evolutionary landscape of colorectal tumorigenesis

William Cross et al. Nat Ecol Evol. 2018 Oct.

Abstract

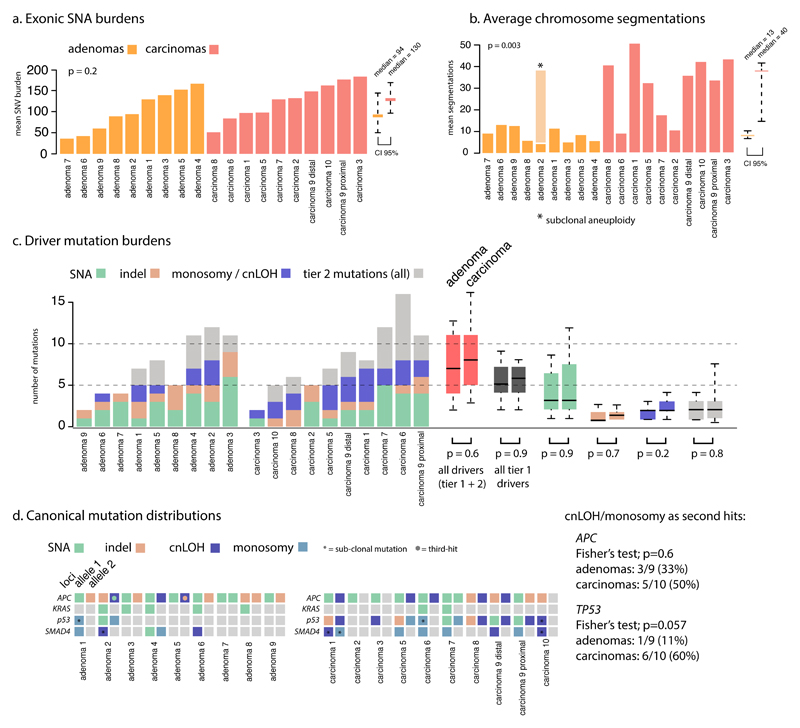
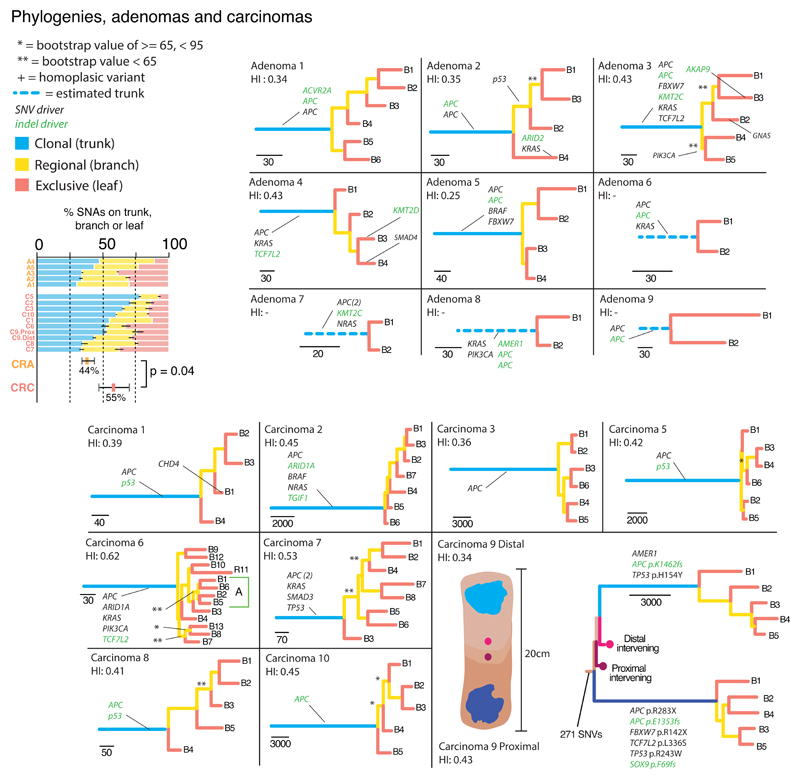
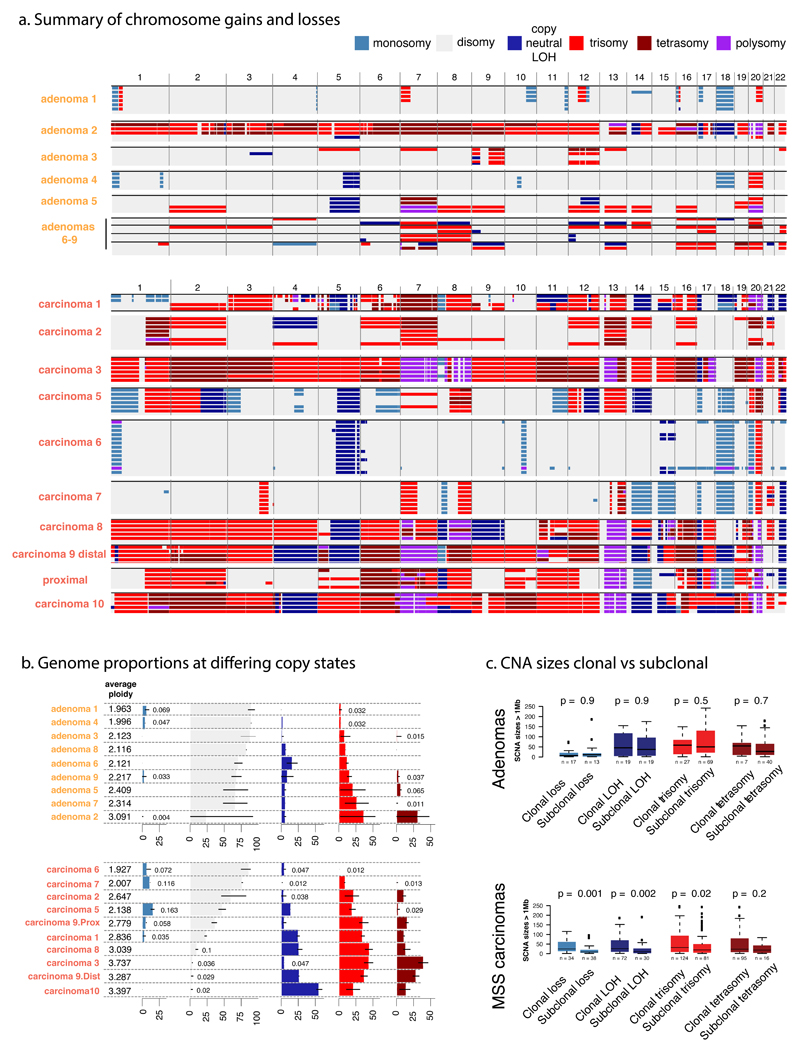
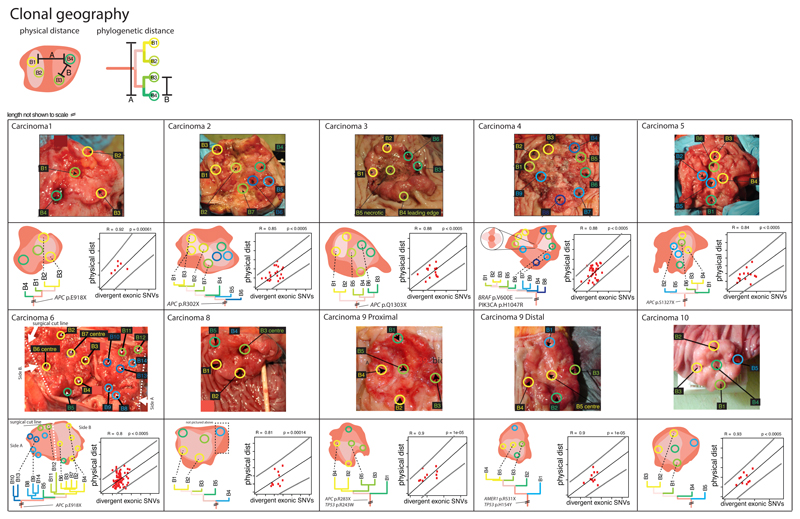
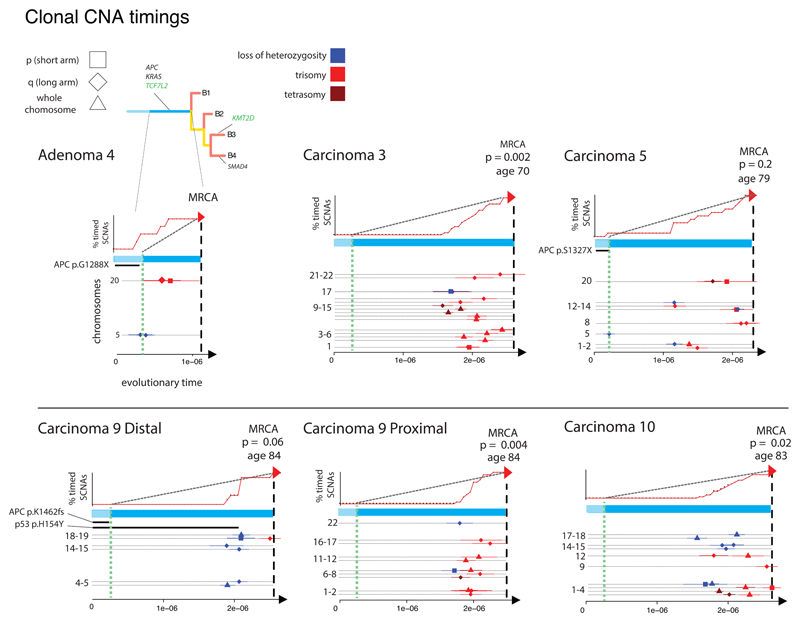
The evolutionary events that cause colorectal adenomas (benign) to progress to carcinomas (malignant) remain largely undetermined. Using multi-region genome and exome sequencing of 24 benign and malignant colorectal tumours, we investigate the evolutionary fitness landscape occupied by these neoplasms. Unlike carcinomas, advanced adenomas frequently harbour sub-clonal driver mutations-considered to be functionally important in the carcinogenic process-that have not swept to fixation, and have relatively high genetic heterogeneity. Carcinomas are distinguished from adenomas by widespread aneusomies that are usually clonal and often accrue in a 'punctuated' fashion. We conclude that adenomas evolve across an undulating fitness landscape, whereas carcinomas occupy a sharper fitness peak, probably owing to stabilizing selection.


Conflict of interest statement

The authors have no competing interests to declare.

Figures

Figure 1
Figure 1. Mutation burdens in CRAs and CRCs
a. CRAs tended to have slightly fewer exonic SNAs than CRCs but the difference was not significant. The average burden and 95% range across these different tumours is shown by the rightmost bars. b. The number of individual CNAs (as measured by the number of segmentations) is significantly greater in CRCs than CRAs (p=0.003, 95% range shown by bars). c. SNA driver mutation burdens and allelic loss of 5q, 17p and 18q, are shown for each tumour. A comparison of all events is show by the red bars, while tier 1 driver changes exclusively are shown in dark grey, with tier 2 in light grey. d. Distribution of canonical driver mutations across tumours. APC is the only ubiquitous driver event. There is no significant enrichment of cnLOH mutations as second hits to APC or TP53 mutations in adenomas compared to carcinomas (though TP53 is borderline).
Figure 2
Figure 2. Phylogenetic analysis of CRAs and MSS CRCs
Maximum parsimony construction of evolutionary trees. For tumours with only two regional biopsies, truncal mutations were simply those shared between the regions. Tier 1 driver mutations (Table S3) are shown, illustrating their enrichment on the trunks, especially in CRCs, indicating they are acquired early in evolutionary time. Phylogenetic trees showed were produced using all available SNAs. Tree shape robustness (branch support) was confirmed by bootstrapping. Branches had greater than 95% support unless otherwise stated (44/55 (80%) of branches had >95% support). The most parsimonious trees are shown except in carcinoma 6, where one clade could not be resolved (A: green box). Left Bar chart: Ubiquitous SNAs (found in all regional biopsies and on the trunk of the phylogenetic tree) are compared with sub-clonal SNAs on the phylogenetic tree branches (non-ubiquitous, but present in >1 region) and leaf (present in only one region). CRAs have a smaller proportion of ubiquitous variants than CRCs.
Figure 3
Figure 3. Copy number alterations in CRAs and MSS CRCs
a. A genome-wide view of CNAs is shown for each region of CRAs (top) and CRCs (bottom). Cancers show a greater CNA burden than adenomas, and most CNAs are clonal in cancers, whereas CRAs show more frequent sub-clonal CNAs. Copy number ≥5 is shown as “polysomy”. b. The figure shows estimated ploidy and summarises the proportion of each tumour at different copy-states. Black bars show the range of biopsy copy-numbers. c. Size distributions of ubiquitous and sub-clonal (branch and leaf) CNAs demonstrate the preference of CRCs to have larger events. Boxplots show the median and inter quantile range (IQR), upper whisker is 3rd quantile + 1.5*IQR and lower whisker is 1st quantile - 1.5*IQR. The colour-coding of copy number states (top right) applies to all panels.
Figure 4
Figure 4. Geography of CRCs
Photographs of the tumour specimens from histopathology departments are shown, with biopsy locations marked. The sporadic MSI+ cancer 4 is included here. The corresponding phylogenetic relationship between tumour regions is shown below the photograph of each tumour. The regression plots show pairwise physical and genetic separation for each biopsy from that cancer. There was a significant positive correlation between the phylogenetic (mutational) distance and physical distance in every case.
Figure 5
Figure 5. CNA timing
The plots show the CNA timing results for the six neoplasms with WGS data. For each tumour, the X-axis represents inferred evolutionary time to the MRCA, since tumour initiation (unit of measurement is SNAs accrued per unit time). Green dashed line is inferred from the “second hit” at APC (and thus likely represents the time of initiation of the adenoma). The upper panels show the accumulation of CNAs (red, arrowed line) relative to a steady accumulation (black, dashed line); p-values are derived from Kolmogorov-Smirnov tests of inferred CNA time versus a uniform accumulation. The lower panel shows the estimated times of driver mutations, where these could be derived, for individual CNAs by chromosome arm and type of change. Bars indicate 95% confidence intervals for CNA timing estimates.

References

    1. Morson BC. Evolution of cancer of the colon and rectum. Cancer. 1974;34:845–849. - PubMed
    1. Ashton-Rickardt PG, et al. High frequency of APC loss in sporadic colorectal carcinoma due to breaks clustered in 5q21-22. Oncogene. 1989;4:1169–1174. - PubMed
    1. Powell SM, et al. APC mutations occur early during colorectal tumorigenesis. Nature. 1992;359:235–237. - PubMed
    1. Fearon ER, Vogelstein B. A genetic model for colorectal tumorigenesis. Cell. 1990;61:759–767. - PubMed
    1. Jones S, et al. Comparative lesion sequencing provides insights into tumor evolution. Proc Natl Acad Sci. 2008;105:4283–4288. - PMC - PubMed

Publication types