. 2018 Oct;24(10):1590-1598.
doi: 10.1038/s41591-018-0161-0. Epub 2018 Sep 3.

Route of immunization defines multiple mechanisms of vaccine-mediated protection against SIV

Affiliations

Route of immunization defines multiple mechanisms of vaccine-mediated protection against SIV

Margaret E Ackerman et al. Nat Med. 2018 Oct.

Abstract

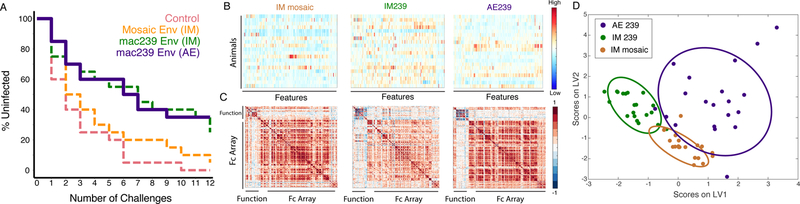
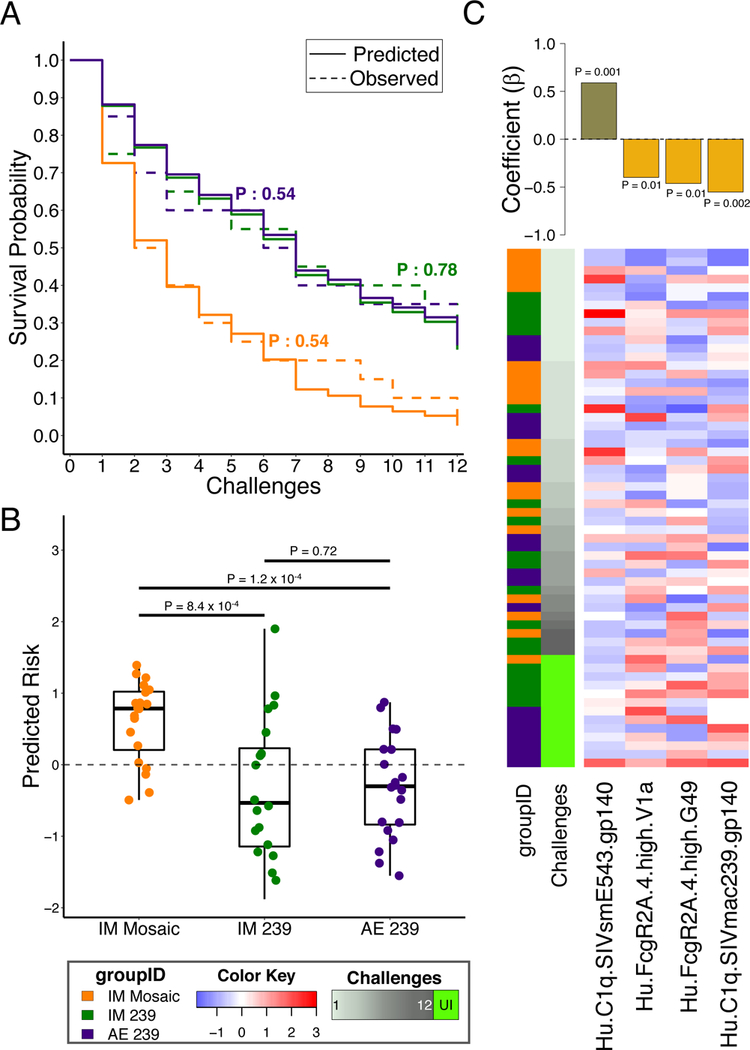
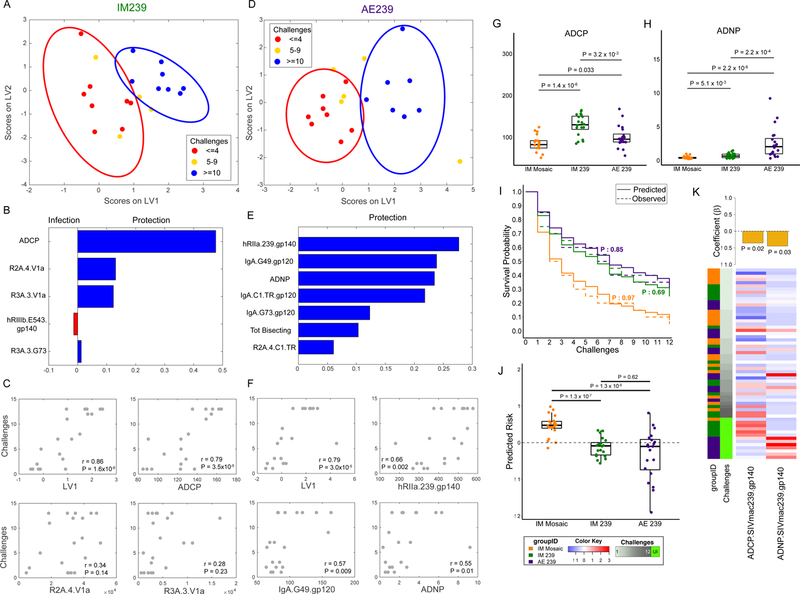
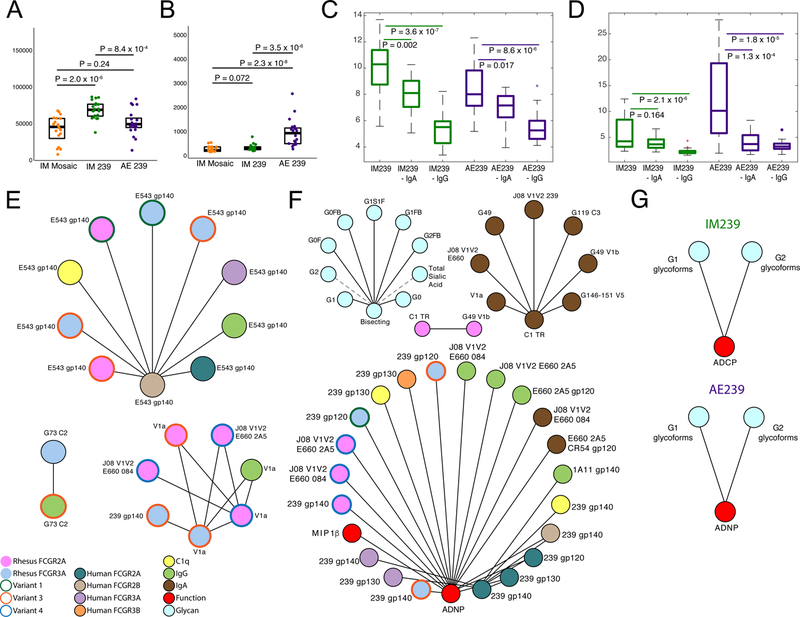
Antibodies are the primary correlate of protection for most licensed vaccines; however, their mechanisms of protection may vary, ranging from physical blockade to clearance via the recruitment of innate immunity. Here, we uncover striking functional diversity in vaccine-induced antibodies that is driven by immunization site and is associated with reduced risk of SIV infection in nonhuman primates. While equivalent levels of protection were observed following intramuscular (IM) and aerosol (AE) immunization with an otherwise identical DNA prime-Ad5 boost regimen, reduced risk of infection was associated with IgG-driven antibody-dependent monocyte-mediated phagocytosis in the IM vaccinees, but with vaccine-elicited IgA-driven neutrophil-mediated phagocytosis in AE-immunized animals. Thus, although route-independent correlates indicate a critical role for phagocytic Fc-effector activity in protection from SIV, the site of immunization may drive this Fc activity via distinct innate effector cells and antibody isotypes. Moreover, the same correlates predicted protection from SHIV infection in a second nonhuman primate vaccine trial using a disparate IM canarypox prime-protein boost strategy, analogous to that used in the first moderately protective human HIV vaccine trial. These data identify orthogonal functional humoral mechanisms, initiated by distinct vaccination routes and immunization strategies, pointing to multiple, potentially complementary correlates of immunity that may support the rational design of a protective vaccine against HIV.


Conflict of interest statement

Competing financial interests

The authors declare no competing financial interests.

Figures

Figure 1
Figure 1. Equivalent protection from SIV acquisition in SIVmac239 immunized animals despite striking Fc-profile differences induced via distinct routes of immunization. (A-D) Mucosal vaccination induces protective immunity.
(A) Kaplan-Meier curves depicting the fraction of animals uninfected in Env-vaccinated and control arms following successive challenges (n = 80 animals). One animal in the IM mosaic, five animals in the IM239, and five animals in the AE239 arm remained uninfected after 12 challenges. Dashed lines correspond to data previously reported in Roederer et al Nature 2014, the solid line corresponds to newly reported data. (B–D) Divergent antibody responses result from modification of route of immunization and immunogen. (B) Heatmaps of humoral responses assessed for Env-vaccinated animals. Rows correspond to animals and columns correspond to the normalized (centered and scaled) Fc array and functional assay readouts (features), where high responses are indicated in red and low responses in blue. (C) Feature versus feature correlation matrices in heatmap form illustrate correlative relationships between all feature pairs within each Env-vaccinated study arm, with correlated responses indicated in red and anti-correlated responses in blue. (D) Partial Least Squares (PLS) latent variable (LV) scores biplot using features selected from an arm classification model illustrating that the groups can be separated accurately based on differences in humoral responses. Ellipses correspond to 95% confidence intervals for each group.
Figure 2
Figure 2. Fc-biophysical antibody binding profiles accurately predict protection across immunogens and routes of administration.
(A) The predicted infection probabilities in the final Cox Proportional Hazards (PH) model closely match observed Kaplan-Meier curves for each of the three Env-immunized study arms (n = 20 animals in each of three arms; P-values: two-sided log-rank test). (B) Animals in the IM mosaic arm have significantly higher predicted risk of infection than those in the other arms in the representative cross-validation run (n = 20 animals in each of three arms; P-values: two-sided Wilcoxon-Mann-Whitney). Boxplots depict the median and interquartile range. (C) Heatmap and feature coefficient plot of the humoral response features (columns) contributing to the final model (coefficients in bars), with one predictive of risk and three of protection (P-values: Cox PH). The animals (rows, n = 60) are ordered in ascending order of time-to-infection. Centered and scaled antibody feature values are presented in heatmap form, with high responses indicated in red and low responses in blue.
Figure 3
Figure 3. Phagocytic vaccine-specific functional antibodies predict protection from infection.
(A,D) PLS LV scores biplot using features selected from a challenge outcome classification model for IM239 (A) and AE239 (D) illustrating stratification of animals based on number of challenges survived. Ellipses correspond to 95% confidence intervals for each group. (B,E) Variable Importance in the Projection (VIP) plot for IM239 (B) and AE239 (E) models illustrating the contribution of each humoral response feature used to stratify the animals. (C,F) Scatter plots illustrating the correlation between number of challenges and I) LV1 from the PLS model and II) the three individual variables making the greatest contribution to the model (n = 20 animals in each of the two arms; two-sided P-values for Spearman’s rho). (G,H) ADCP (G) and ADNP (H) activity by arm (n = 20 animals in each of the two arms; P-values: two sided Wilcoxon-Mann-Whitney). Boxplots depict the median and interquartile range. (I) Comparison of observed KM curves with those predicted by Cox models learned from the functional antibody features (n = 20 animals in each of the two arms; two-sided log-rank test P-values). (J) Animals in the IM Mosaic arm have significantly higher predicted risk of infection than those in the other arms in the representative cross-validation run (n = 20 animals in each of the three arms; P-values: two-sided Wilcoxon-Mann-Whitney). Boxplots depict the median and interquartile range. (K) Heatmap and feature coefficient plot of the two functional features. (P-values: Cox PH). The animals (rows, n = 60) are ordered in ascending order of time-to-infection. Centered and scaled phagocytic activity values are presented in heatmap form with high responses indicated in red and low responses in blue.
Figure 4
Figure 4. Dissecting mechanisms of arm-specific protection.
(A&B) Arm-wise comparison of IgG (A) and IgA (B) measurements (n = 20 animals in each of the two arms; P-values: two sided Wilcoxon-Mann-Whitney) indicating distinct isotype profiles associated with route of administration. (C&D) Arm-wise comparison of the impact of IgA and IgG depletion on ADCP (C) and ADNP (D) activity (n = 20 animals in each of the two arms; P-values: two-sided Wilcoxon-Mann-Whitney for pairwise comparisons). (E&F) Co-correlate networks illustrating variables that are significantly correlated with biomarkers linked to protection for the IM239 (E) and AE239 (F) study arms. (G) Arm-specific non-linear relationships between functional correlates of protection and glycans. Boxplots depict the median and interquartile range.
Figure 5
Figure 5. DNA/rAd5 minimal biomarkers of vaccine response also predict protection in ALVAC-protein immunized NHPs.
(A) Scatter plots illustrating the correlation (Spearman) of the four individual co-correlates (ADCP, ADNP, FcγR2A, and IgA) identified in the DNA/rAd5 vaccine groups with protection (i.e., number of challenges required to achieve infection) in the ALVAC/protein immunized animals (n = 18 animals; two-sided P-values for Spearman’s rho). (B) Biplot depicting the correlation between observed and predicted challenge outcomes of ALVAC/protein-immunized animals based on the challenge outcome regression model learned from the DNA/rAd5 vaccine (n = 18 animals; two-sided P-values for Spearman’s rho). (C) Survival curves depict actual and predicted infections using a Cox PH model utilizing the integrated four co-correlates (n = 18 animals; P-value: two-sided log-rank test).

Similar articles

Cited by

References

    1. Rerks-Ngarm S, et al. Vaccination with ALVAC and AIDSVAX to prevent HIV-1 infection in Thailand. N Engl J Med 361, 2209–2220 (2009). - PubMed
    1. Haynes BF, et al. Immune-correlates analysis of an HIV-1 vaccine efficacy trial. N Engl J Med 366, 1275–1286 (2012). - PMC - PubMed
    1. Barouch DH, et al. Protective efficacy of adenovirus/protein vaccines against SIV challenges in rhesus monkeys. Science 349, 320–324 (2015). - PMC - PubMed
    1. Barouch DH, et al. Protective efficacy of a global HIV-1 mosaic vaccine against heterologous SHIV challenges in rhesus monkeys. Cell 155, 531–539 (2013). - PMC - PubMed
    1. Alpert MD, et al. ADCC develops over time during persistent infection with live-attenuated SIV and is associated with complete protection against SIV(mac)251 challenge. PLoS Pathog 8, e1002890 (2012). - PMC - PubMed

Publication types

MeSH terms